By Kent R. Kroeger (Source: NuQum.com; April 24, 2019)
It is OK to be skeptical when it comes to End-Is-Nigh, Chicken Little alarmism over climate change. Yes, the earth is warming due mostly to human activities. And, yes, the sooner we transition to clean energy the better off we will be going forward.
But while I defer to the climatologists on the science of global warming and its probable consequences, my persistent belief is that humankind can and will accommodate, remediate, and even profit from climate change in the long-run. The upward sweeping arc of human history supports my confidence.
Furthermore, I will be long dead and unable to recalibrate my predictive model should my optimism prove wrong — which is also true of the pessimistic forecasts made by climatologists. Should their long-range predictions be substantively wrong that global warming will lead to major cities underwater, widespread famine, mass extinctions, and increased human warfare, they won’t be around to apologize.
And the scientists know that — which may explain their often extravagant claims about humankind’s future should we fail to address climate change.
And such is the dynamic when climate science interacts with the mainstream media and the political opportunists who offer us drippy, moralizing scolds such as: Your grandchildren will suffer the consequences of your inaction today. What did you do to fight climate change grandma/grandpa?
It’s cheap, exploitative rhetoric. And doesn’t change a single opinion. It merely forces everyone into their respective ideological corners.
But that doesn’t mean the underlying premise is wrong. Something isdifferent in the global climate system and tropical cyclones (we call them hurricanes in the U.S.) appear to be at the center of this change.
While climate change deniers ignore data, skeptics require it
The earth’s continuously produces new climate data and with every new data point, we potentially learn something.
But, as we are often told by climate scientists and their dutiful propagandists, don’t confuse weather with climate. Which is, of course, something they allow themselves to do without restraint.
So was the case, in March, when Tropical Cyclone Idai, a strong but not unprecedented Category 3 storm (minimum center pressure 940 mbar; highest sustained winds 120 mph), caused around $1 billion in damage in Mozambique, Tanzania and Malawi and killed over 1,000 people, mostly from flooding.
On cue, like a Broadway dance number, international bureaucrats, climatologists, and the news media declared this natural disaster belongs on the climate change damage ledger.
NPR used the term “climate change refugees” to describe the 2 million people displaced by Cyclone Idai’s floods.
This is going to happen more often, reinforced the scientists.
“There is absolutely no doubt that when there is a tropical cyclone like this (Idai), then because of climate change the rainfall intensities are higher,” according to Oxford University’s Dr. Friederike Otto. “And also because of sea-level rise, the resulting flooding is more intense than it would be without human-induced climate change.”
“The interesting thing for the area (Southern Indian Ocean) is that the frequency of tropical cyclones has decreased ever so slightly over the last 70 years,” according to the South African climatologist Dr. Jennifer Fitchett. “Instead, we are getting a much higher frequency of high-intensity storms.”
Others focused on the demography of Cyclone Idai’s most defenseless victims.
“As is always the case, the poor and vulnerable are the first to suffer and the worst hit,” said UN Secretary General António Guterres, as he spoke about Cyclone Idai at the World Meteorological Organization (WMO ) summit in New York in March.
But should everyone be trimming their sails when relating the devastation from a single tropical cyclone, such as Cyclone Idai, to climate change?
As with any single weather event, determining the marginal impact of global warming is problematic and not particularly helpful. But, when looking over long periods of time, a clear trend is emerging in the data for tropical cyclones: They aren’t more frequent, but on average they are becoming more powerful (and wetter).
And, most ominously, the average strength of tropical cyclones by the end of this century will be significantly stronger than today.
The Data and Methods
The data used in this essay were provided by the National Oceanic and Atmospheric Administration (NOAA) and is part of a worldwide database it maintains called the International Best Track Archive for Climate Stewardship (IBTrACS). This database can be accessed directly at:
The specific IBTrACS variables used for the analyses here were:
SID: A unique storm identifier assigned by IBTrACS
SEASON: Season (year) that the storm began
BASIN: Basin of the current storm position
NAME: Name of system given by source (if available)
ISO_TIME: Time of the observation in ISO format (YYYY-MM-DD hh:mm:ss)
_WIND: Wind speed units (in knots)
_PRES: Minimum central pressure (millibars)
Only storms whose maximum wind speed during its lifetime was at least 40 knots (miles per nautical mile) were included in this analysis. Duplicate SIDs were eliminated by assigning those storms to the basin of origin.
The Results: Tropical Cyclones are getting stronger
While Cyclone Idai was not unusually strong for a South Indian Ocean tropical cyclone, it was one of nine “intense tropical cyclones” in the South-West Indian Ocean this season (2019) — a region that typically experiences around three intense storms each season.
Using Cyclone Idai as the dividing line, Figure 1 shows the percentage of all South Indian Ocean tropical cyclones by decade whose minimum central pressure (millibars) over its lifetime was lower than Idai’s.
Figure 1 suggests tropical cyclones in the South Indian Ocean have been getting stronger on average since 1960. In the 1960s, only 5 percent of tropical cyclones in the South Indian Ocean exceeded Cyclone Idai’s strength. Between 2010 and 2019, 27 percent of tropical cyclones in the South Indian Ocean exceeded Cyclone Idai’s strength.
The biggest decade-to-decade increase was between the 1970s and 1980s (+13.2%). Since the 1980s, however, the percentage of Idai-strength storms (or higher) has been relatively stable with no clear trend. Though beyond the capacity of this analysis to answer the question, it is fair to wonder if improvements and frequency of aircraft and satellite measurements of tropical cyclone location, wind speed, and intensity played a role in the change in average storm intensity between the 1970s and 1980s.
Figure 1: Tropical Cyclone Strengths in Comparison to Cyclone Idai (1960 to present, South Indian Ocean only)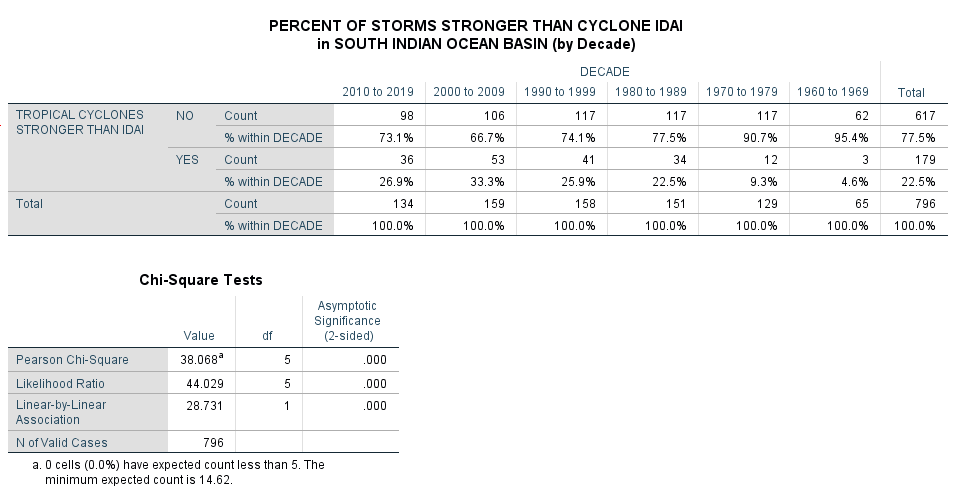
Citing research by Dr. Christopher Velden (et al. 2006), according to NOAA, “Satellites have experienced an increasing capability to probe and understand tropical cyclone environments and structure. Meteorological satellite observations began in the 1960s with merely identifying the systems from space. Researchers then developed a technique to estimate intensity from the storm cloud structure and lifetime. However, the early observations at visible and infrared wavelengths were limited in that they could only observe cloud tops. Routine microwave imager satellites began in the late 1980s and became integrated into forecasting in the 1990s.”
Using only the South Indian Ocean tropical cyclone data, it is hard to rule out the observed increase in storm intensities since the 1960s has been due to measurement improvements.
Thankfully, we have NOAA’s IBTrACS worldwide database of all measured storms since 1960s.
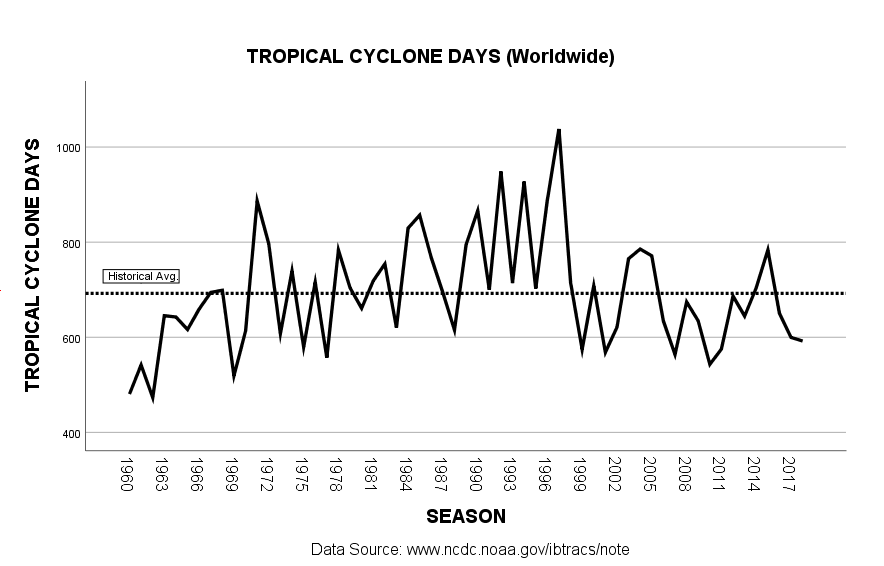
Figure 2 shows the number of worldwide tropical cyclone days, as measured by the annual number of tropical storms multiplied by the average durationof those storms. Again, the increase in tropical cyclone days from 1960 to the mid-1990s may be due to an improved measurement regimen; but, across the entire time series (1960 to 2018), there is no discernible trend. This finding is consistent with other research on trends in the number or duration of tropical cyclones (e.g., Dr. Jennifer Fitchett’s work).
Figure 2: Tropical Cyclone Days (1960 to present, Worldwide)
The data on tropical cyclone intensity is more illustrative. For example, the average tropical cyclone in the period from 1960 to 1980 had a minimum central pressure (MCP) around 969 mb (see Figure 3 below). From 2000 to 2018, however, the average central pressure has varied around 964 mb. That may seem like a small difference, but that is the difference between winds in the 74–95 mph range (Category 1) and a 96–110 mph range (Category 2). Small changes matter in tropical storm strength.
Is that 970 mb to 963 mb trend real, or also a product of variance in measurement accuracy and frequency over time?
Figure 3: Average Minimum Central Pressure per Tropical Cyclone (1960 to present, Worldwide)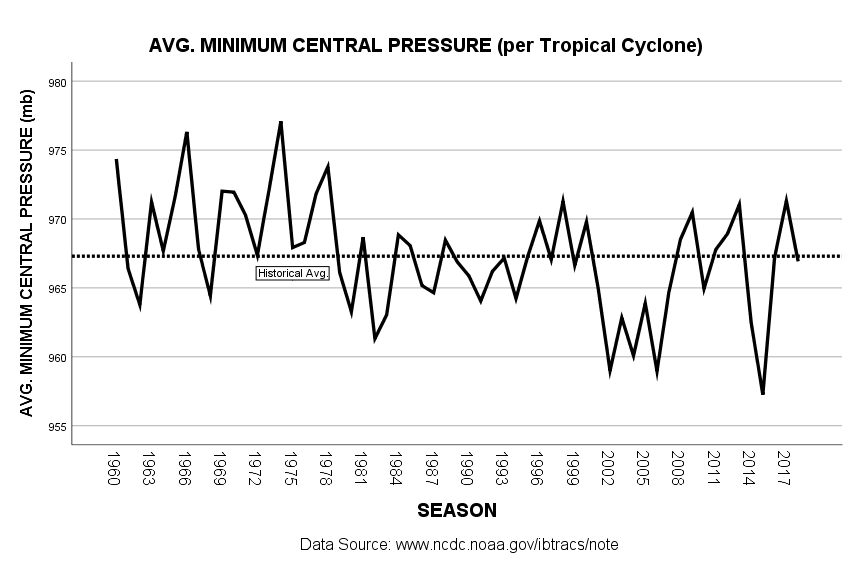
Measurement quality variance appears, in the case of storm intensity, to be swamped by an underlying trend towards stronger storms over time. How do we know this? Because selection of the analysis’ starting year does not impact the negative central pressure trend (i.e., increasing storm intensity) until the starting point is in the 1990s (which is well after satellite-based intensity measurements had matured).
Unlike tropical cyclone frequency, there appears to be a distinct, secular trend in storm intensities. They are getting, on average, stronger.
How much stronger?
A simple linear model explaining average MCP reveals a significant negative trend since 1960 (see Figure 4). The average MCP declines .092 mb every year. The estimated model, for example, predicts an average MCP of 964.6 in 2019, dropping to 957.1 by 2100.
Figure 4: Linear Model of Average Minimum Central Pressure per Tropical Cyclone (1960 to present, Worldwide)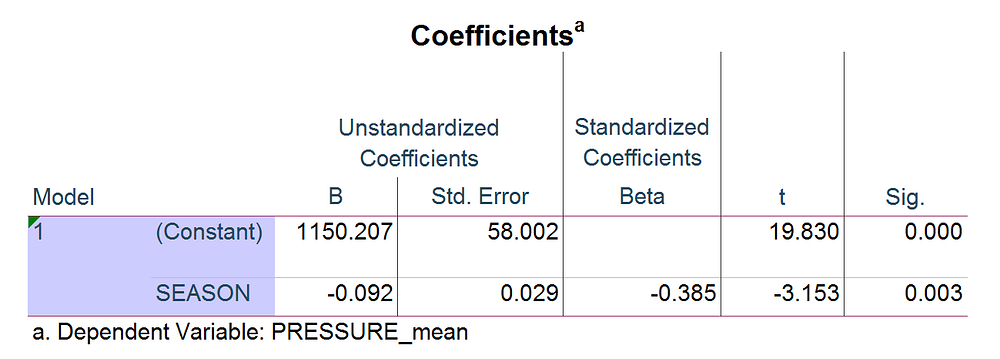
A predicted drop of 7.5 mb between now and the century’s end may seem small, but it is not. It is the difference between an average storm being a relatively manageable Category 1 storm (74–95 mph range) and a more dangerous Category 3 storm (111–129 mph range).
Let it sink in. The AVERAGE storm will be a Category 3 in 2100.
For a more tangible comparison, it is the difference between Hurricane Isaac (2012) and Hurricane Belle (1976).
Hurricane Isaac, a Category 1 storm (965 mbar; highest sustained winds 80 mph) hit Haiti, Cuba, and Louisiana/Mississippi, causing $3.1 billion (2012 USD) in damage and killing 34 people. Though a relatively weak tropical cyclone it made landfall multiple times (Haiti, Cuba, and the U.S. Gulf Coast), doing extensive damage in Haiti and Cuba.
Hurricane Belle, in contrast, was a stronger Category 3 storm (957 mbar; highest sustained winds 120 mph) but caused significantly less damage ($100 million in 1976 USD) than Isaac as its eye didn’t make landfall until Jones Beach, Long Island (New York) as a much weaker Category 1 storm.
A better example might be Hurricane Fran (1996) which hit Cape Fear, North Carolina as a Category 3 storm (120 mph sustained winds) and caused over $5 billion (1996 USD) in damage and killed 22 people.
It is scary to think children alive today will see over their lifetime the average tropical cyclone go from a Category 1 to a Category 3. While I do not recommend doing this, a strong adult could stand outside through the brunt of a Category 1 storm (assuming they are not in an area prone to flooding or storm surge). That same person would not be able to do that in Category 3 storm. A Category 3 tropical cyclone is a serious meteorological phenomenon and a grave danger to anyone in its path.
Though storm surges associated with tropical cyclones are highly variable and dependent on numerous factors besides storm intensity, a Category 3 storm can easily experience storms surges around 20 feet. According to NOAA, in U.S. coastal areas a storm surge of 23 feet has the ability to inundate 67 percent of interstates, 57 percent of arterials, almost half of rail miles, 29 airports, and virtually all ports in the Gulf Coast area.
Category 3 tropical cyclones are a different beast and that is going to be the norm for our planet’s tropical cyclones by the end of the century.
Luckily, I won’t be around to experience this new reality or apologize should my prediction prove wrong.
- K.R.K.
Data, computer code, and modeling equations available upon request to kroeger98@yahoo.com
REFERENCE:
Velden, C., B. Harper, F. Wells, J.L. Beven, R. Zehr, T. Olander, M. Mayfield, C.“. Guard, M. Lander, R. Edson, L. Avila, A. Burton, M. Turk, A. Kikuchi, A. Christian, P. Caroff, and P. McCrone, 2006: The Dvorak Tropical Cyclone Intensity Estimation Technique: A Satellite-Based Method that Has Endured for over 30 Years. Bull. Amer. Meteor. Soc., 87 , 1195–1210, https://doi.org/10.1175/BAMS-87-9-1195


 At a rally in Minnesota last summer, Donald Trump invited his audience to offer its opinion on the “fake news” media. Photo: Scott Olson/Getty Images
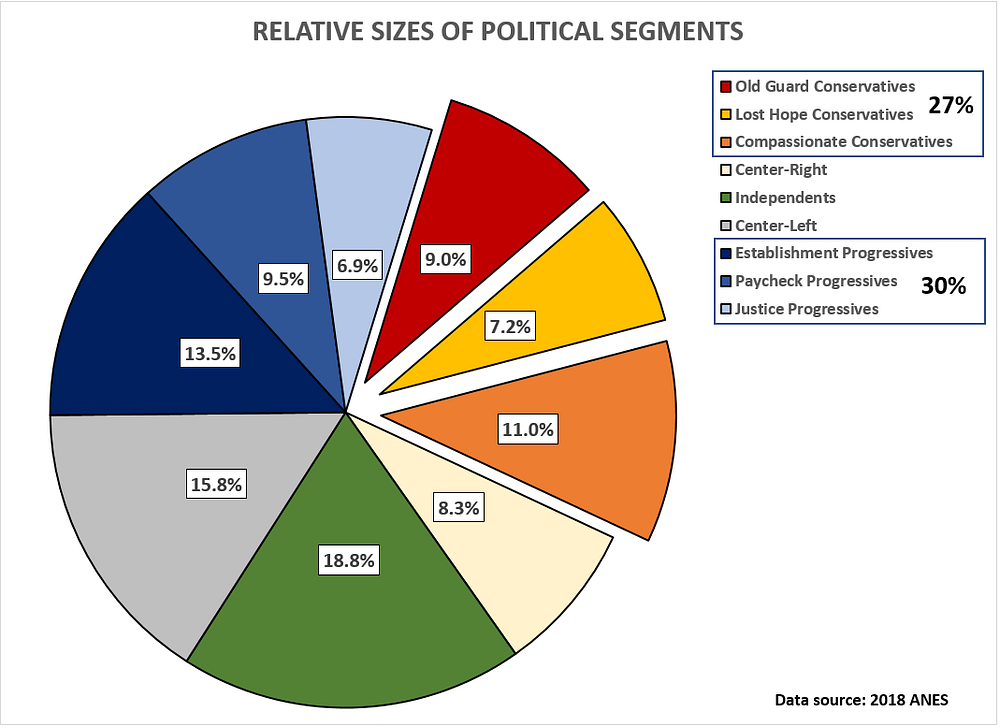
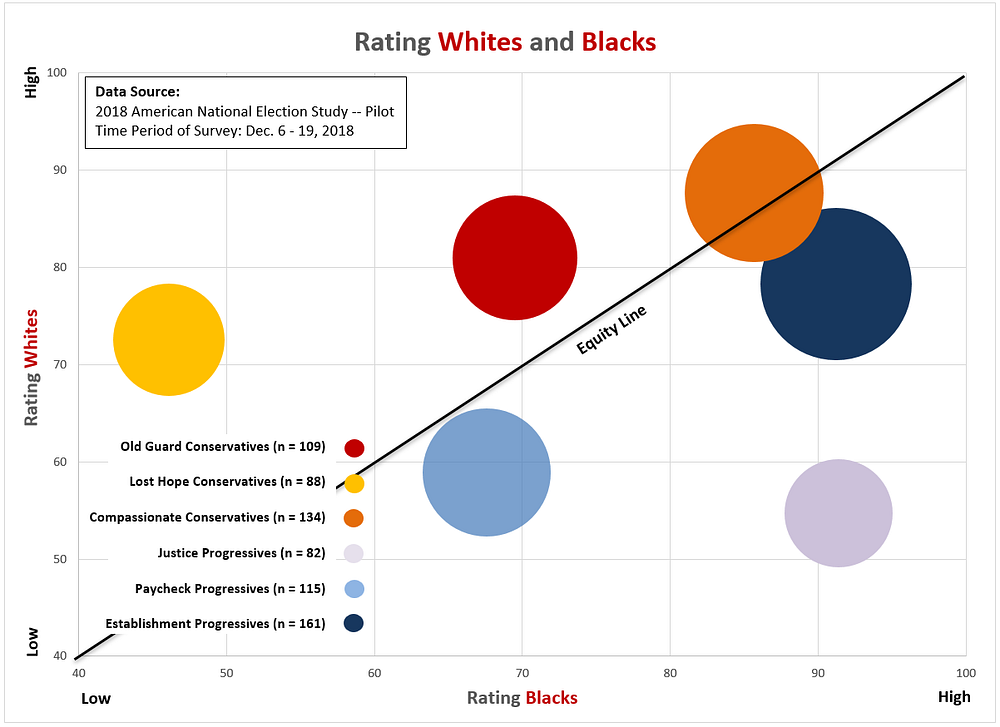
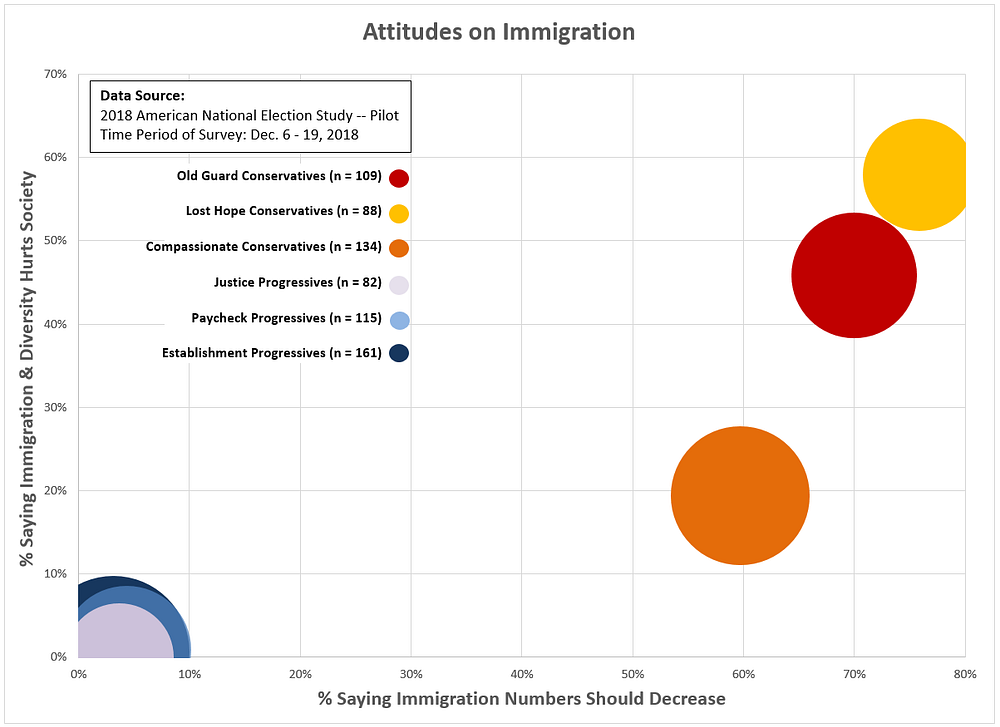
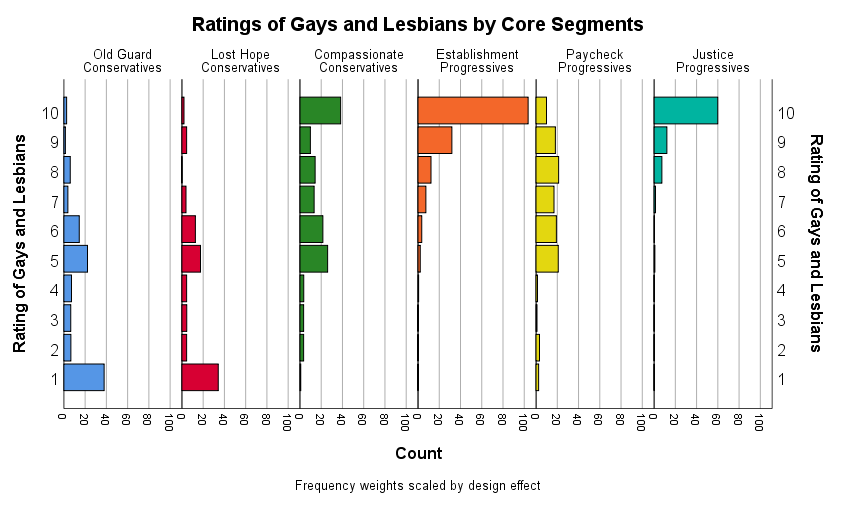

 Data Source: 2018 National Election Study (Pilot); Analytics and Segmentation by Kent R. Kroeger