Monthly Archives: July 2022

Biden won in 2020, but absentee voting remains a tangible threat to U.S. elections

By Kent R. Kroeger (Source: NuQum.com; July 26, 2022)

Regardless of what we hear today in the national news media, the potential for voter fraud has been and remains a critical issue in U.S. elections, even though past U.S. elections have not experienced widespread voter fraud (including the 2020 presidential election).

One reason for this is that leaders in both the Republican and Democratic parties, at least before 2020, generally agree that protecting the integrity of the voting process is vital to election legitimacy. And efforts to ensure that legitimacy identify absentee voting as one of the weakest links in the voting process.

To illustrate, during a North Carolina voting commission meeting in 2018, the state’s Attorney General, Josh Stein, a Democrat, said “the bulk of voter fraud is by absentee.”

At the time, that was not a controversial statement. Academic research and investigative journalism on vote fraud has frequently found absentee voting is vulnerable to fraud (examples herehereherehere and here). A North Carolina congressional race would have been stolen by the Republicans in 2018 through ballot harvesting fraud had not one of their operatives, the recently deceased McCrae Dowless, been particularly careless in paying campaigns workers to collect absentee ballots (a crime in North Carolina) and, in some cases, filling out incomplete ballots (also a crime).

Before the toxic partisanship of today’s political environment, a 2005 bipartisan study on the health of the U.S. electoral system, chaired by former President Jimmy Carter and former Secretary of State James Baker, concluded:

“Absentee balloting is vulnerable to abuse in several ways: Blank ballots mailed to the wrong address or to large residential buildings might get intercepted. Citizens who vote at home, at nursing homes, at the workplace, or in church are more susceptible to pressure, overt and subtle, or to intimidation. Voting buying schemes are far more difficult to detect when citizens vote by mail. States therefore should reduce the risks of fraud and abuse in absentee voting by prohibiting “third-party” organizations, candidates, and political party activists from handling absentee ballots.”

The Commission on Federal Election Reform (CFER) concluded that “absentee ballots remain the largest source of potential voter fraud,” and proposed mitigating the risks of absentee balloting — which the Commission considered a necessary component of an electoral system designed to maximize voter participation — by limiting those who can handle a voter’s ballot to:

  • the voter,
  • a family member,
  • the U.S. Postal Service (or legitimate shipper of U.S. mail),
  • and election officials.

As of May 2022, 25 states allow some form of “ballot harvesting” where a third-party, approved by the voter, can deliver a completed ballot to election officials. Within those 25 states, laws vary on who qualifies to vote absentee, on who may not deliver completed ballots, and on the number of ballots that designated third-parties can deliver.

Sadly, on the issue of absentee voting and third-party ballot handling, the recommendations of the CFER have gone largely ignored.

And here we persist, today, in the shadow of a 2020 election that was unique in many ways, not the least of which was the percentage of votes cast through absentee ballots due to the COVID-19 pandemic.

Why do some people remain convinced there was widespread voter fraud in the 2020 election?

I have not seen any proof of systemic vote fraud in the 2020 election, but some people believe it did exist — often citing very sketchy evidence.

Case in point: Dinesh D’Souza’s documentary film, 2000 Mules. While provocative and worth viewing, the film was only a first step in what should have been a more thorough and scientific investigation. Instead, the film’s most important conclusions were almost entirely predicated on odd coincidences, not irrefutable proof.

Can we conclude that there was election fraud if people who delivered absentee ballots at drop-off boxes are known — through geolocation data from cellphones — to have passed by those drop-off boxes multiple times over the course of the election? No, we cannot.

Coincidence, while it can prompt more thorough scientific investigations into important questions about reality, cannot be offered as final proof of anything. If there is one thing statistics has taught me, it is that life is full of coincidences that provide no substantive information for explaining the world.

Yet, if I were a Donald Trump partisan, the coincidences from the 2020 election as portrayed in the graphics in Figures 1 and 2 below — generated from New York Times public-access voting data — would launch me into low-Earth orbit.

Figure 1: Cumulative 2020 Presidential vote results by day and time (Michigan)

Graph by Vote Integrity (Data source: The New York Times)

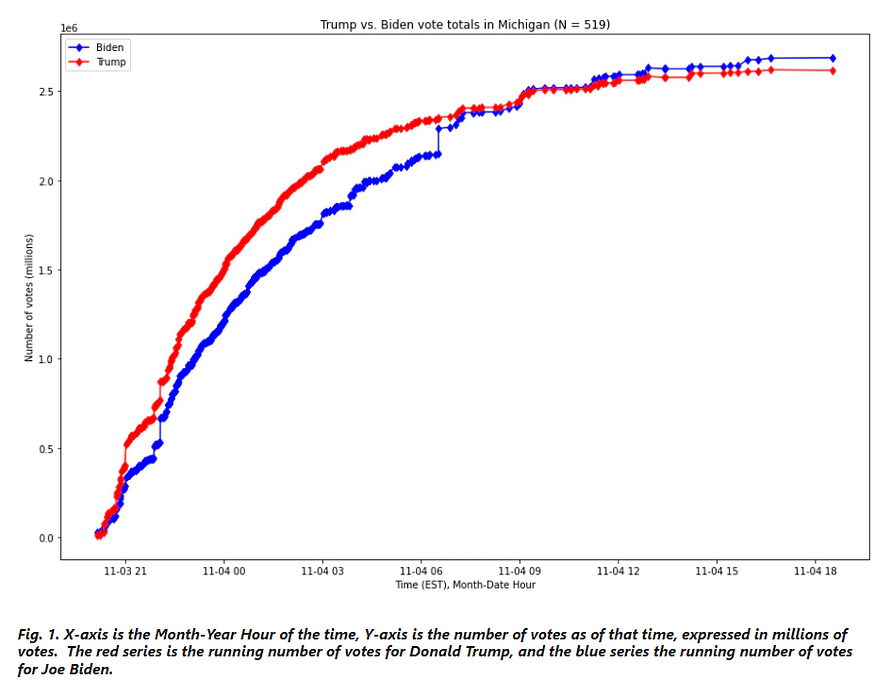
Figure 2: Cumulative 2020 Presidential vote results by day and time (Wisconsin)

Graph by Vote Integrity (Data source: The New York Times)

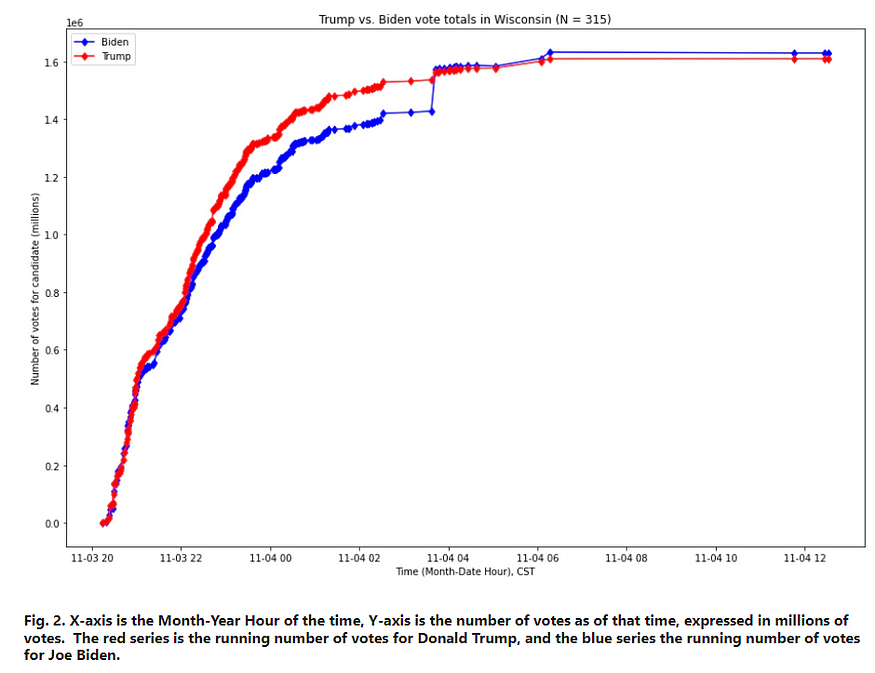
Lumber back in time with me and imagine you are a Trump voter who goes to bed around midnight on election night believing (based on reported voting results) that Trump was comfortably ahead in Michigan and Wisconsin, only to find out the next morning he was behind and in a neck-to-neck battle with Joe Biden.

As we now know, those sudden spikes in the blue lines (Biden votes) in the wee-wee hours of November 4th were the result of absentee ballot counts in large, urban districts being reported in bulk (i.e., predominately Democratic voting areas).

Why couldn’t those absentee votes have been reported earlier? In some states, like Wisconsin, the law mandates absentee ballots cannot be counted before Election Day. But it is fair to ask why absentee ballots, such as in Wisconsin, cannot be included in vote totals on election night?

But this country has never had elections like 2020 in the past, which probably explains why so many people remain dubious of that election’s results. In previous elections, absentee ballots were a minor proportion of total vote totals and rarely were the deciding factor in election outcomes.

That all changed in 2020 — and for good reason, as we were in the midst of a global pandemic and the thought of masses of people converging on in-person voting locations seemed socially irresponsible.

The fact absentee balloting was so essential to the 2020 election is hard to second-guess. It was an unusual year, as was the election itself.

Still, as a natural cynic, I do wonder if this drastic alteration in traditional voting methods did, in fact, play a deciding role in the final outcome in 2020. The Democrats were uniquely positioned to exploit this change in voting mode.

This thought is not the same as saying, the 2020 results were the product of voter fraud. I have no reason to reject the absentee vote totals. To the contrary, I assume, with no contradictory evidence proving otherwise, that everyone that filled out an absentee ballot in 2020 were eligible voters who expressed their true vote preferences on those ballots. Furthermore, I also assume the election officials in all 50 states (plus the District of Columbia) employed state-of-the-art methods to ensure that every absentee voter was eligible and did not vote more than once.

At this juncture, I suspect readers are dividing into one of two groups: One group thinking, ‘Yeah, I believe the state’s have the capacity to ensure the validity of absentee ballots.’ And the other thinking, ‘There is no frickin’ way state election officials knew for certain that every absentee ballot was legitimate.’

Cautiously, I stand with the former group — state’s do, in fact, have validated database methods to ensure the legitimacy of absentee ballots. Was their due-diligence perfect in 2020? Probably not. But idiosyncratic failures in confirming absentee voting do not constitute a conspiracy to steal the 2020 election.

However, I understand why Trump voters feel absentee voting in 2020 distorted the final results.

It doesn’t take a conspiracy theorist to question the 2020 election results, it just takes strong partisanship and dose of human nature.

Vote Integrity, an analytic project headed by Matt Braynard, Trump’s former Campaign Director of Data and Strategy (so take its findings with the necessary caution), conducted an analysis of state-level 2020 presidential votes by the time of each vote update. Their analysis rendered the following conclusion:

This report studies 8,954 individual updates to the vote totals in all 50 states and finds that four individual updates — two of which were widely noticed on the internet, including by the President — are profoundly anomalous; they deviate from a pattern which is otherwise found in the vast majority of the remaining 8,950 vote updates. The findings presented by this report suggest that four vote count updates — which collectively were decisive in Michigan, Wisconsin, and Georgia, and thus decisive of a critical forty-two electoral votes — are especially anomalous and merit further investigation.

We further find that if these updates were only more extreme than 99 percent of all updates nationally in terms of their deviation from this generally-observed pattern, that, holding all else equal, Joe Biden may very well have lost the states of Michigan, Wisconsin, and Georgia, and that he would have 42 fewer Electoral votes — putting Biden below the number required to win the Presidency. Either way, it is indisputable that his margin of victory in these three states relies on four most anomalous vote updates identified by the metric developed in this report.

Contrary to Vote Integrity’s conclusions, it is not a mystery why Michigan, Wisconsin and Georgia had anomalous vote updates in 2020 — those were states identified as “battleground” states by both parties and where the Democrats employed the most aggressive absentee and vote harvesting methods, and where the Republicans put up aggressive resistance to those voting methods. (Note: Vote harvesting is where third-parties are allowed to handle completed ballots before they are delivered to election authorities)

Vote Integrity did not discover evidence of voter fraud — they discovered evidence that the Democrats were better prepared for the pandemic-driven changes in how people voted in 2020.

The 2020 presidential vote results in Michigan, Wisconsin, and Georgia represent the fact the Democrats possessed a far more sophisticated approach to absentee voting than the Republicans.

But in the midst of the Democrats’ superior vote collecting methods, could there still have been some nefarious activities that distorted the 2020 outcome?

One statistical test that might reveal that type of fraud is Benford’s law. The test’s rational is that in any large, randomly produced set of natural numbers, which some argue U.S. national and state elections follow, will find around 30 percent of those numbers will begin with the digit 1, 18 percent with 2, and so on, with the smallest percentage beginning with 9. A similar distribution exists for second digits.

Benford’s law analysis of the 2020 presidential election found possible evidence of vote fraud in the county-level Pennsylvania vote. Wrote the study’s authors, Brooks Groharing and Dr. David McCune, “The argument that the failure of Biden’s county-level votes in Pennsylvania to follow Benford’s law is an indication of voter fraud is interesting and cannot be dismissed entirely.”

Yet, the authors concluded based on comparisons with previous presidential election data, “The (vote fraud) argument fails.”

Fair enough. Benford’s law is not the last word on vote fraud. But are U.S. elections immune from electoral chicanery?

Of course not.

Was it vote fraud or were the Democrats better positioned demographically in 2020?

I’m comfortable saying there was no concrete evidence of systematic vote fraud in the 2020 election — but I’m equally comfortable saying the rise of absentee voting, particularly allowing partisan third-parties to handle completed ballots, is a recipe for a future election disaster.

The statistical and forensic tools available to identify the some ways in which an absentee ballot can be corrupted (e.g., voter intimidation, ballots completed by someone other than the voter) are limited.

At a minimum, the rise of absentee voting has increased the number of election races where the results are not just untimely (i.e., outcome not known for days, or weeks, after Election Day), but has increased instances where vote totals have changed dramatically well after the close of

This type of election volatility breeds distrust in the election system and promotes concerns about vote fraud — and that is a problem that cannot be coldly brushed off as a ‘conspiracy theory.’ It is human nature and we cannot build and promote an electoral system that ignores our inherent frailties.

The popular assumption is that Republicans want to limit the electoral franchise through vote eligibility and mode restrictions — which disproportionately disadvantages non-white voters — while the Democrats aim to expand the franchise in opposition to such restrictions, thereby maximizing non-white vote turnout.

That assumption is mostly true, but it presupposes the false belief that the Democrats have an impenetrable advantage over Republicans in attracting non-white voters.

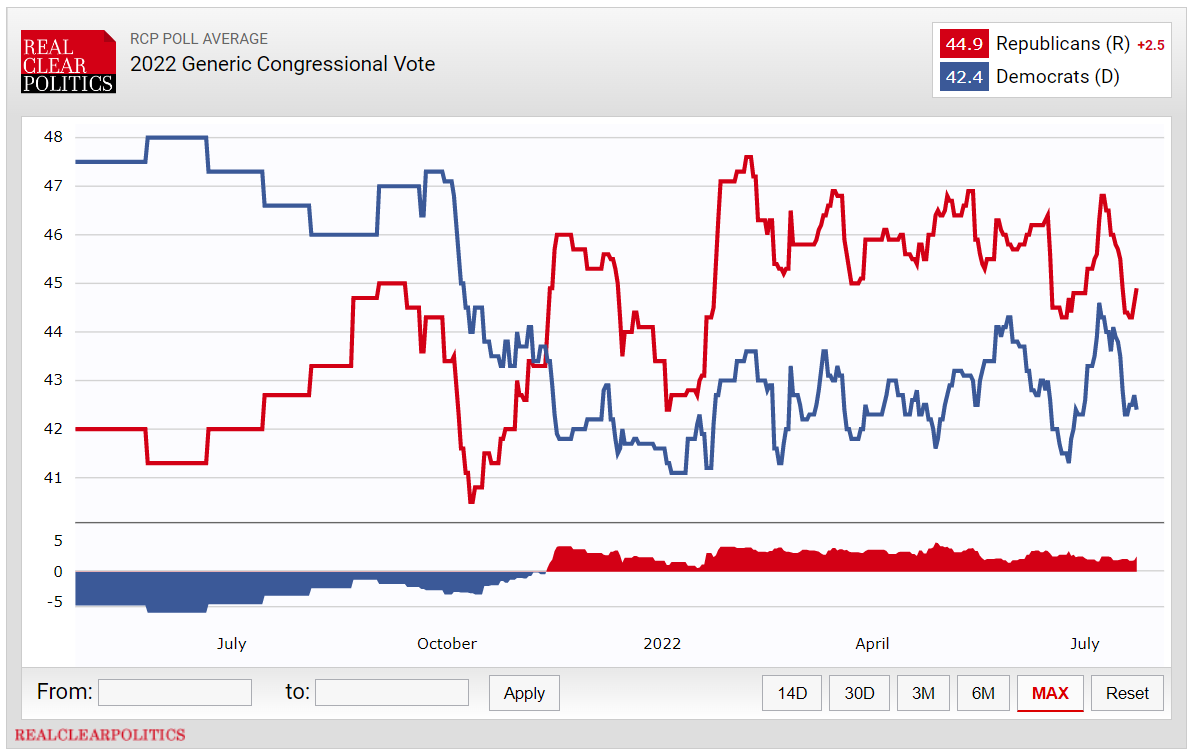
The opinion survey evidence suggests the Republicans remain competitive with the Democrats for congressional votes, despite the Supreme Court’s June 24th decision to overturn Roe v. Wade (see Figure 3).

Figure 3: Generic congressional vote for 2022 (RealClearPolitics)

Source: RealClearPolitics (as of 24 July 2022)

The news is also hopeful for the Republicans in attracting Hispanic voters — the country’s fastest growing voter bloc.

A small-sample New York Times-Siena College poll in July 2022 found that the vote intentions of Hispanics was equally divided between the two major parties (41% preferring Democrats versus 38% preferring Republicans).

Even with the fact that polling Hispanic voters remains a difficult task for U.S. pollsters, any assumption that non-voting Hispanics are guaranteed Democrat voters is dubious.

Biden won the 2020 presidential election, in part, because his party executed the most sophisticated vote harvesting methods in U.S. election history.

If the Republicans were to match the Democrats’ vote harvesting prowess in the future, it is reasonable to assume they would be more than competitive electorally going forward.

According to demographic data and exit polls, 45 million white Americans did not vote in 2020, compared to 16 million Hispanics, 11 million Blacks, 5 million Asians, and 4 million “other” races and ethnicities.

Assuming the Republicans can dominate vote preferences among white low-likelihood-voters similar to 2020 (56% vs. 34%) and are competitive among low-likelihood voters who are Hispanic, Asian or “Other,” they are certainly viable in future presidential elections. And if the GOP were to ever reach anything near 15 percent of the Black vote, future presidential elections likely will be dead-heats in the popular vote (My statistical analysis leading to this conclusion is available on GitHub).

My point is that the Democrats’ advantage in vote harvesting could be negated if the Republicans had any initiative to match the Democrats at that vote collection method. The 2020 gap in absentee ballot voting was substantially in Biden’s favor (65% for Biden versus 33% for Trump), with 46 percent of the vote being cast that way. For the GOP to win another presidential election, that gap must close.

Nonetheless, I am not advocating for the expanded use of vote harvesting and absentee voting, in general. To the contrary, it fundamentally violates the requirements of a strong electoral system (see Appendix for the attributes of a good electoral system) and increases the potential for systematic voter fraud — even if such fraud did not occur as some have claimed in the 2020 presidential election.

My stack of multiple absentee ballots mailed to me for the 2020 election stands as testament to one of that voting method’s most dangerous flaws.

  • K.R.K.

Send comments to kroeger98@yahoo.com

Appendix: An Inventory of Election System Attributes

Building upon the conclusions of the Commission on Federal Election Reform (CFER), and incorporating research from scholars such John M. CareyGary CoxHarry Eckstein, and Arend Lijphart, I created an inventory of key attributes that can be used to judge the health and effectiveness of a country’s electoral system.

The five attributes of an electoral system, including a letter grade (A to F) I collectively gave U.S. and state election laws on each attribute, are:

  1. Inclusiveness of franchise — Are there groups legally or effectively excluded from the vote franchise (e.g., felons)? Does partisan gerrymandering systematically diminish the importance/impact of some voters? (A-)
  2. Voting barriers—How easy is it to register to vote? Are there early voting and absentee voting options? (B+)
  3. Vote integrity — Are election results timely or prone to long delays? What rules govern an individual ballot’s chain of custody? Are vote tabulations independent of political bias? Are reliable processes in place to identify ineligible voters or tampered ballots? (C+)
  4. Relevant electoral choices — Do parties respond to voter preferences in the candidate selection process (e.g., primaries)? (Democrats = D- GOP = B+)
  5. Policy responsiveness — Do elections matter in terms of the public policies implemented? (F)

Overall, I’d give the U.S. a gentleman’s C for the inclusiveness, integrity and effectiveness of its electoral system.

Hey, at least we beat Russia on this scale (who I give a solid F).

Traditional news still towers over us like a colossus, but here comes Rogan

By Kent R. Kroeger (Source: NuQum.com; July 17, 2022)

The following essay uses only open source data and is available — along with computer scripts used for data transformations and index constructions — on Github (here). As always, all errors remain mine.

“Americans’ confidence in newspapers and television news has plummeted to an all-time low, according to the latest annual Gallup survey of trust in U.S. institutions.”

This was the lead in a recent Axios article announcing Gallup’s results on Americans’ confidence in its institutions.

Americans do not trust their primary news sources. And why should they? Our main sources of news routinely (deliberately?) misrepresent reality. The mainstream media (MSM) is the “principle disseminator of fake news,” according to Tsfati et al. (2020), who conclude that “most people hear about fake news stories not from fake news websites but through their coverage in mainstream news outlets.”

According Gallup’s latest numbers, 16 percent of Americans have confidence in newspapers and only 11 percent have confidence in television news (see Figure 1).

Most Americans have little confidence in the news they receive from their primary news sources, and this confidence has been falling consistently since at least the early 1990s.

Figure 1: Confidence in newspapers and television news over time (Source: Gallup Poll)

Data source: Gallup Poll; Graphic by Nicki Camberg (Axios)

Why the declining confidence in the news media?

Some proposed causes of declining confidence in the news media include (but are not limited to):

  • a general decline in the public’s confidence with all social institutions,
  • the rise of alternative news sources which often justify their existence by expressing harsh critique’s of the MSM,
  • a growing elitism within the ranks of MSM journalists and editors,
  • an increasing disconnect between “reality” and what is reported in the news,
  • the rise of partisan news organizations (e.g., Fox News), and
  • the wider spread and amplification of “fake” news (see Tsfati et al. [2020]) which research suggests Americans over-estimate their ability to spot.

The explanation of declining news media confidence may be found in all of these factors, but something else may also be at play. There has been a perceptible decline in accountability within the MSM when it gets a story wrong (e.g., Richard Jewell and the Centennial Olympic Park bombing in 1996, Iraq and WMDsRussiagateRussians alleged hack of U.S. electricity grid, to name a few).

The New York Times fired Judith Miller, one of their star journalists, because of her inaccurate reporting on alleged weapons of mass destruction leading up to the Iraq War. And she didn’t deliberately falsify information — she simply relied on biased or bad sources.

She was fired and forever banned from employment in the “respected” news media.

Fast forward to today, and not a single New York Times or Washington Post journalist was dismissed or reprimanded for spreading what turned out to be false information about Donald Trump and alleged collusion with Russia prior to the 2016 election. A sitting president was basically smeared for four years and not one journalist or organization was held accountable for the poor and often false reporting that occurred during Trump’s term in office.

We are all adults here. We know why this happened. The political and economic establishment wanted Trump out of office any way possible.

Comedian and popular podcaster Jimmy Dore loves to tell his audience that the MSM’s central function is to spread propaganda for the political and economic elites. “When you lie at the behest of the establishment, there is never a price to pay…ever,” Dore said during an interview in 2019 with Matt Taibbi and Katie Halper. “The people who consider themselves journalists have no idea how they’ve been groomed for that job. They’re chosen and guys like me are not chosen to work for (mainstream news organizations), and if they do, they fire my ass.”

Dore’s observation is hardly novel. Academics and media critics have been making this argument for years, most famously by Edward S. Herman and Noam Chomsky in their seminal book Manufacturing Consent:

“The mass media serve as a system for communicating messages and symbols to the general populace. It is their function to amuse, entertain, and inform, and to inculcate individuals with the values, beliefs, and codes of behavior that will integrate them into the institutional structures of the larger society. In a world of concentrated wealth and major conflicts of class interest, to fulfil this role requires systematic propaganda.” (Manufacturing Consent, 1988)

The Fox News effect is also frequently mentioned when discussions of declining news media confidence arise. [Such arguments are found here and here.] According to this argument, Fox News is that one bad apple that spoiled the whole bunch. “Things were fine before Fox News” is a common syllogism within this line of reasoning.

Unfortunately, it is not that simple.

The decline is, in fact, common across partisan preferencesWhile Democrats have more confidence in the news media than Republicans, their confidence has also declined for both TV news and newspapers in the past year (see Figure 2).

Figure 2: Changes in confidence in institutions between 2021 and 2022 (Source: Gallup Poll)

Source: Gallup Poll

Rumors of the MSMs demise are greatly exaggerated

But for all the pissing I’ve done on the MSM in my past blogs, and repeatedly imploring Americans (and all world citizens, for that matter) to diversify their news and information sources, I should acknowledge that the MSM is far from dying or obsolete. Not only is the MSM very much alive, it still dominates our daily news ecosystem — even in the Age of Joe Rogan.

The New York Times has seen its subscriptions, revenues and profitability consistently rise since 2016 (did the ‘Orange Man’ help?), and while the viewership for cable TV news networks has dropped from Trump-administration-era highs, these news outlets are not on the brink of financial collapse.

Granted, CNN, MSNBC and Fox News are no longer just competing among themselves for America’s news-watching eyeballs — they must now contend with those eyeballs fleeing to the digital world to watch personalities like Joe Rogan, Ben Shapiro, Lex Fridman and Jimmy Dore, or to watch news podcasts from The Hill and Breaking Points.

Based on my previous research, Google Trends may be useful in measuring the public’s attention to various news outlets, particularly given the many points-of-access now available to news consumers — such as TV, newspapers, radio news websites, YouTube, and podcast streaming services. The broadcast and streaming media ratings measurement services have a titanic challenge in capturing the degree to which Americans interact with their favorite news and information sources.

In previous posts, I’ve used Google Trends to assess levels of interest across selected media properties and found, generally, that Google search behavior mirrors and often predicts levels and changes in audience sizes for these media properties (see the Appendix below for a back-of-the-envelope comparison of Google Trends and streaming viewership for Netflix’s Stranger Things and Disney’s Obi Wan Kenobi).

Thus, I believe Google Trends may be appropriate for assessing the public’s interest in major news organizations and personalities.

The news and information landscape is more fragmented than ever in terms of available options, but in terms of the public’s attraction (as measured by Google searches), the traditional media outlets still rule (see Figure 3).

Figure 3: Changes in confidence in institutions between 2021 and 2022 (Source: Gallup Poll)

According to the sum of the weekly Google Trends Index (GTI) from January 2020 to June 2022, Fox News (GTI = 2,855), CNN (GTI = 2,288), and the New York Times (GTI = 914) dominated Google searches over that period.

Seven of the top 10 news and information entities were traditional media outlets, with only Joe Rogan (GTI = 170), the Huffington Post (GTI = 156), and BuzzFeed (GTI = 138) representing new media among the top news and information sources.

In comparison, between January 2016 and June 2018, the Huffington Post and BuzzFeed were the only two new media entities in the top 10 on Google Trends (data not shown, but available upon request).

Ostensibly, the big mover in public’s attraction has been Joe Rogen (The Joe Rogan Experience) — arguably the most important and influential podcaster in the country today — but beyond the dominant news outlets (i.e., Fox News, CNN, the New York Times, the Washington Post, and MSNBC), ten of the next 21 top news and information outlets are new media properties (Rogan, HuffPost, BuzzFeed, Politico, Ben Shapiro, Candace Owens, The Hill, The Daily Wire, Call Her Daddy, and Alex Jones).

Yes, Alex Cooper’s Call Her Daddy probably can’t be categorized as a news or information program, but it is often political in content and it ranks highly compared to other news and entertainment properties.

If we factored in the operational costs associated with each of the entities in Figure 3, Rogan, Shapiro, Owens, Dan Bongino, Call Her Daddy and Jones would undoubtedly be the most economically efficient attractors of the public’s interest in today’s news and information landscape. It is not hyperbole to suggest new investments in news and information would be most profitable in the podcast, not traditional media, arena.

Final Thoughts

I believe Joe Rogan has maxed his audience and influence. Just a hunch. But that is not the same as saying his media model isn’t relevant for the future.

Low-cost, opinion-oriented podcasts are not going away. To the contrary, their central role going forward is to interpret the biased news we receive from the mainstream media. We shouldn’t need these podcast interpreters of the news, but we do.

For good reason, Americans do not trust the mainstream media — you decide the fundamental reason for that empirical fact.

In the meantime, understand that the quest for media ratings and success in electoral politics is little more than a popularity contest, not that dissimilar from the interpersonal forces that determined popular kids from unpopular ones in high school. Our electoral process is that shallow.

The objective facts in politics are subordinate (but never irrelevant) to the narrative that supports the interests of established elites, who will do everything in their power to kill anti-establishment points-of-view circulated on such on podcasts like The Joe Rogan Experience and Breaking Points.

Will the establishment win or fail in their anti-free-speech project? The answer is up to us.

  • K.R.K.

Send your comments to kroeger98@yahoo.com

Appendix: Strangers Things vs. Obi Wan Kenobi

I am both a fan of Netflix’s Stranger Things and George Lucas’ Star Wars. So when Disney’s Obi Wan Kenobi series and Netflix’s Stranger Things released new episodes at the same point in time, not only did I have watch both, but I was intrigued as to how each performed in terms of audience interest.

I was also interested to see if interest in the two shows on Google Trends corresponded to reported audience measurements (i.e., Nielsen streaming ratings).

The correspondence was positive and striking (see Figure A.1).

Figure A.1: Audience levels and Google searches for Stranger Things and Obi Wan Kenobi between May 15 and June 15, 2022 (Source: Nielsen and Google Trends)

The ratio of audience viewing levels and the relative number of Google searches was nearly identical for both Stranger Things and Obi Wan Kenobi (3.24 vs. 3.22).

The U.S. healthcare system cost many lives during the COVID-19 pandemic

By Kent R. Kroeger (Source: NuQum.com; July 6, 2022)

Cross-national data analyzed in this essay can be found on Github==>Here

“Pandemic or not, America has the best healthcare in the world,” declared a 2020 cross-national study of COVID-19 survival rates by the Acton Institute, a free-market-promoting think tank. “When President Donald Trump fell ill with COVID-19, there was absolutely no contemplation of moving America’s head of state to another country to receive healthcare services.”

Unintentionally, the Acton Institute’s study highlights exactly why the U.S. healthcare system is not the world’s best by most objective measures. The healthcare received by our president is not the same healthcare received by a large percentage of Americans.

And no issue has been a bigger motivator for this blog than the systemic underperformance of the U.S. healthcare system.

Although my family has adequate insurance coverage, unpredictable healthcare costs could compromise our financial well-being in a jiffy moment.

The COVID-19 pandemic brought that possibility to the fore when my entire family came down with the novel coronavirus within days of one another, and while none of us suffered too greatly from its effects, the night I had a 103-degree fever and prayed for a quick and merciful death suggests it could have turned out differently had I not been vaccinated and in reasonably good health.

Still, it would have taken just one extended hospital stay among us to have fundamentally changed our financial well-being.

On average, a one-night hospital stay in the U.S. costs $11,700. For most Americans, health insurance covers most of that cost, but what about for the 31 million uninsured or 75 million underinsured? The answer is often tragic.

According to Debt.org, between 60 and 65 percent of all bankruptcies are due to medical expenses, and a 2018 study by The Commonwealth Fund found that 41 percent of underinsured adults had postponed important health care due to cost. Even among adequately insured Americans, 23 percent reported delaying needed care.

Early within the COIVD-19 pandemic, the U.S. Centers for Disease Control and Prevention (CDC) warned that delaying care could increase the country’s morbidity and mortality rates associated with COVID-19. In a survey conducted by the CDC in June 2020 discovered that “an estimated 40.9 percent of U.S. adults have avoided medical care during the pandemic because of concerns about COVID-19, including 12.0 percent who avoided urgent or emergency care and 31.5 percent who avoided routine care.”

A policy analysis by Yale’s Center for Infectious Disease Modeling and Analysis appears to confirm the CDC’s concern about delayed care. “Universal healthcare could have alleviated the mortality caused by a confluence of negative COVID-related factors,” concluded the June 2022 study published in Proceedings of the National Academy of Sciences USA. “Incorporating the demography of the uninsured with age-specific COVID-19 and nonpandemic mortality, we estimated that a single-payer universal healthcare system would have saved 212,000 lives in 2020 alone. We also calculated that US$105.6 billion of medical expenses associated with COVID-19 hospitalization could have been averted by a Medicare-for-All system.”

The same study concluded 330,000 American lives could have been saved over from 2020 to 2021 had this country had a universal healthcare system.

But as I would tell students, rarely can one study end the discussion on an important policy-related question, and has solid as the policy analysis methodology was for the Yale study, a cross-national comparison of COVID-19 death rates is warranted.

A Comparison of National Healthcare Systems (Type vs. Quality)

Perhaps it is analytic hubris to believe it is possible to categorize national healthcare systems into a small number of mutually-exclusive categories, but contributors to Wikipedia gives it a decent shot:

  • Universal government-funded health system (e.g., Australia, Brazil, Canada, Denmark, Norway, Sweden, Taiwan, and U.K.)
  • Universal public insurance system (e.g., Belgium, China, France, India, Japan, Russia, and South Korea)
  • Universal public-private insurance system (e.g., Austria, Germany, Mexico and Turkey)
  • Universal private health insurance system (e.g., Israel, Netherlands, and Switzerland)
  • Non-universal insurance system (e.g., Indonesia, Nigeria, Pakistan, Uganda, and U.S.)

However, on its face, this categorization appears problematic for analytic purposes as it is hard to agree that Pakistan and the U.S. have similar healthcare systems, despite both being categorized has having non-universal insurance systems, or that South Korea and China have objectively similar universal public insurance systems.

Consequently, during the model-building process to explain cross-national differences in COVID-19 death rates, the type of healthcare system did not achieve consistent statistical significance after controlling for other national factors such a population size, age distribution, vaccination rates, and GDP per capita. [See the full linear model estimates for the model including controls for healthcare system types in Appendix A.]

In contrast, the quality of a nation’s healthcare system, as measured in a 2021 global survey of 196,000 respondents conducted by the Global Business Policy Institute (GBPI) in partnership with CEOWORLD magazine, proved consistently significant in explaining variation in COVID-19 death rates.

Figures 1a-b display the Top and Bottom 10 healthcare systems in 2021, according to GBPI and CEOWorld Magazine. Topping the list are South Korea, Taiwan, Denmark, Austria and Japan. Of the Top 10 healthcare systems, three of five system types were represented (Universal government-funded health system, Universal public insurance system, Universal public-private insurance system). Conversely, two of the Bottom 10 countries had universal government-funded healthcare (Ireland and Ukraine), while the remaining countries in the Bottom 10 had non-universal healthcare or could not be classified.

Figure 1a: Top 10 healthcare systems in the world (Source: CEOWorld Magazine)

Figure 1b: Bottom10 healthcare systems in the world (Source: CEOWorld Magazine)

Likewise, Figure 2 (below) plots the quality of a nation’s healthcare system by COVID-19 deaths per 1 million people. Ostensibly, there does not appear to be a strong linear relationship between those two variables.

Figure 2: A cross-national comparison of healthcare system quality and COVID-19 deaths per capita.

However, in a linear model controlling for COVID-19 incidence (i.e., confirmed cases per capita), population size, age distribution, GDP per capita, vaccination rate, and the stringency of COVID-19 policies, the quality of a nation’s healthcare system proved significant across all of the models tested. The parameter estimates (and diagnostics) for the final, reduced model are shown in Figure 3.

Figure 3: A linear model explaining COVID-19 deaths per capita in 85 countries.

Modeling and analytics by Kent R. Kroeger (The 85 countries in the analysis are listed in the datafile on Github)

Methodological Note:

One of my subscribers asked how the results in Figure 3 would change if China and Venezuela were removed from the analysis, as many analysts have contended that both countries have not been forthright in their COVID-19 reporting.

Their removal did not change the substantive findings in Figure 3, and though I don’t report the results excluding China and Venezuela here, I can provide them upon request. And, as always, the raw data is available on Github for others to analyze.

Based on their standardized parameter estimates, the number of confirmed cases per capita (β = 1.03),a country’s population size (β = 0.24) and the quality of its healthcare system (β = -0.24) were the best predictors of COVID-19 deaths per capita.

The higher a country’s population, the higher the number of COVID-19 deaths per capita.

The better the quality of country’s healthcare system, the lower the number of COVID-19 deaths per capita.

Other significant predictors of COVID deaths per capita were vaccination rates, the percentage of citizens over 70, and the average stringency of COVID-19 policies (from 1 January 2020 to 23 June 2022).

Overall, the reduced linear model in Figure 3 explains 73 percent of the variance in COVID-19 death rates. [The reduced model’s residuals are plotted in Appendix B.]

Some will be perplexed that the regression parameter for policy stringency is positive — which implies that the stricter the COVID-19 policies, the higher the COVID-19 death rate per capita.

In a static, cross-sectional analysis this analytic outcome makes empirical sense. It is not surprising that countries facing the worst COVID-19 outcomes would impose the strictest policy measures. This finding, however, does not in any way suggest that COVID-19 mitigation policies didn’t work. In fact, my own time-series analysis in this area says otherwise: Proactive COVID-19 policies worked better than reactive policies.

In any case, simple assumptions about the effectiveness of mask mandates, vaccine dictates, business shutdowns, school closings and social distance requirements should always be subject to empirical analysis.

But the purpose of this data essay is not to argue the effectiveness of COVID-19 policies — it is to argue whether human lives could have been saved in the U.S. had the country a better healthcare system.

Using the parameters in Figure 3, we can estimate how many U.S. lives would have been saved had the country’s healthcare system been of a higher quality. The results support the conclusions of the Yale study. If the U.S. had a more equitable healthcare system, hundreds of thousands of lives would have been saved.

Figure 4 presents an estimate of the number of U.S. COVID-19 deaths that could have been avoided had the U.S. a healthcare system comparable in quality to other countries.

Figure 4: How many lives would have been saved if the U.S. had a better healthcare system?

Modeling and analytics by Kent R. Kroeger

If the U.S. had a healthcare system comparable to our neighbor to the north (Canada), we would have saved almost 100,000 COVID-19 deaths.

A U.S. healthcare system similar to Germany’s hybrid system would have saved a 175 thousand lives. And a U.S. healthcare system at the U.K.’s level of quality would have saved 258 thousand lives.

And if the U.S. had the best healthcare system in the world, as asserted by the Acton Institute, there would be 356 thousand more Americans alive today.

Some last thoughts

The findings from this data essay argue that the U.S. healthcare system is not only inadequate, it has systematically failed at its number one job of taking care of all Americans.

It is not acceptable that American doctors and pharmaceutical executives are millionaires while a million Americans die from a virus that other countries — with superior healthcare systems — were able to contain at a fraction of the human carnage experienced within the U.S.

Dr. Abdul El-Sayed, a physician and progressive candidate in Michigan’s 2018 Democratic gubernatorial primary election, describes the five reasons Medicare-for-All (universal healthcare) is superior to private healthcare:

  1. Despite political rhetoric suggesting otherwise, there are no free markets in private healthcare
  2. There is no financial incentive for prevention in private healthcare
  3. American healthcare is expensive because insurers and hospitals negotiate (collude) with each other
  4. Sixty-five percent of our healthcare system is already public (Medicare/Medicaid, TRICARE, Veterans)
  5. Money spent inefficiently on healthcare is money not spent on other important problems (e.g., climate change)

Historical trends in U.S. healthcare expenditures reinforces Dr. El-Sayed’s fifth point. In 2020, health spending accounted for one-fifth (19.7%) of the total U.S. economy (see Figure 5). Fifty years ago, it was a mere 6.9 percent of the economy.

Figure 5: Annual U.S. health expenditures (US $ per capita, 1970–2020)

Source: Peterson-KFF

While exacerbated by the COVID-19 pandemic, the upward trend in U.S. healthcare spending established itself long before 2020. In a country where treatment of a snake bite can cost over $140,000 (if helicopter transport is required), the rise in healthcare costs is not an economic abstraction. It is real. And we will never contain these cost increases until we abandon half-measure reforms (think: Obamacare) and, instead, pursue fundamental, structural reform.

And, according to Yale’s Center for Infectious Disease Modeling and Analysis, the most logical and attainable policy choice is universal public healthcare under a Medicare-for-All system.

Will it happen? I doubt, as we have two Right-leaning parties dominating our political system right now.

  • K.R.K.

Send comments to kroeger98@yahoo.com

Appendix A: Full linear model with GDP per capita, Central/South America, and healthcare system type controls (Dependent Variable: COVID-19 deaths per capita)

Appendix B: Linear model residuals (Dependent Variable: COVID-19 deaths per capita)