[Headline graphic: Billy Beane (left) and Paul DePodesta (right). The General Manager and assistant General Manager, respectively, for the 2002 Oakland A’s and who inspired Michael Lewis’ book, “Moneyball.” (Photo by GabboT; used under the CCA-Share Alike 2.0 Generic license.)]
By Kent R. Kroeger (Source: NuQum.com; November 25, 2020)
As he announced his resignation from the Chicago Cubs as that organization’s president of baseball operations in November, Theo Epstein, considered by many the High Priest of modern baseball analytics, made this shocking admission about the current state of baseball:
“It is the greatest game in the world but there are some threats to it because of the way the game is evolving. And I take some responsibility for that because the executives like me who have spent a lot of time using analytics and other measures to try to optimize individual and team performance have unwittingly had a negative impact on the aesthetic value of the game and the entertainment value of the game. I mean, clearly, you know the strikeout rates are a bit out of control and we need to find a way to get more action in the game, get the ball in play more often, allow players to show their athleticism some more and give the fans more of what they want.”
Epstein’s comments were painful for me on two fronts. First, he was leaving the only baseball team I’ve ever loved, having helped the Cubs win the only World Series championship of my lifetime. Second, he put a dagger in the heart of every Bill James and sabermetrics devotee who, like myself, have spent countless hours pouring through the statistical abstracts for Major League Baseball (MLB) and the National Football League on a quest to build the perfect Rotisserie league baseball team and fantasy football roster.
There is no better feeling than the long search and discovery for those two or three “value” players who nobody else thinks about and who can turn your Rotisserie or fantasy team into league champs.
In a direct way, sports analytics are the intellectual steroids for a generation of sports fans (slash) data geeks who love games they never played beyond high school, if even then.
Epstein’s departure was not entirely a surprise. The Cubs have not come close to their glorious World Series triumph in 2016—though it has to pin that on Epstein. The Cubs still have (when healthy) one of the most talented rosters in baseball. Instead, the surprise was Epstein’s targeting ‘analytics’ has one of the causes of baseball’s arguable decline.
Like many baseball fans, I’ve assumed baseball analytics—immortalized in Michael Lewis’ book “Moneyball” about the 2002 Oakland A’s and its general manager Billy Beane, who hired a Yale economics grad, Paul DePodesta, to assist him in building a successful small market (i.e., low payroll) baseball team—helped make the MLB, from top-to-bottom, more competitive.
In the movie based on Lewis’ book, starring Brad Pitt and Jonah Hill, this scene perfectly summarizes the value of analytics in baseball (and, frankly, could apply to almost every major industry):
Peter Brand (aka. Paul DePodesta, as played by Jonah Hill):
“There is an epidemic failure within the game to understand what is really happening and this leads people who run major league baseball teams to misjudge their players and mismanage their teams…
…People who run ball clubs think in terms of buying players. Your goal shouldn’t be to buy players. Your goal should be to buy wins, and in order to buy wins you need to buy runs.
The Boston Red Sox see Johnny Damon and they see a star who’s worth seven-and-a-half million dollars. When I see Johnny Damon what I see is an imperfect understanding of where runs come from. The guy’s got a great glove and he’s a decent lead-off hitter. He can steal bases. But is he worth seven-and-a-half million a year?
Baseball thinking is medieval. They are asking all the wrong questions.”
While Beane and DePodesta may have lacked world championships after they introduced analytics into the process, the A’s did have nine winning seasons from 2002 to 2016 during their tenure, which is phenomenal for a small-market, low-payroll team.
At the team-level, the 21st-century A’s are the embodiment of how analytics can help an organization.
But is Epstein still right? Has analytics hurt baseball at the aggregate level?
Let us look at the facts…
Major League Baseball has a Problem
Regardless of the veracity of Epstein’s indictment of analytics for its net role in hurting the game of baseball, does professional baseball have a problem?
The answer is a qualified ‘Yes.’
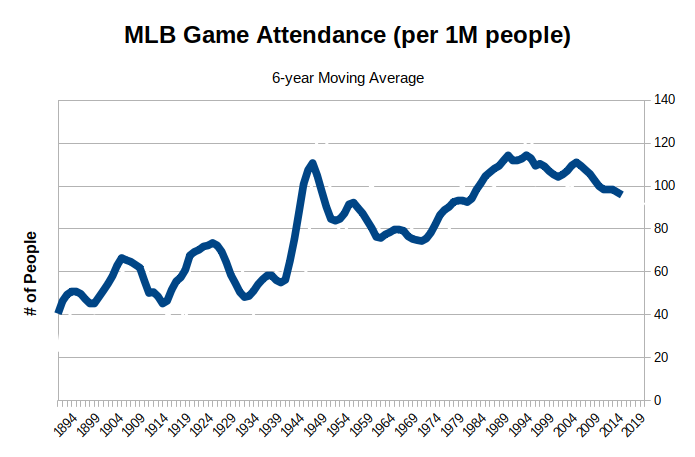
These two metrics describe the bulk of the problem: (1) Average per game attendance and (2) World Series TV viewership. Since the mid-1990s, baseball game attendance relative to the total U.S. population has been in a near constant decline, going from a high of 118 game attendees (per 1 million people) in the mid-1990s to 98 game attendees (per 1M) in the late 2010s (see Figure 1). At the same time, the long-term trend is still positive. That cannot be discounted.
Figure 1: MLB per game attendance (per 1 million people) (Source: baseball-reference.com)
While the relative decline is significant, the real story of MLB attendance since the league’s inception in the late-19th century is the surge in attendance after World War II, a strong decline after that until the late-1960s, and a resurgence during the 1970s and 80s. In comparison, the attendance decline per capita since the mid-1990s has been relatively small.
Consider also that despite a per capita decline in game attendance since the 1990s, total season attendance has still grown. In 1991, 56.8 million MLB tickets were sold; by 2017, 72.7 million tickets were sold. This increase in gross ticket sales has been matched by a steady rise in MLB ticket prices as well. The average cost of an MLB baseball game in 1991 was $142, but by 2017 that figure increased to $219 (a 176 percent increase). In that context, the 15 to 20 percent decline in game attendance (per capita) seems more tolerable and far from catastrophic. In fact, if it weren’t for this next metric, baseball might be in great shape, even if its relative popularity is in decline.
The TV ratings and viewership for MLB’s crown jewel event, the World Series, has been in a near straight-line decline since the mid-1970s when Billy Martin’s New York Yankees and the Tommy Lasorda-led Los Angeles Dodgers were the sport’s dominant franchises, and happened to be in this nation’s two largest cities. Big market teams in the World Series is always good for TV ratings.
As seen in Figure 2, average TV viewership for the World Series (the orange line) has declined from a high of 44.3 million in 1978 (Yankees vs. Dodgers) to just under 9.8 million in the last World Series (Dodgers vs. Rays).
Figure 2: The TV Ratings and Viewership (average per game) for the World Series since 1972 (Source: Nielsen Research)
Even with the addition of mobile and online streaming viewers—-which lifts the 2020 World Series viewership number to 13.2 million—the decline in the number of eyeballs watching the World Series since the 1970s has been dramatic.
In combination with the trends in game attendance, the precipitous decline in live viewership offers one clear conclusion: Relatively fewer people are going to baseball games or watching the them on TV or the internet. That’s a formula for an impending financial disaster among major league baseball franchises.
While stories of baseball’s imminent death are exaggerated, baseball does have serious problems. But what are they exactly? And how has analytics impacted those probable causes?
Are baseball’s problems bigger than the game itself?
Before looking within the game of baseball itself (and the role of analytics) to explain its relative popularity decline, we must consider the broader context.
Sports fans today demand something different from what MLB offers
Living with a teenage son who loves the NBA and routinely mocks my love of baseball, I see a generational divide that will challenge any attempt to update a sport once considered, without debate, to be America’s pastime. Kids (and. frankly, many of their parents) don’t have the patience or temperament to appreciate the deep-rooted intricacies of a game where players spend more time waiting than actually playing. Only 10 percent of a baseball game involves actual action, according to one study. For kids raised on Red Bull and Call of Duty, baseball is more like a horse and buggy than a Bugatti race car.
And the in-game data supports that assertion. In 1970. a nine-inning major league baseball game took, on average, two-and-a-half hours to complete. In 2020, it takes three hours and six minutes. By comparison, a World Cup soccer match takes one hour and 50 minutes from the moment the first whistle blows. An NBA game takes about two-and-a-half hours.
Baseball is too slow…and getting slower.
[For a well-constructed counterargument to the ‘too slow’ conclusion, I invite you to read this essay.]
In contrast, the NBA and World Cup soccer possess near constant action. Throw in e-games (if you consider those contests a sport) and it is reasonable to conjecture that baseball is simply a bad fit for the times. Even NFL football, whose average game takes over three hours, has challenges in that regard.
Did analytics lead to longer baseball games? Let us examine the evidence.
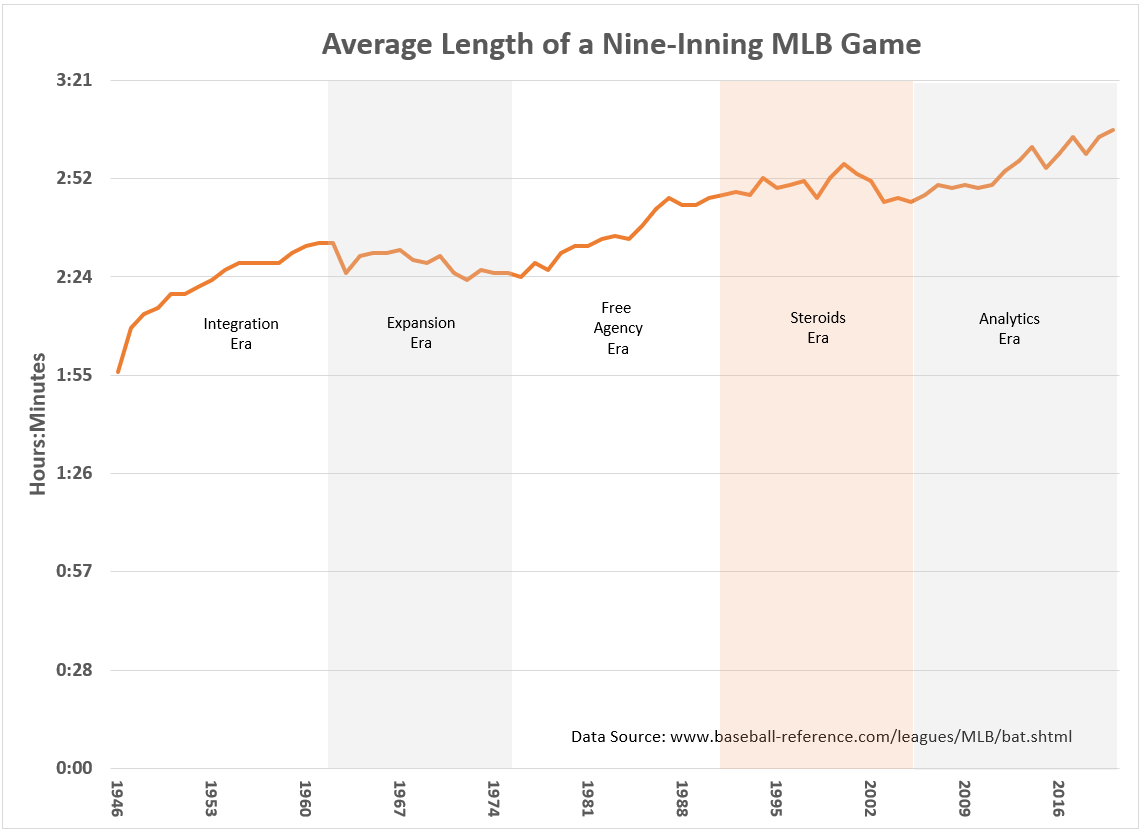
Figure 3 shows the long-term trend in the length of 9-inning MLB games divided into baseball ‘eras’ as defined by Mitchell T. Woltring, Jim K. Rost, Colby B. Jubenville in their 2018 research paper published by Sports Studies and Sports Psychology. They identified five distinct eras in major league baseball: (1) “Dead Ball” (1901 to 1919), (2) “Live Ball” (1920 to 1941), (3) “Integration” (1942 to 1960), (4) “Expansion” (1961 to 1976), (5) “Free Agency” (1977 to 1993), (6) “Steroids” (1994 to 2005) and (7) “Post-Steroids” (2006 to 2011). However, for this essay, I relabeled their ‘post-Steroids era’ as the ‘Analytics era’ and extended it to the present.
(Note: MLB game length was not consistently measured until the “Integration era.”)
Figure 3: Average length of a 9-inning MLB game since 1946.
Though I will share upon request the detailed statistical analysis of the intervention effects of the baseball eras on the average length of MLB games, the basic findings are straightforward:
(1) The average length of 9-inning MLB games significantly increased during the ‘Integration,’ ‘Free Agency,’ and ‘Analytic’ eras, but did not increase during the ‘Expansion’ and ‘Steroids’ eras.
(2) The long-term trend was already pointing up before the ‘Analytics era’ (+50 seconds per year), though analytics may have had a larger marginal effect on game length (+78 seconds per year).
As to why the ‘Analytics era’ saw an increase in game times, one suggested explanation is that the ‘Steroids era’ disproportionately rewarded juiced-up long-ball hitters who tended to spend less time at the plate. In contrast, though the ‘Analytics era’ also has emphasized home run hitting, the players hitting home runs are now more patient. According to baseball writer Fred Hofstetter, pitchers have also changed:
“This (increase in game times) won’t surprise anyone who follows the game closely. The general demographic change trending into 2020:
- Patient hitters are replacing free swingers
- Hard-throwing strikeout-getters are replacing pitch-to-contact types
Pitchers who throw harder tend to take more time between pitches.9 Smart hitters take more pitches. There are more pitches with more time between them. The result is a rising average of time between pitches.”
Are these changes in the game related to analytics? It is hard to know given the concurrent (and assumed) decline in steroid use in the 2000s MLB, but the apparent consensus is that the pitcher-batter dynamics since 2000 have been more sophisticated and time-consuming than during the ‘Steroid era.’
My conclusion on the impact of analytics on the length of MLB baseball games: Unclear.
Are there other aspects of baseball affected by analytics?
Investigating the role of analytics in 21st century baseball is complicated by the confounding effects of other changes going on in the game around the same time — the most obvious being MLB’s increased enforcement of its performance enhancing drug policies. But sports writer Jeff Rivers notes another ongoing trend: this country’s best athletes are increasingly choosing football and basketball over baseball, though this trend may have been going on for some time.
“Major League Baseball used to offer its athletes the most prestige, money and fame among our nation’s pro team sports, but that hasn’t been true for decades,” writes Rivers. “Consequently, Major League Baseball continues to lose in the competition for talent to other major pro team sports.”
It is also possible analytics have exacerbated this supposed decline in athlete quality by discouraging some of baseball’s most exciting plays.
“The focus on analytics in pro sports has led to more scoring in the NBA…but fewer stolen bases and triples, two of the game’s most exciting plays, in pro baseball,” asserts Rivers.
Is there really a distinct ‘Analytics era’ in baseball?
Another problem in assessing the role of baseball analytics is that the ‘Analytics era’ (what I’ve defined as 2006 to the present) may not be that distinct.
Henry Chadwick invented the baseball box score in 1858 and, by 1871, statistics were consistently recorded for every game and player in professional baseball. In 1964, Earnshaw Cook published his statistical analysis of baseball games and players and seven years later the Society for American Baseball Research (SABR) was founded.
In the early 1970s, as statistics advanced as a topic among fans, Baltimore Orioles player Davey Johnson was writing FORTRAN computer code on an IBM System/360 to generate statistical evidence supporting his belief that he should bat second in the Orioles lineup (his manager Earl Weaver was not convinced, however).
In 1977, Bill James published his first annual Baseball Abstracts which, through the use of complex statistical analyses, argued that many of the popular performance metrics — such as batting average — were poor predictors of how many runs a team would score. Instead, James and other SABRmetricians (as they would be called) argued that a better measure of a player’s worth is his ability to help his team score more runs than the opposition. Instead, the SABRmetricians initially preferred metrics such as On-Base Percentage (OBP) and Slugging Percentage (SLG) to judge player values and would later prefer combining those metrics to create the On-base Plus Slugging (OPS) performance metric.
[Note: OBP is the ratio of the batter’s times-on-base (TOB) (which is the sum of hits, walks, and number of times hit by pitch) to their number of plate appearances. SLG measures a batter’s productivity and is calculated as total bases divided by at bats. OPS is simply the sum of OBP and SLG.]
Batting averages and pitchers’ Earned-Run-Averages (ERA) have been a systematic part of player evaluations since baseball’s earlier days. Modern analytics didn’t invent most of the statistics used today to assess player value, but merely refined and advanced them.
Nonetheless, there is something fundamentally different in how MLB players values are assessed today than in the days before Billy Beane, Paul DePodesta and Moneyball.
But when did analytics truly take over the talent acquisition process in major league baseball? There is no single, well-defined date. However, many baseball analysts point to the 2004 Boston Red Sox, whose general manger was Theo Epstein, as the first World Series winner to be significantly driven by analytics.
Something unique and profound was going on in major league baseball’s front offices from the time between Billy Beane’s 2002 A’s and the Boston Red Sox’ 2007 World Series win, their second championship in four years.
By 2009, most major league baseball teams had a full-time analytics staff working in tandem with their traditional scouting departments, according to Business Administration Professor Rocco P. Porreca.
So, why did I pick 2006 as the start of the ‘Analytics era’? No definitive reason except that is roughly the halfway point between the release of Lewis’s book Moneyball and 2009, the point at which most major league baseball teams had stood up a formal analytics department. It would have been equally defensible to set 2011 or 2012 as the starting point for the ‘Analytics era’ as many of the aggregate baseball game measures we are about to look at changed direction at around that time.
The Central Mantra of Baseball Analytics: “He get’s on base”
Lewis’ book Moneyball outlined the baseball player attribute 2002 A’s assistant general manger Paul DePodesta’s sought after most when evaluating talent: Select players that can get on base.
This scene from the movie Moneyball drives home that point:
As the 2002 A’s scouting team identify acquisition prospects, the team’s general manger, Billy Beane singles out New York Yankees outfielder David Justice:
A’s head scout Grady Fuson: Not a good idea, Billy.
Another A’s scout: Steinbrenner’s so pissed at his decline that he’s willing to eat a big chunk of his contact just to get rid of him.
Billy Beane: Exactly.
Fuson: Ten years ago, David Justice—big name. He’s been in a lot of big games. He’s gonna really help our season tickets early in the year, but when we get in the dog days in July and August, he’s lucky if he’s gonna hit his weight…we’ll be lucky if we get 60 games out of him. Why do you like him?
[Beane points at assistant general manager Peter Brand (aka. Paul DePodesta)]
Peter Brand: Because he get’s on base.
This was the fundamental conclusion analytic modelers started driving home to a growing number of baseball general managers after 2002. Find players that can get on base.
And Theo Epstein was among the first general managers to drink the analytics Kool-Aid and he did it while leading one of baseball’s richest franchises — the Boston Red Sox. Shortly after the 2002 World Series, the Red Sox hired the 28-year-old Epstein, the youngest general manager in MLB history, to help them end their 86-year World Series drought. Two years later, the Red Sox and Epstein did just that, and one of the reasons cited for the Red Sox success was Epstein’s use of analytics for player evaluations. Eventually, Epstein would take his analytics to the Chicago Cubs in 2011, who then ended their 108-year championship drought five years later.
Until Epstein’s departure from the Cubs, there has been scant debate within baseball about the value of analytics. Almost every recent World Series champion– the Red Sox, Cubs, Royals, Astros, and others — has an analytics success story to tell. By all accounts, its here to stay.
So why on his way out the door in Chicago did Epstein throw a verbal grenade into the baseball fraternity by suggesting analytics have had “a negative impact on the aesthetic value of the game and the entertainment value of the game.” And he specifically cited the responsibility of analytics for the recent rise in strikeouts, bases-on-balls, and home runs (as well as a decline in stolen bases) as the primary cause of baseball’s aesthetic decline.
Is Epstein right? The short answer is: It is not at all clear baseball analytics are the problem, even if it did change the ‘aesthetics’ of the game.
A brief look at the data…
As a fan of baseball, I find bases-on-balls and strike outs near the top of my list of least favorite in-game outcomes.
But when we look at the long-term trends in walks and strike outs, its hard to pin the blame on analytics (see Figure 4). Strike outs in particular have been on a secular rise since the beginning of organized baseball in the 1870s, with only three periods of sustained decreases — the ‘Expansion era,’ ‘Live Ball’ and ‘Steroid’ eras. The ‘Analytics era’ emphasis on hard-throwing strike out pitchers over slower-throwing ‘location’ pitchers may be working (strike outs have gone from 6 to 9 per team per game), but it is part of baseball’s longer-term trend — baseball pitchers have become better at striking out batters since the sport’s beginning. The only times batters have caught up with pitching is when either the baseball itself was altered (“Live Ball era”), pitching talent was watered down (“Expansion era”) or the batters juiced up (“Steroids era”).
As for the rise in bases-on-balls, there is evidence of a trend reversal around 2012, with walks rising sharply between 2012 and 2020, the heart of the ‘Analytics era.’ At least tentatively, therefore, we can conclude one excitement-challenged baseball event has become more prominent, but even in this case, the current number of walks per team per game (= 3.5) is near the historical average. At the bases-on-balls peak in the late-1940s, baseball was at its apex in popularity and MLB attendance declined as bases-on-balls plummeted through the 1950s (see Figure 1).
Figure 4: Trends in Bases-on-Balls and Strike Outs in Major League Baseball since 1871.
It is difficult to blame baseball’s relative decline in popularity on increases in strike outs and walks or the role of analytics in those in-game changes.
But what about two of baseball’s most exciting plays — stolen bases and home runs? According to Epstein, the analytics-caused decline in stolen bases and concomitant rise in home runs has robbed the game of crucial action which help drive fan excitement.
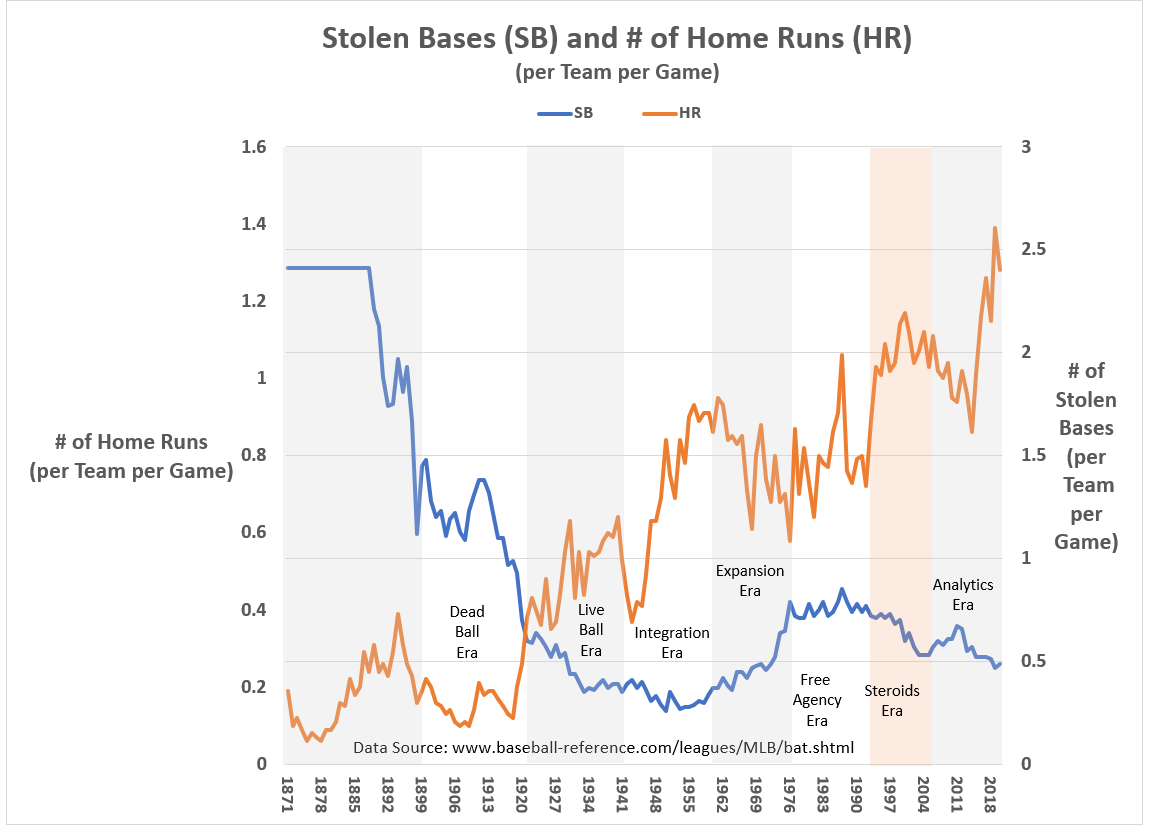
As shown in Figure 5, there is strong evidence that the ‘Analytics era’ has seen a reversal in trends for both stolen bases and home runs. Since 2012, the number of home runs per team per game has risen from 0.9 to 1.3, and the number of steals per team per game has fallen from 0.7 to 0.5.
Stolen bases may be a rarity now in baseball, but they’ve never been common since the ‘Live Ball era,’ having peaked around 0.9 per team per game in the late 1980s. In truth, stolen bases have never been a big part of the game.
Home runs are a different matter. Epstein’s complaint that there are, today, too many home runs in baseball is a puzzling charge. In 45 years as a baseball fan, I’ve yet to hear a fan complain that his or her team hit too many home runs.
Yes, home runs eliminate some of the drama associated with hitting a ball in play — Will the batter stretch a single into a double or a double into a triple? Will the base runner go for third or for home? — but do those in-game aesthetics create more adrenaline or dopamine than the anticipation over whether a well hit ball will go over the fence? I, personally, find it hard to believe that too many home runs are hurting today’s baseball.
But is Epstein right in saying analytics may have played a role in the recent increases in home runs. The answer is an emphatic yes.
As the MLB worked to remove steroids from the game in the late 1990s, the number of home runs per game dropped dramatically…until 2011. As the ‘Analytics era’ has become entrenched in baseball, home runs have increased year-to-year as fast as they did during the heyday of steroids, rising from 0.9 per game per team in 2011 to 1.3 in 2020. In an historical context, professional baseball has never seen as many home runs as it does today.
However, again, in the long-term historical context, the ‘Analytics era’ is just continuing a trend that has existed in baseball since its earliest days. Most batters have always coveted home runs and all pitchers have loathed them — analytics didn’t cause that dynamic.
Figure 5: Trends in Stolen Bases and Home Runs in Major League Baseball since 1871.
The holy grail of baseball analytic metrics is On-base Slugging (OPS) — a comprehensive measure of batter productivity that incorporates more information about how often a batter has multiple base hits.
(and from a defensive perspective, an indicator of how well a team’s pitching and fielding lineup stunts batter productivity).
The highly-regarded OPS is important to baseball analytic gurus because of its strong correlation with the proximal cause of why teams win or lose: The number of runs they score.
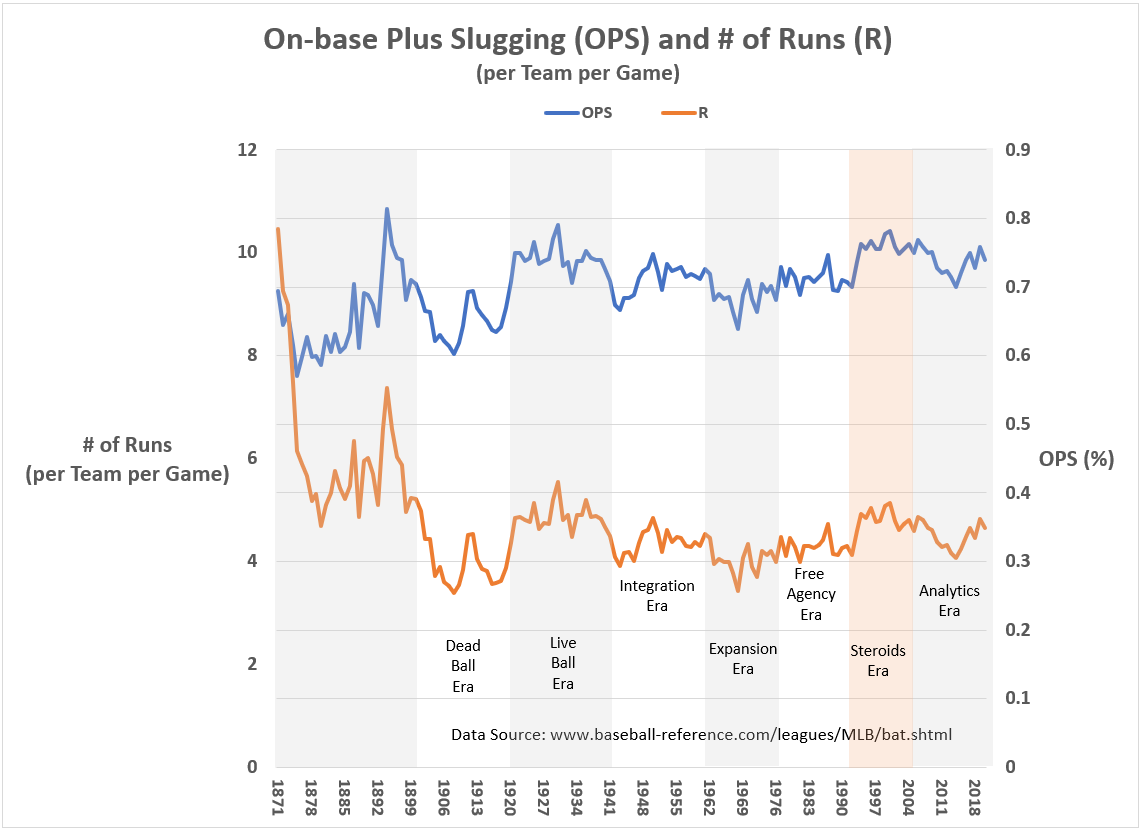
Since 1885, the Pearson correlation between OPS and the number of runs per game is 0.56 (which is highly significant at the two-tailed, 0.05 alpha level). And it is on the OPS metric that the ‘Analytics era’ has made a surprisingly modest impact, hardly large enough to be responsible for harming the popularity of baseball (see Figure 6). If anything, shouldn’t a higher OPS in the aggregate indicate a more exciting type of baseball, even if it includes a larger number of home runs?
Prior to the ‘Analytics era,’ the ‘Steroids era’ (1994 to 2005) witnessed a comparable surge in OPS (and home runs) and the popularity of baseball grew, at least until stories of steroids-use became more prominent in sports media.
Figure 6: Trends in On-base Plus Slugging (OPS) and # of Runs in Major League Baseball since 1871.
Epstein’s pinning baseball’s current troubles on analytics begs the question of what other factors could also be explaining some of the recent changes in the game’s artfulness. These in-game modifications cannot all be dropped at the feet of analytics. The slow pruning out of steroids from the game, shifts in baseball’s young talent pool, the changing tastes of American sports fans, and the growth in other sports entertainment options cannot be ignored.
Final Thoughts
Baseball has real problems, particularly with the new generation of sports fans. The MLB should not under-estimate the negative implications of this problem.
However, the sport is not dying and analytics is not leading it towards a certain death. Analytics did not cause baseball’s systemic problems.
For those who assume major league baseball is a sinking ship, analytics has done little more than re-arrange the deck chairs on the Titanic. However, for those of us who believe baseball is still one of the great forms of sports entertainment, we must admit the sport is dangerously out-of-touch with the modern tastes and appetites of the average American sports fan.
And though analytics may not have helped the sport as much as Moneyball suggested it would, neither has it done the damage Epstein suggests.
- K.R.K.
Send comments to: nuqum@protonmail.com
Postcript:
This is my favorite scene from Moneyball. It is the point at which head scout Grady Fuson (played by Ken Medlock) confronts Billy Beane (Brad Pitt) over his decision-making style as general manager. Most Moneyball moviegoers (and readers of Lewis’ book) probably view Fuson as the bad guy in the film — a dinosaur unwilling to change with the times. As a statistician whose faced similar confrontations in similar contexts, I see Fuson as a irreplaceable reality check for data wonks who believe hard data trumps experience and intuition. In my career, I found all of those perspectives important.
Fuson asks Beane into the hallway so he can clear the air. Fuson then says to Beane:
“Major League Baseball and its fans would be more than happy to throw you and Google boy under the bus if you keep doing what you’re doing here. You don’t put a team together using a computer.
Baseball isn’t just numbers. It’s not science. If it was, anybody could do what we’re doing, but they can’t because they don’t know what we know. They don’t have our experience and they don’t have our intuition.
You’ve got a kid in there that’s got a degree in economics from Yale and you’ve got a scout here with 29 years of baseball experience.
You’re listening to the wrong one now. There are intangibles that only baseball people understand. You’re discounting what scouts have done for a hundred and fifty years.”
Years later, Fuson would react to how he was portrayed in Lewis’ book and subsequent movie:
“When I was a national cross-checker, I raised my hand numerous times and said, ‘Have you looked at these numbers?’ I had always used numbers. Granted, as the years go on, we’ve got so many more ways of getting numbers. It’s called ‘metrics’ now. And metrics lead to saber-math. Now we have formulas. We have it all now. But historically, I always used numbers. If there’s anything that people perceived right or wrong, it’s that me and Billy are very passionate about what we do. And so when we do speak, the conversation is filled with passion. He even told me when he brought me back, ‘Despite what some people think, I always thought we had healthy, energetic baseball conversations.’”
At times I think people want to believe analytics and professional intuition are mortal enemies. In my experience, one cannot live without the other.

