Monthly Archives: March 2019

Progressive Democrats are as divided as their party

__________________________________________________________________

This is the fourth essay in a series dedicated to analyzing the U.S. eligible-voter population using the 2018 American National Election Study (ANES), an online survey administered in Dec. 2018 by researchers from the Univ. of Michigan & Stanford Univ. 

__________________________________________________________________

By Kent R. Kroeger (Source: NuQum.com; March 19, 2019

According to an analysis of the 2018 ANES, Progressive Democrats represent roughly one-third of the American eligible-voter population and two-thirds of all Democrats; and, by some accounts, are the ‘center of gravity’ in American politics today.

But the progressives have a problem. A big problem, if they want to win back the presidency in 2020.

Progressive Democrats are deeply divided. That is does not sound like a breaking news story to anyone that has followed politics in the last two years.

But the usual media narrative goes something like this: Establishment Democrats, centrist and pragmatic in nature, are being pulled (presumably against their better judgment) to the far left by their progressive counterparts in the party.

This narrative often gets confounded with the notion of a progressive versus centrist divide where the party establishment is generally linked to the centristfaction. However, as discussed in a previous essay, when we look at the attitudes of actual voters, the Democratic Party’s establishment wing — often represented among politicians by Nancy Pelosi, Chuck Schumer, Tom Perez, Joe Biden, Kamala Harris, etc. — is a much better match with the progressive voters in the party, not the centrists. Democrat-leaning centrists are decidedly more conservative than their progressive counterparts on abortion and LGBTQ rights, climate change, immigration policy and a whole host of other core issues that tend to define the mainstream of the Democratic Party.

When we talk to flesh and blood human beings, not politicians, the mainstream Democratic Party voter is progressive, not centrist — and the party’s establishment, on most issues, stands squarely with the progressive mainstream.

But this is where it gets tricky and where the political media often gets it wrong when they discuss progressive Democrats.

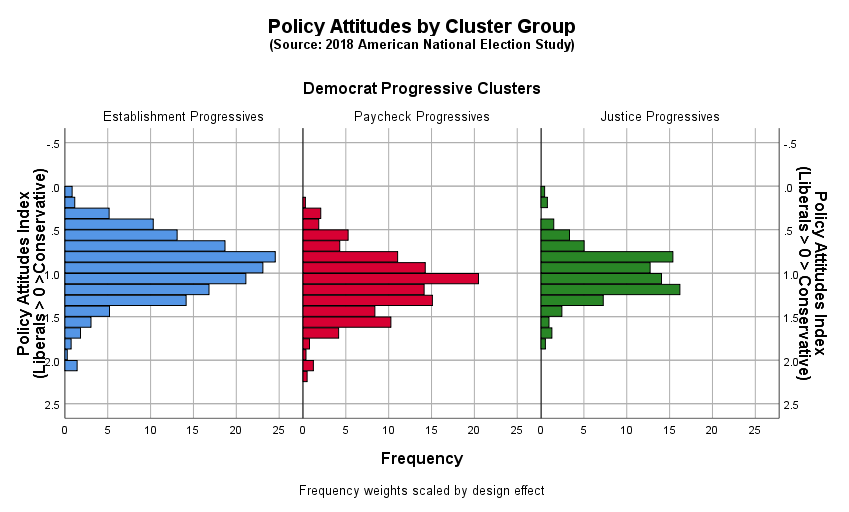
Labeling someone a ‘progressive Democrat’ is not analytically useful unless you are identifying a specific type of ‘progressive Democrat.’ But the progressive types are not related to variation in policy attitudes (as we might assume). The Progressive Democrats (identified in my earlier segmentation analysis of the 2018 ANES) share, by construction, similar views on: abortion rights, LGBTQ rights, health care policy, gender equality, immigration, social spending, climate change, and racial discrimination (see Figure A.1 in the Appendix).

In my subsequent drill-down into Progressive Democrats (using a K-means clustering algorithm) I find three distinct subgroups based on respondents’ personal orientations and emotional attachments to common elements found in the political world (i.e., groups, identities, individuals, etc.). And further analysis finds these differences to be associated with substantive variation on candidate preferences.

The Three Progressive Segments

Formed from the relative differences respondents’ group affinities, three distinct segments emerge within Progressive Democrats (see Figures 1 through 5 for attitudinal differences between the segments):

Establishment Progressives (45% of all progressive Democrats): Relative to the other two segments, these are progressives with strong affinities towards racial and ethnic groups, the LGBTQ community, the police, capitalists, Hillary Clinton, Special Counsel Robert Mueller, and the FBI.

Paycheck Progressives (32% of all progressive Democrats): Again, relative to the other segments, these are progressives with lower affinities towards racial and ethnic groups, immigrants, the LGBTQ community, Hillary Clinton and the #MeToo movement.

Justice Progressives (23% of all progressive Democrats): And, finally, these progressives show strong relative affinities towards racial and ethnic groups (except whites), the LGBTQ community, the #MeToo movement, immigrants, socialists, but low affinities towards whites, capitalists, rural Americans, journalists, the police, the FBI, Special Counsel Robert Mueller, Hillary Clinton, and the U.S. Supreme Court.

Figure 1: Group Affinities by Progressive Democrats Segment (0 to 100 thermometer scale, where high values indicate strong positive feelings)
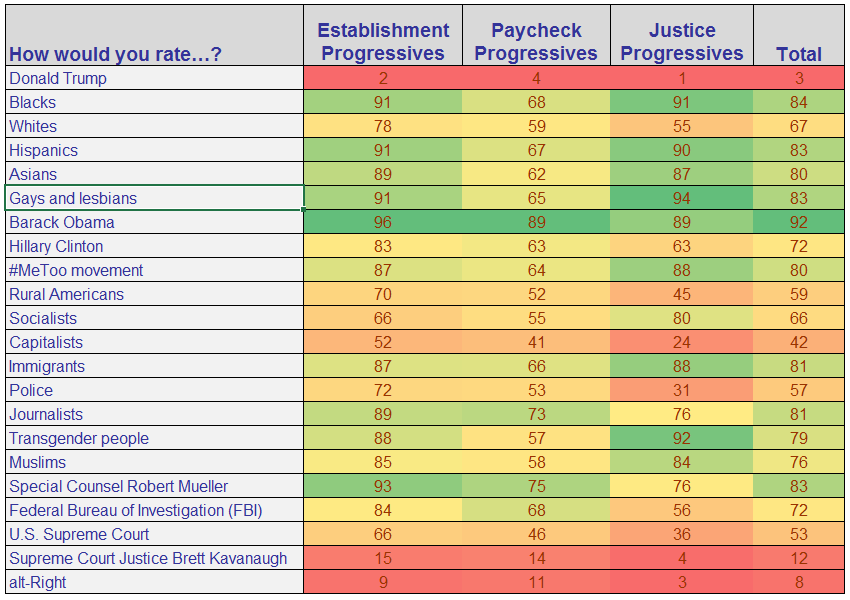
Data Source: 2018 American National Election Study (Pilot); Analytics and Segmentation by Kent R. Kroeger


Figure 2: Group Affinities towards Economic Philosophies
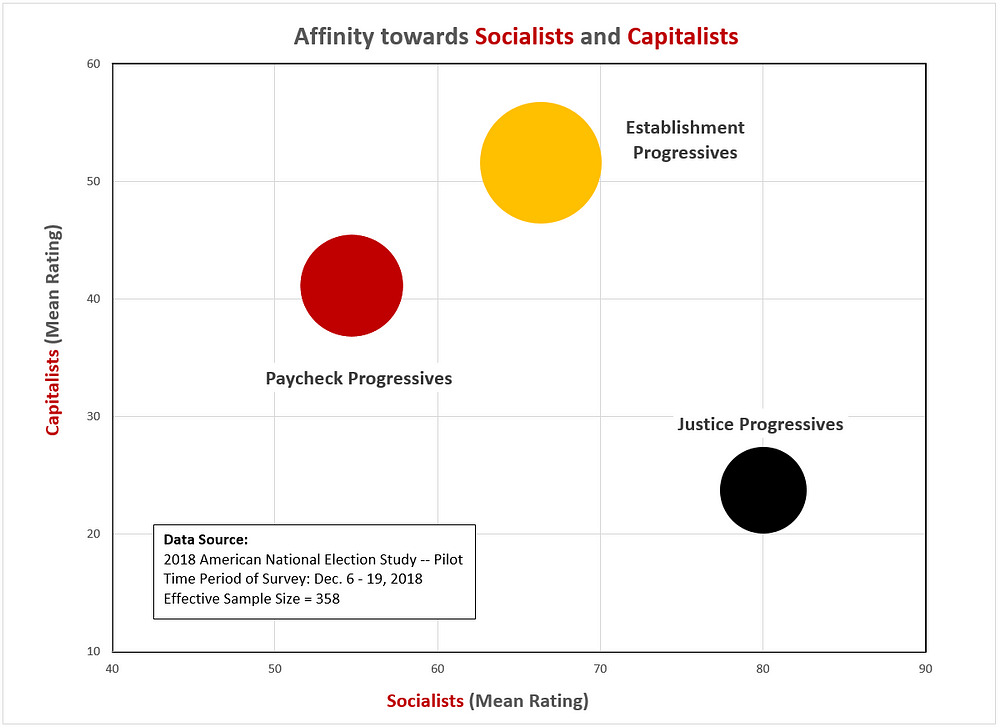
 

Figure 3: Group Affinities towards the LGBTQ community


Figure 4: Group Affinities towards the #MeToo Movement and Immigrants


Figure 5: Group Affinities towards Racial Groups
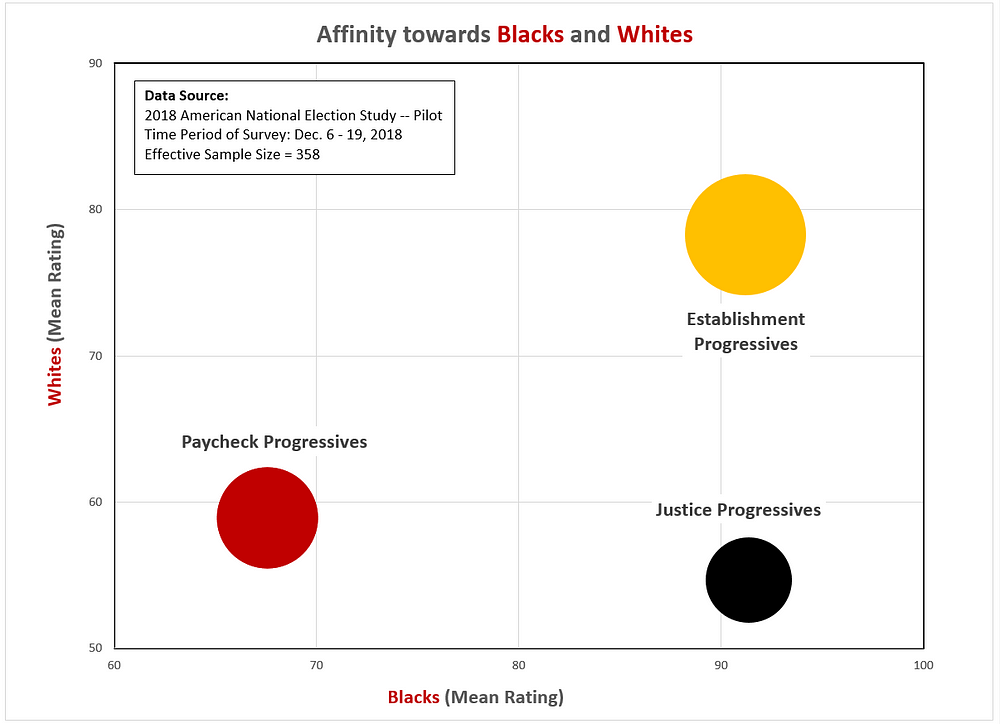
Data Source for Figures 2 through 5: 2018 American National Election Study (Pilot); Analytics and Segmentation by Kent R. Kroeger

Naming the Segments

By construction, the three segments differ in their orientation towards various people and social groups, but they also differ in terms of demographics and behavior.

The most apparent difference is age (see Figure 6). Justice Progressives are the youngest segment (mean age = 38), followed by Paycheck Progressives(mean age = 46), and the Establishment Progressives (mean age = 54).

Figure 6: Age Distributions 
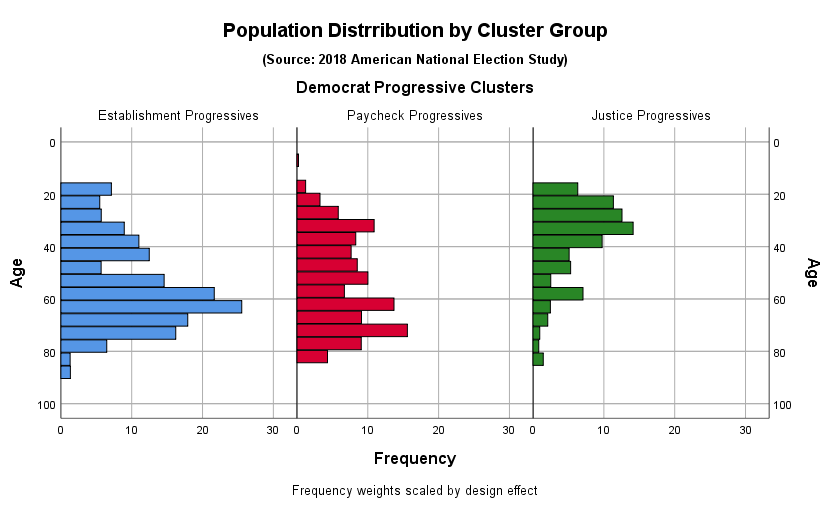
Data Source: 2018 American National Election Study (Pilot); Analytics and Segmentation by Kent R. Kroeger


Another factor separating the progressive segments is self-reported ideology. Justice Progressives are most likely to call themselves ‘‘very liberal’ (59%), while Paycheck Progressives and Establishment Progressives are most likely to call themselves ‘somewhat liberal’ or ‘moderate’ (71% and 70%, respectively).

In a multinomial logistic regression analysis, age and self-reported ideology proved to be the most significant predictors of membership in the three progressive segments. Those relationships are evident in Figure 7, particularly in how those factors distinguish Justice Progressives from the other two segments.

Figure 7: Progressive segments by Age and Self-Reported Ideology
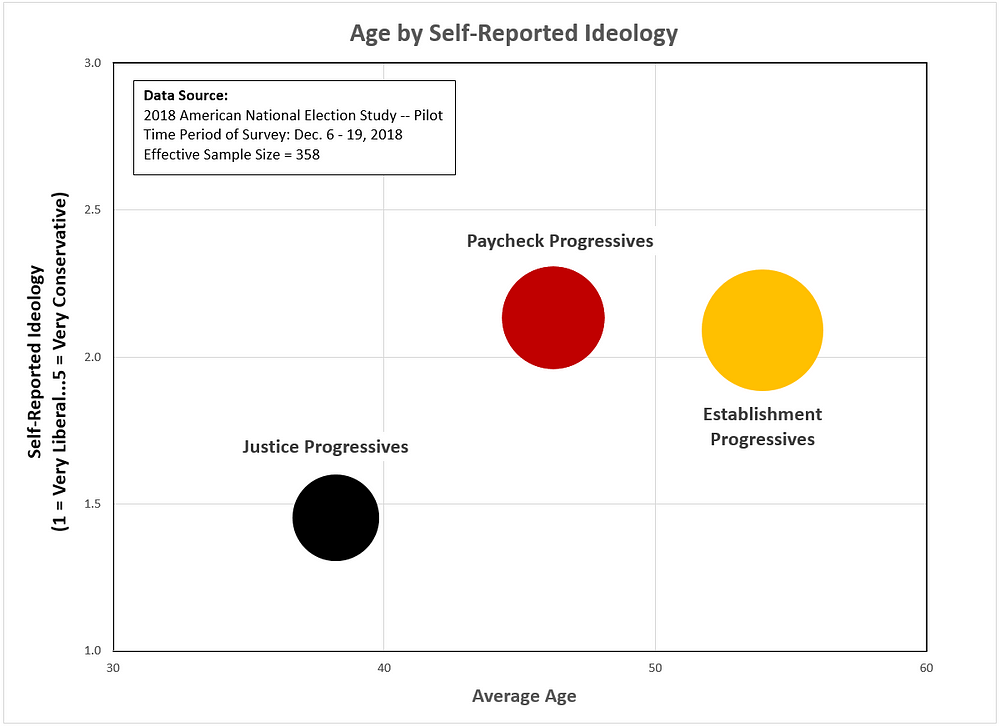
Data Source: 2018 American National Election Study (Pilot); Analytics and Segmentation by Kent R. Kroeger

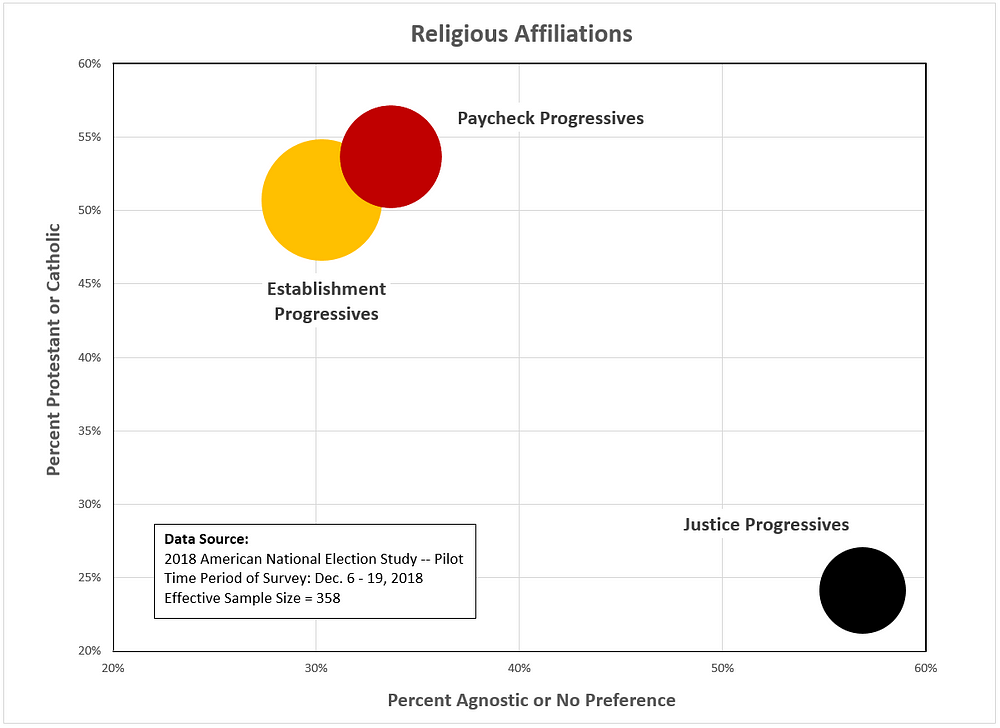
Gender, age, education, life-stage, and group affinities were central to the naming of the three progressive segments (Figures 8 and 9 show how gender, education, and religious affiliation differentiate the segments). Notably, differences in racial and ethnic characteristics are not statistically significant across the three segments (though, directionally, the Justice Progressives do appear to be more racially and ethnically diverse).

Segment Descriptions

Establishment Progressives tend to be female, older, wealthier, pro-capitalism, and very tuned in to the Robert Mueller investigation. Paycheck Progressives tend to be male, middle-aged, married (with children) and at a point in their life when they are more likely to be concerned about a mortgage payment than identity politics or the Mueller investigation. Finally, Justice Progressives are the prototypical image of progressives offered by the media: female, young, highly-educated, non-religious, anti-capitalist, and more concerned about ‘white privilege’ and identity politics than the Mueller investigation.

If it helps to put faces on the segments, Establishment Progressives might be represented by Hillary Clinton and Nancy Pelosi, Paycheck Progressives by Joe Biden and New Jersey Senator Cory Booker (admittedly, rough fits here), and Justice Progressives by New York Representative Alexandria Ocasio-Cortez and California Representative Ro Khanna.

Figure 8: Progressive segments by Gender and Education
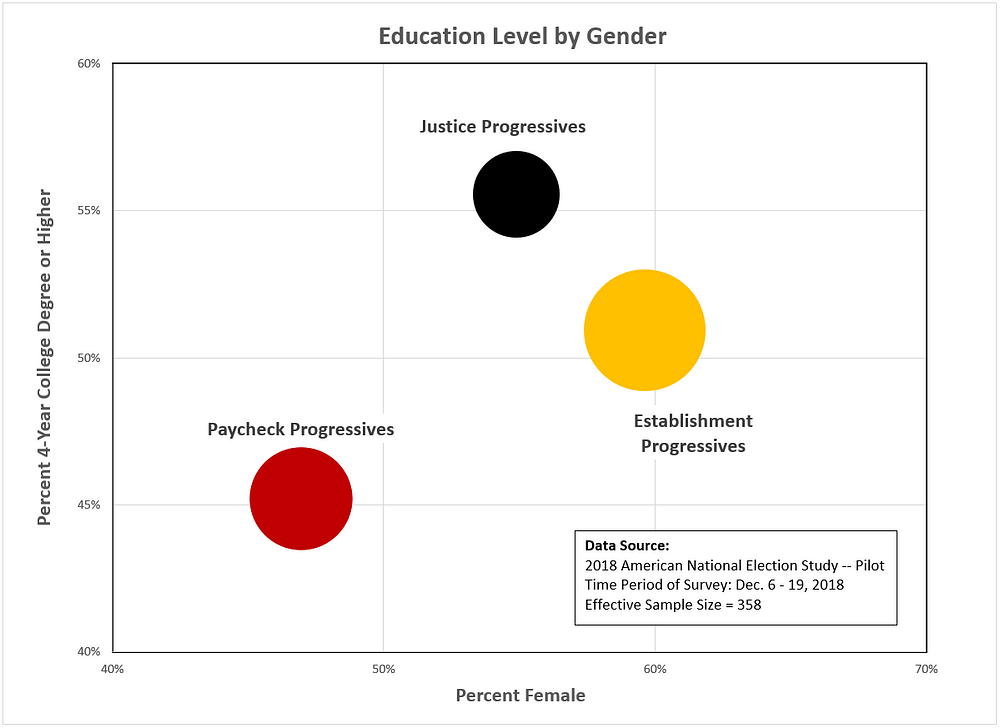
 

Figure 9: Progressive segments by Religious Affiliation
Data Source for Figures 8 and 9: 2018 American National Election Study (Pilot); Analytics and Segmentation by Kent R. Kroeger

Behavioral Differences

Having established the demographic differences, there are also behavioral factors that distinguish the progressive segments — in fact, its these factors that make the segments relevant to the Democratic Party’s strategy going into the 2020 election.

The suspected culprits behind Hillary Clinton’s defeat to Donald Trump in 2016 are many, not the least of which are the Berniecrats who some have claimed disproportionately either voted for Trump, voted for a third party candidate, or did not vote. That dispute won’t be settled here, but the progressive segments give us some clues.

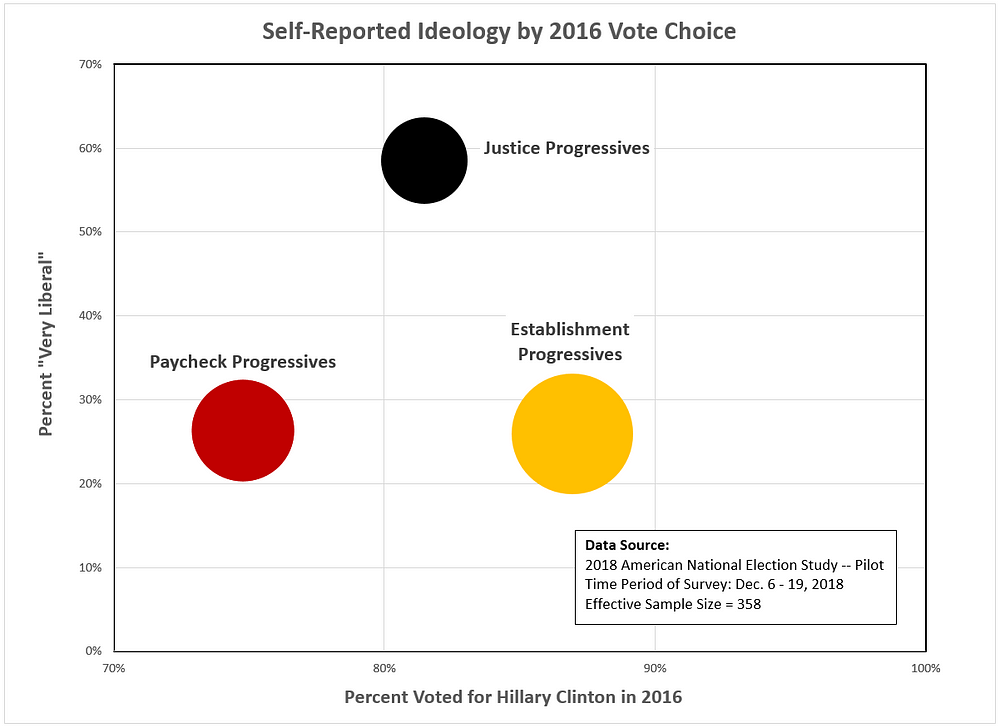
In an earlier essay, I determined that 81 percent of Democratic Progressives, the most liberal voter segment, voted for Hillary Clinton (14 percent did not vote, 4 percent voted for a third party candidate, and 1 percent voted for Trump). When we breakout the Clinton vote by the three progressive segments in Figure 10, we have a likely suspect for the bulk of defections from Clinton: Paycheck Progressives (of whom only 75 percent voted for Clinton, 17 percent did not vote, 4 percent voted for a third party candidate, and 4 percent voted for Trump).

If I am hearing cries of ‘sexist pigs,’ it is understandable given that Paycheck Progressives skew male — but, given the small sample size (115 respondents), there is no statistically significant difference in the 2016 voting behavior of male Paycheck Progressives and female Paycheck Progressives.

But if we are going to call out the Paycheck Progressives, we must also throw a stink-eye gaze at the Justice Progressives, who also voted for Clinton at a lower rate than Establishment Progressives (75% versus 87%, respectively). If the two segments had voted for Clinton at the same rate as the Establishment Progressives, in all likelihood, Clinton wins Florida, Wisconsin, Michigan, Pennsylvania and the presidency.

Figure 10: The Paycheck and Justice Progressives may have let Hillary down
Data Source: 2018 American National Election Study (Pilot); Analytics and Segmentation by Kent R. Kroeger

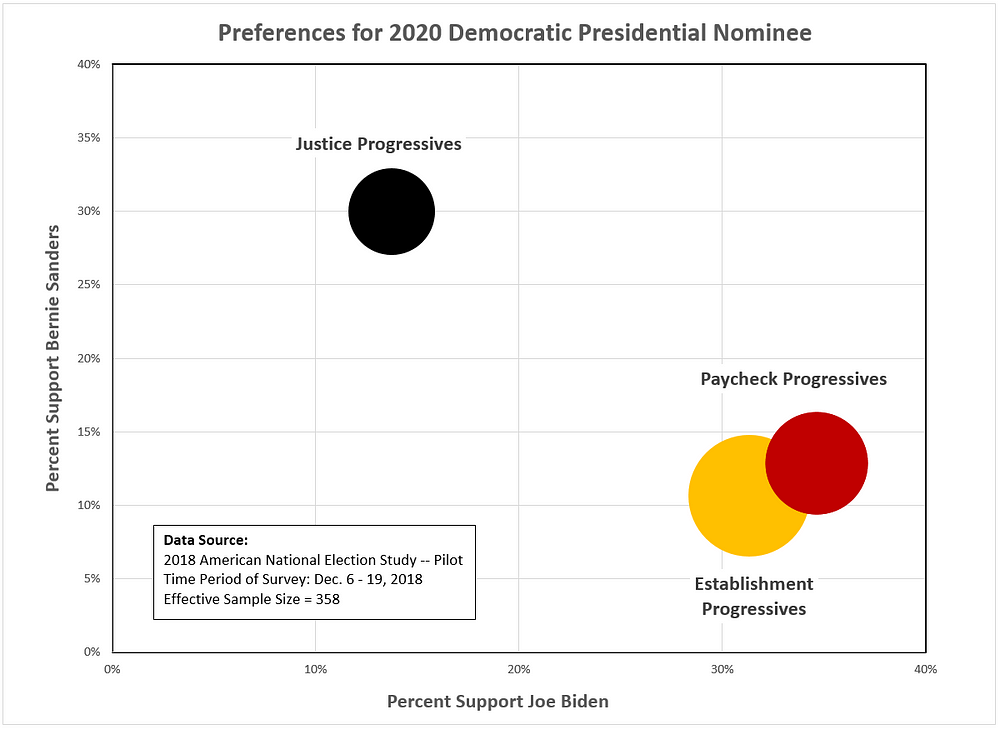
Finally, the 2018 ANES also asked likely 2020 Democratic Party primary voters which candidate they currently prefer (see Figure 11). When this preference is crossed with the progressive segments, we get some validation of the segmentation categories — 30 percent of Justice Progressives prefer Bernie Sanders, while over 30 percent of both Paycheck Progressives and Establishment Progressives prefer former Vice President Joe Biden.

The progressive segments mate nicely with 2020 vote preferences, keeping in mind that most of the now declared Democratic candidates for president were not well known in December 2018 when the survey was conducted. In fact, only three candidates exceed 10 percent support among Democrats in the survey (Biden, Sanders, and Beto O’Rourke).

Figure 11: Preferences for the 2020 Democratic Party Nominee
Data Source: 2018 American National Election Study (Pilot); Analytics and Segmentation by Kent R. Kroeger

Still, this segmentation should cause some worry among Sanders supporters, as the two largest progressive segments, representing three-quarters of progressives, are not (currently) fertile territory for finding Sanders support.

Keep in mind, this analysis does not look at the other Democratic Party-aligned voter segment — Centrist Democrats — which is a group, surprisingly, where Sanders does relatively well, according to the 2018 ANES.

Democratic Progressives however exceed their Centrist allies in market share by 2 to 1 and it is hard to envisage the Democratic Party’s ‘center of gravity’ being anywhere but with the progressives in 2020. Yet, within the progressives, existing divisions — which at least marginally impacted the 2016 election outcome — could easily do so again.

Still, Establishment Progressives are the largest force within the party’s progressive wing, and by extension, the most dominant force in the Democratic Party.

Unless something dramatic happens, that is bad news for Berniecrats.

  • K.R.K.

Send comments and online gift cards to: kroeger98@yahoo.com


APPENDIX: Additional Charts, Tables and Graphics

Figure A.1: Policy Attitudes by Progressive Segment 
Data Source: 2018 American National Election Study (Pilot); Analytics and Segmentation by Kent R. Kroeger


Figure A.2: Feelings about Capitalism by Age (among Progressive Democrats) 
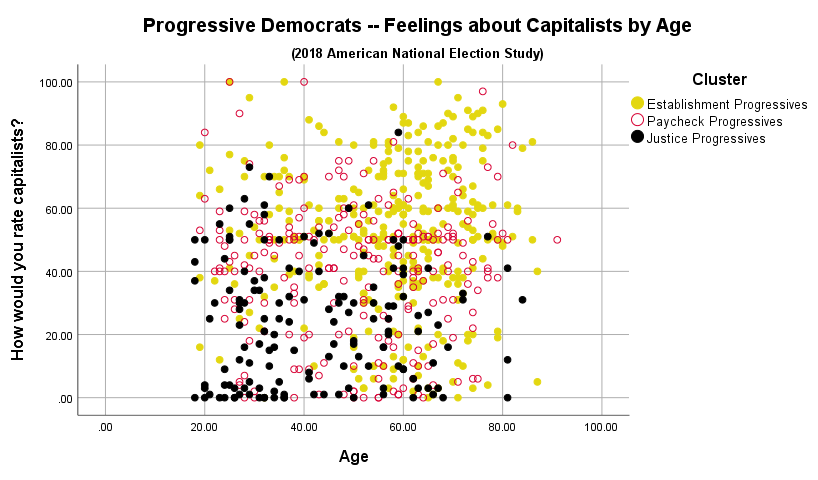
Data Source: 2018 American National Election Study (Pilot); Analytics and Segmentation by Kent R. Kroeger


Figure A.3: Feelings about the Police by Age (among Progressive Democrats) 
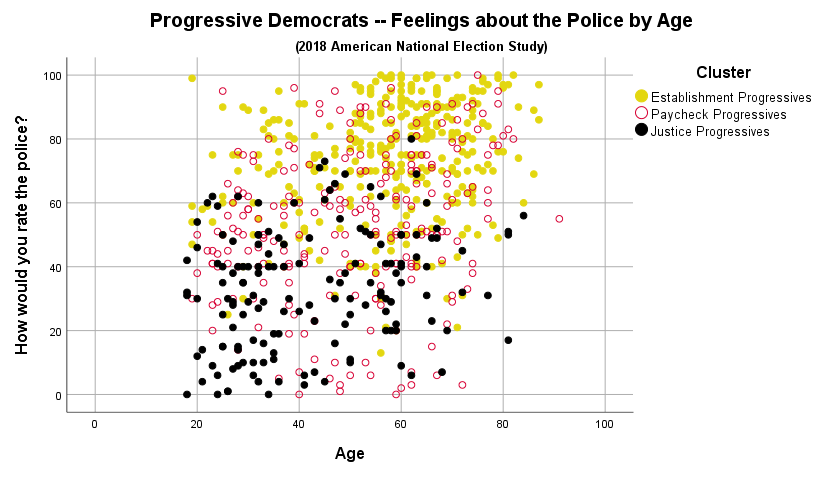
Data Source: 2018 American National Election Study (Pilot); Analytics and Segmentation by Kent R. Kroeger


Figure A.4: 2016 Vote Choice by Progressive Democrat Segments 

Data Source: 2018 American National Election Study (Pilot); Analytics and Segmentation by Kent R. Kroeger


Figure A.5: 2016 Vote Choice by Party Factions 

Data Source: 2018 American National Election Study (Pilot); Analytics and Segmentation by Kent R. Kroeger

How Americans Cluster on Identity Politics

_________________________________________________________________________

This is the third essay in a series dedicated to analyzing the U.S. eligible voter population using the 2018 American National Election Study (ANES), an online survey administered in December 2018 by researchers from the University of Michigan and Stanford University.

__________________________________________________________________________

By Kent R. Kroeger (Source: NuQum.com; March 14, 2019)

Republican pundits are loving the post-2016 emphasis Democrats place on identity politics, while some Democratic pundits are wringing their hands.

“Embrace of Identity Politics Is Killing Democratic Party

“Democrats Need to Drop Identity Politics — Now”

“Identity Politics, and the Divisible Nation for Which It Stands”

“Democratic Playbook’s Only Page: Division”

It is a term we cannot escape. But what does it actually mean? And what can the 2018 ANES offer in understanding its importance in today’s political environment.

While I want to keep the pretensions here light, a short discussion of definitions might be helpful.

Stanford philosophy professor Laura Maguire defines identity politics as “when people of a particular race, ethnicity, gender, or religion form alliances and organize politically to defend their group’s interests.” The best known examples would be the feminist, civil rights, and gay rights movements.

But that is a rather narrow, sectarian definition, as people can be engaged in identity politics outside their own identity group. You don’t need to be a woman to be a feminist. And there was a White Panther Party aligned with the Black Panther’s in the late-1960s. Our personal identities don’t limit our potential for engaging across the multidimensional space of identity politics.

Furthermore, identity politics is not as utilitarian as Maguire’s definition. Identity politics can be a private and passive activity as well. A person opposed to — or even ambivalent towards — the interests of other identity groups is participating in identity politics. Of a more consequential nature, making vote choices based on group identities is identity politics. That is a consequential act that requires no more than a private thought and a valid voter registration.

This broadly defined, everyone engages in identity politics, consciously and unconsciously. And with this expansive view of identity politics, I undertook the task of clustering Americans according to how they engage in identity politics.

The Data

The 2018 ANES asked 2,500 respondents a series of attitudinal measures regarding their affinity towards specific identity groups, individuals, social movements, and organizations (see Figure 1). These questions were inputs into a K-means clustering algorithm implemented in the SPSS statistical package.

Figure 1: 2018 ANES Questions Used for Identity Politics Clustering

The K-means clustering algorithm partitions respondents into clusters in which each respondent belongs to the cluster with the nearest mean. To the best extent possible, the aim is to make the clusters as homogeneous as possible while maximizing the differences across clusters.

The most enjoyable task in conducting a cluster analysis is naming the clusters. Ideally, the names are indicative of the “prototypical” member in that cluster. However, in most cluster analyses, particularly those representing large populations, individual clusters can be heterogeneous and the naming process becomes more art than science. That is when it really gets fun.

The Results

With that caveat, I identified five identity politics clusters (IPCs) in the U.S. eligible voter population. Within each of these IPCs, additional sub-clusters were identified and will be discussed in a future essay.

For now, I will describe the five macro-clusters represented in Figure 2 by their relative population size.

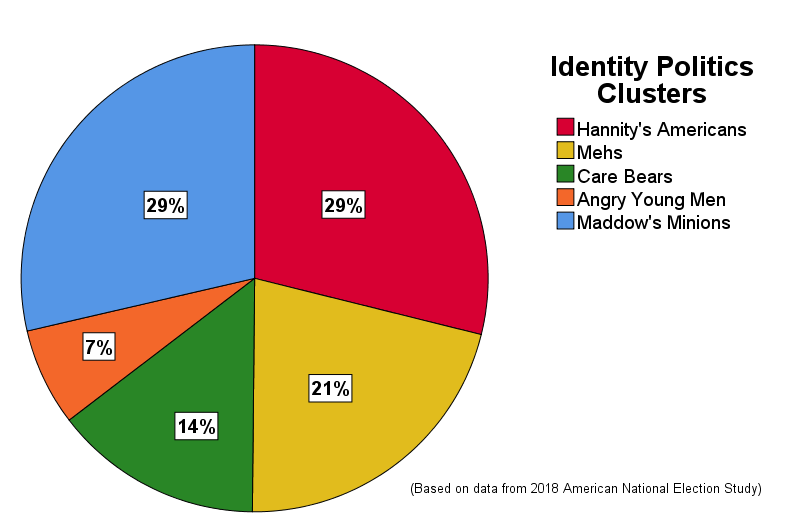
Figure 2: The Identity Politics Cluster Sizes (U.S. eligible voter population)

Data source: 2018 American National Election Study; Analytics and Segmentation by Kent R. Kroeger

The two largest IPCs are Hannity’s Americans (29%), a cluster containing mostly Republicans, and its counterpoise, Maddow’s Minions (29%), a cluster composed almost entirely of Democrats.

The next largest cluster is the Mehs (21%) — distinguished by their general ambivalence or lack of affinity for any specific person or group. The Care Bears (14%), in contrast, like everybody (except President Trump). And, finally, the Angry Young Men (7%), the smallest cluster and notable for their dislike of pretty much everybody (except President Trump and white people).

The IPCs distinguish themselves by their average ratings of the various identity groups, individuals and organizations (see Figure 3). For example, among the five clusters, Hannity’s Americans rate Donald Trump the highest (mean rating = 89.5). Not surprisingly, Maddow’s Minions can only muster an average rating of 2.3 for the current president. I don’t think he’s a fan of Rachel Maddow any way.

On the other end of the scale, Hannity’s Americans rate Hillary Clinton a 4.6 and Barack Obama only slightly better at 12.1.

Figure 3: The Identity Politics Cluster Sizes (U.S. eligible voter population)

Among the racial and ethnicity-defined identity groups, Hannity’s Americans and Maddow’s Minions are roughly similar in their ratings for Blacks, Hispanics, and Asians when viewed as a deviation from the cluster’s group mean (i.e., the color-coding in Figure 3). However, where Maddow’s Minions rate whites lower than Blacks, Hispanics or Asians, Hannity’s Americans rate whites higher than those groups.

However, on other identity groups, the differences are stark. Hannity’s Americans, on average, rate the #MeToo movement a 19.3, compared to 83.6 for Maddow’s Minions. Hannity’s Americans rate socialists a 9.5, on average; while Maddow’s Minions give them a 65.4 rating.

The two biggest clusters are predictable considering their strong partisan composition and 30 years of a growing partisanship divide within the American public. By now, anyone that is a strong partisan should know the ‘in’ groups from the ‘out’ groups. Hannity’s Americans like capitalists, rural America, and the police; Maddow’s minions like immigrants, transgender persons and journalists. We didn’t need a survey to tell us that.

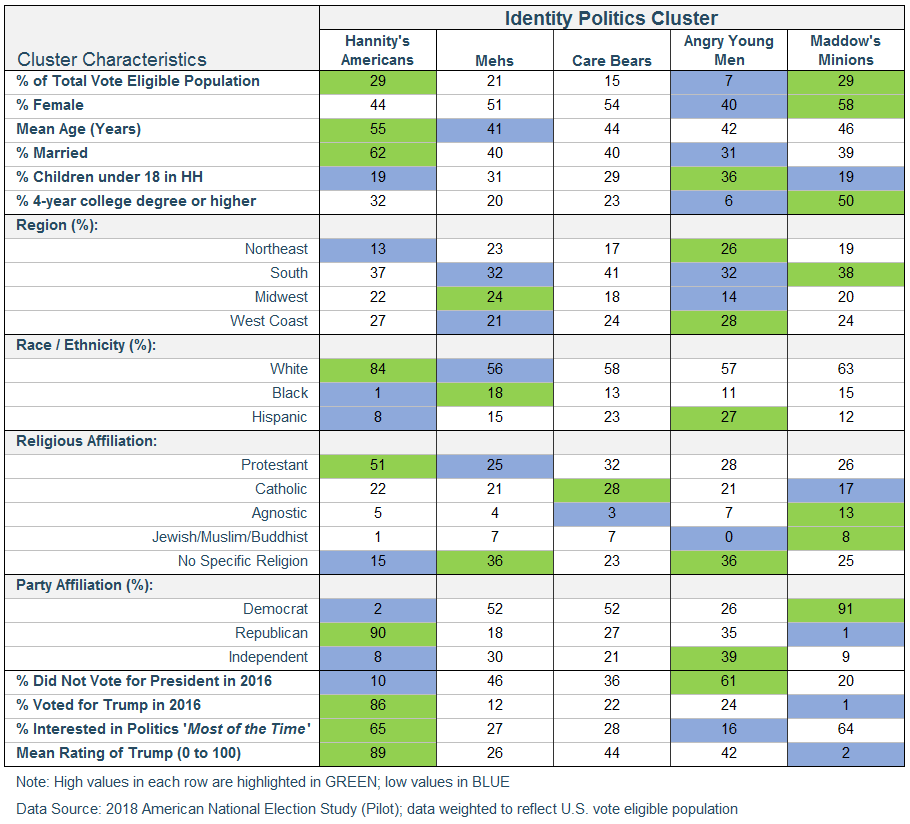
Not as obvious are the three ‘middle’ clusters. They represent 40 percent of the eligible voter population, a potentially relevant force in any election (though all three clusters have much lower voter turnout rates than the two partisan clusters; see Figure 4).

The Mehs are the least interesting in terms of variation across their identity group ratings. Their average rating ranges between 40 and 55 — with two exceptions: They like Obama (66.3%) and dislike Trump and Supreme Court Justice Brett Kavanaugh (26.0 and 29.4, respectively). Spoiler alert: In Figure 4 you will notice Mehs skew female.

The Care Bears skew even more female than Mehs but have a greater affinity for the various identity groups. They like almost everybody (except, again, Trump — I think he might have a problem with the ladies).

In contradistinction are the Young Angry Men who dislike everybody, except Trump, whites, and rural Americans — but, frankly, this cluster isn’t thrilled with them either as all fail to break the rating scale’s midpoint (50).

Figure 3: The Identity Politics Cluster Sizes (U.S. eligible voter population)

How can find these cluster members?

If a political party or campaign were to target any of these five clusters, Figure 4 would be a good place to start that process.

I won’t cover here every demographic and behavioral detail for the IPCs. Hopefully, Figure 4 makes those characteristics clear. A simple summary must suffice for now:

Hannity’s Americans are largely white, Christian, older Republicans that voted for Trump and are interested in politics.

Maddow’s Minions are largely white, educated, female Democrats (no children) that did not vote for Trump and are interested in politics.

Mehs are largely young, racially diverse and less likely to be religious.

Care Bears are largely in the middle on most attributes, but have a high percentage of Catholics and a low percentage of agnostics.

And, lastly, Angry Young Men are…well…young men. But a sizable number have children in their household, are racially diverse, are political independents, and live on either the East or West Coasts. The quality they do not possess is an interest in politics which explains why most of them did not vote in 2016. For political mobilizing and vote harvesting purposes, this group would be a slog for even the Republicans.

Figure 4: The Identity Politics Cluster Sizes (U.S. eligible voter population)

Implications

After running these clusters past a former colleague, now a Democrat-aligned pollster, a question arose: How do the two major factions within the Democratic Party (Progressives and Centrists) relate to the identity politics clusters?

Figure 5 cross tabulates the IPCs by the party factions identified in a previous segmentation analysis (using the 2018 ANES data). The association between the two segmentations — one formed using only policy-related questions and one formed using the identity group affinity questions — is strong.

Figure 5: The Identity Politics Cluster Sizes by Party Factions

Data source: 2018 American National Election Study; Analytics and Segmentation by Kent R. Kroeger


Most of Maddow’s Minions (81%) are also Democrat Progressives. Similarly, most of Hannity’s Americans (85%) are also GOP Conservatives.

As to where Democrat Centrists are categorized among the IPCs, it is more complicated. Over 70 percent of them split between the Mehs and Care Bears. Only 20 percent of them belong to Maddow’s Minions. Likewise, GOP Centrists mostly divide themselves between the Mehs and Care Bears.

This is a key strategic finding. GOP and Democrat Centrists share considerable common ground with respect to identity politics and actually divide in a similar fashion — roughly one-third are disconnected or ambivalent towards identity politics (Mehs), one-third demonstrate caring across a broad range of identity groups (Care Bears), and most of the rest are fully engaged in identity politics. If identity politics is an important focal point for the Democrats in the 2020 presidential election, their Gettysburg may come down to the battle for the vast majority of Care Bears — a population segment that is predominately female and votes. If the Democrats don’t win this group — by a lot — they don’t win the presidential election.

A superficial read of recent stump speeches by the Democratic presidential candidates — FiveThirtyEight’s Adam Kelsey posts summaries and links to these speeches here — highlights the prominent role identity politics is already playing in the 2020 campaign.

Oppression. Privilege. Reparations. Dignity. Reproductive rights. Gay rights. Racial justice. Justice. Justice. Justice.

All words and phrases peppered throughout the candidate speeches. Even those candidates centered on material, economic issues — Bernie Sanders, Elizabeth Warren — explicitly link those issues to identity politics.

Its not simply about fighting climate change anymore, say Democrats, its now about repairing racial injustices and income inequities bred by our carbon-based energy consumption. Slow wage growth and growing income equality can’t merely be addressed through economic policy, we must now tear down institutions that protect privilege and create new, more equitable ones that correct for the damage caused by a long history of race and gender-based oppression.

These are the mainstream arguments being made now by the leading Democratic presidential candidates. And why shouldn’t they? Two-thirds of their party is composed of progressives who hold strong affinities towards groups found at the medial point of today’s identity politics.

But if the Democratic Party nominee continues with this strategy in the general election, will it work with centrist and independent voters, a good share of whom will be needed if the Democrats are to regain the White House?

A deeper drilling down into the identity politics clusters would help answer that question, but even these clusters viewed at the 30,000-foot-level, as done in this essay, lead me to believe YES is the answer.

The two election front line groups — Mehs and Care Bears — skew female and Democrat. The numbers are simply in the Democrats’ favor.

Sorry my GOP friends. But based on what I am seeing, the Democrats are not imploding under the weight of identity politics — they are on message with the majority of Americans.

  • K.R.K.

Data and SPSS computer codes available upon request to: kroeger98@yahoo.com


Americans don’t hide their racism 

__________________________________________________________________

This is the second essay in a series dedicated to analyzing the U.S. eligible-voter population using the 2018 American National Election Study (ANES), an online survey administered in Dec. 2018 by researchers from the Univ. of Michigan and Stanford Univ.. 

__________________________________________________________________

By Kent R. Kroeger (Source: NuQum.com; March 12, 2019)

How best to measure racism has long been debated in the political science, psychology and sociology research communities where the measures that have been developed inevitably meet with significant criticism.

The direct, self-reported method, in which researchers ask respondents directly whether they prefer their own race over others, is the most commonly used measure of individual racial bias. Using direct measures, research shows that individual racist beliefs have been in decline since the 1970s, according to longitudinal data from the General Social Survey.

Disputing this conclusion, some social scientists argue that social desirability bias —where respondents give answers based on what they believe to be ‘socially acceptable’ answers as opposed to how they actually feel — invalidate direct racism measures. However, recent research by University of Virginia psychologist Jordan R. Axt compared direct and indirect measures of racism and found that “the best method to measure individuals’ explicit racial attitudes is to ask about them directly.” People are generally honest when they answer survey questions on racial attitudes.

The direct versus indirect racism measures controversy will not be resolved here, however, and I do not out-of-hand dismiss the criticism that direct measures under count actual levels of individual racism.

With that caveat, this article— the second where I analyze 2018 American National Election Study (ANES) data — focuses on a series of direct racial attitude questions asking about respondents’ on a 0-to-100 scale their favorability ratings towards other races and ethnicities versus their own (White, Black, and Hispanic).

In addition, I focus exclusively on white respondents in the 2018 ANES. People of other races and ethnicities can, of course, be racist too. But for the sake of clarity, I target the segment in society most populous and historically most privileged.

Defining Racism in the 2018 ANES

How I define a ‘racist’ in this study is also straightforward. If the white respondent rated their race higher than another race or ethnicity (Black, Hispanic) by more than 10 scale points, they are coded as ‘racist.’ Some will argue that this definition is too harsh; while others might argue even a 1-point difference indicates something racist. That is a debate for another day.

Using my definition, there is one striking conclusion in the 2018 ANES data: Ethnocentric and racist attitudes are common among Americans — and no political party or ideology is immune from its presence.

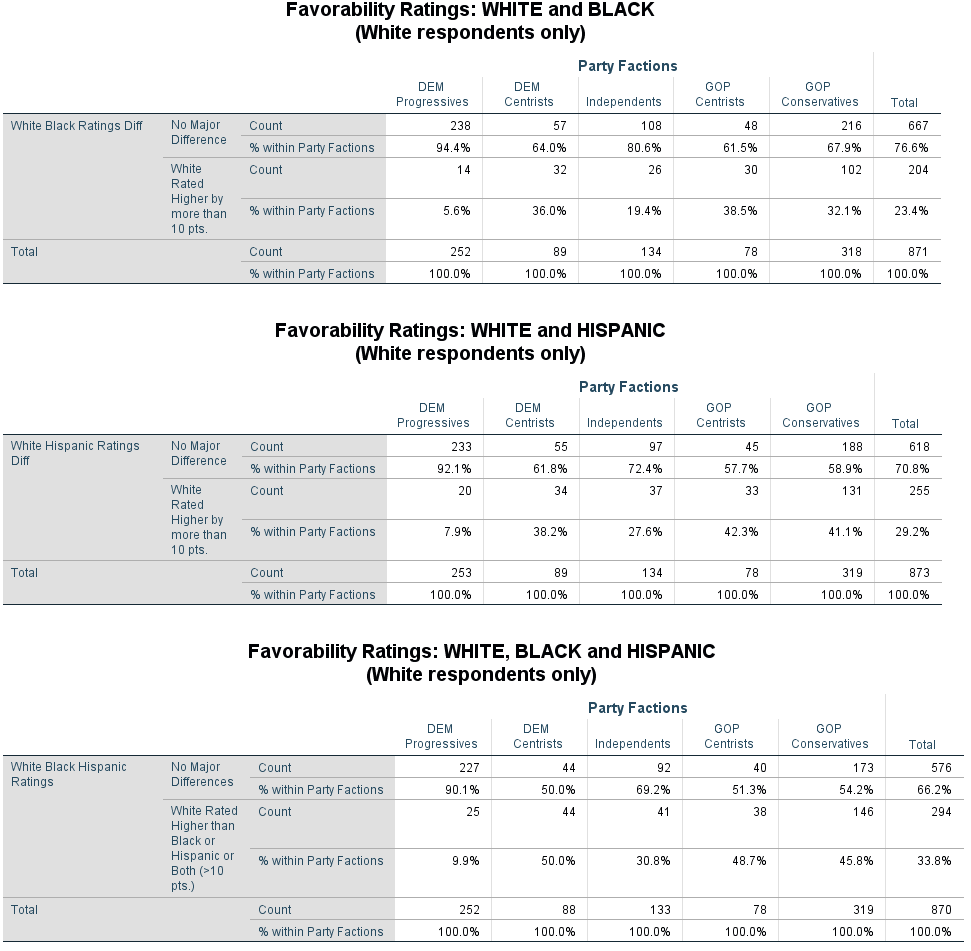
Among vote eligible white Americans, 34 percent favor their race over Blacks or Hispanics, or both (see the third table in Figure 1). Using the political faction segmentation from my previous essay, the highest presence of racial favoritism is among Democrat Centrists (50%), GOP Centrists (49%), and GOP Conservatives (46%). The lowest presence is among Democrat Progressives(10%) and Independents (31%).

Figure 1: Prevalence of racial favoritism among vote eligible white Americans

Data Source: 2018 American National Election Study (Pilot); Analysis and Segmentation by Kent R. Kroeger (results use weighted data to account for sampling design and response rate differentials)

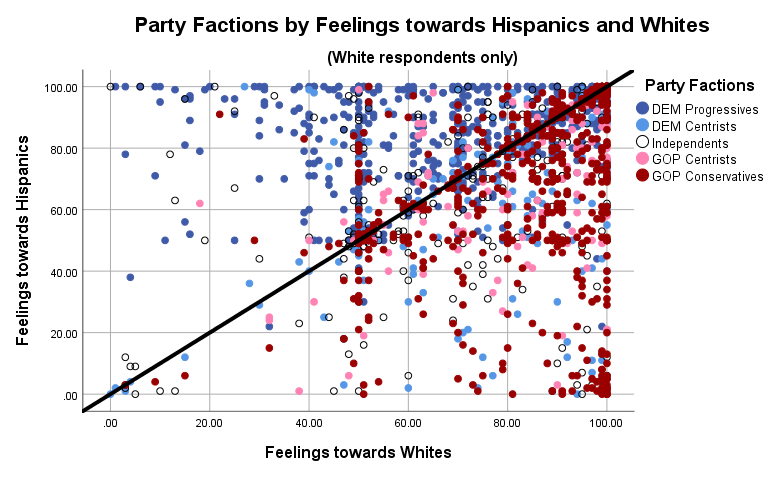
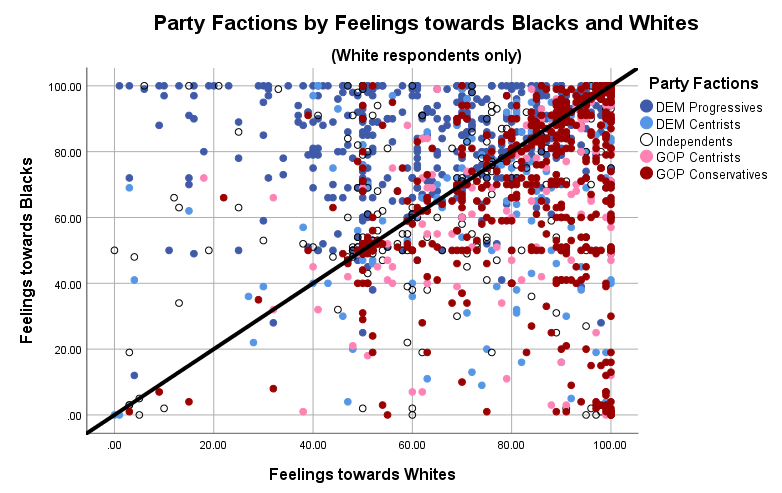
This racial bias can also be observed in Figures 2 and 3 which plot each respondent based on their favorability rating for white, Blacks and Hispanics. Figure 2 shows white and Black favorability scores and individual cases of racial bias are represented by dots below the diagonal line (i.e., white favorability is higher than black favorability). While most cases plot near the line, we see the obvious correlation between party factions and racial favorability. GOP Conservatives and Centrists are below the line and a high percentage are well below (10 points+) the line. Conversely, Democrat Progressives are mostly well above the line; while a sizable percentage Democrat Centrists appear on both sides.

Figure 2: Racial favorability ratings towards Blacks among vote eligible white Americans


Data Source: 2018 American National Election Study (Pilot); Analysis and Segmentation by Kent R. Kroeger (results use weighted data to account for sampling design and response rate differentials)

A very similar pattern emerges when comparing favorability ratings for whites and Hispanics (see Figure 3). Republicans are generally below the diagonal line, while Democrats are above the line.

Figure 3: Racial favorability ratings towards Hispanics among vote eligible white Americans


Data Source: 2018 American National Election Study (Pilot); Analysis and Segmentation by Kent R. Kroeger (results use weighted data to account for sampling design and response rate differentials)

Before Democrat Progressives start crowing about these findings, keep in mind that racial bias is only one noxious bias present in our society. There are many other types of biases: economic class, gender, sexual orientation, religious, geographic, age, education, political ideology and others. Rest assured, Democrat Progressives possess their fair share of socially corrosive biases. But that, as well, is a debate for another day.

Having established that racism, as defined here, is not uncommon among whites and that there is a political relationship to this bias, how might it relate to our current president, Donald Trump? Probably the least suspenseful question ever asked. But here we go…

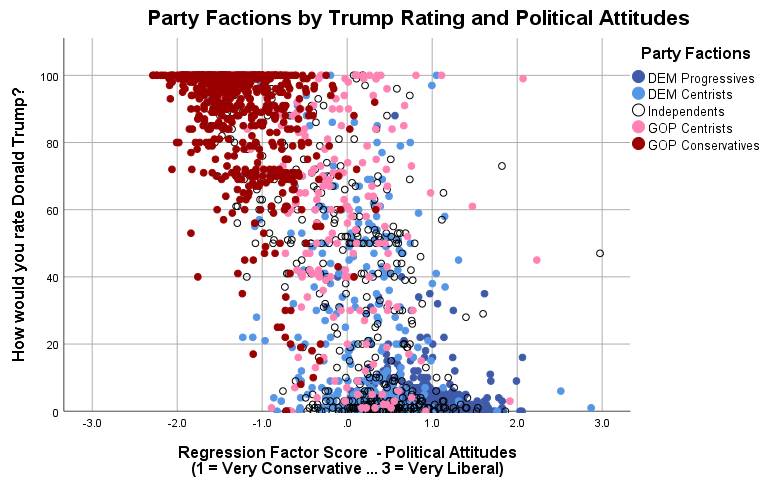
First, let us establish that feelings about President Trump are strongly related to political attitudes (and party factions). Figure 4 illuminates that relationship. Plotting political attitudes for all respondents in the 2018 ANES — based on a series of policy-related questions — against how respondents rate Donald Trump, we see a strong relationship.

Figure 4: Political attitudes and favorability towards Donald Trump (All 2018 ANES respondents)


Data Source: 2018 American National Election Study (Pilot); Analysis and Segmentation by Kent R. Kroeger (results use weighted data to account for sampling design and response rate differentials)


The bluish dots (Democrats) tend to rate Donald Trump low and are to the right along the political attitudes index (i.e., possess liberal political attitudes).

In contrast, the reddish dots tend towards the upper left-hand quadrant of the chart (i.e., rate Trump highly and have conservative political attitudes).

Interestingly, GOP and Democrat Centrists and Independents are sprinkled throughout the chart in Figure 4. There are a lot of them and their views on Trump don’t relate to partisan policy attitudes. I would call that a tactical opportunity for both parties heading into the 2020 election. But that is a topic for another essay.

Racist Attitudes and Feelings Towards Trump

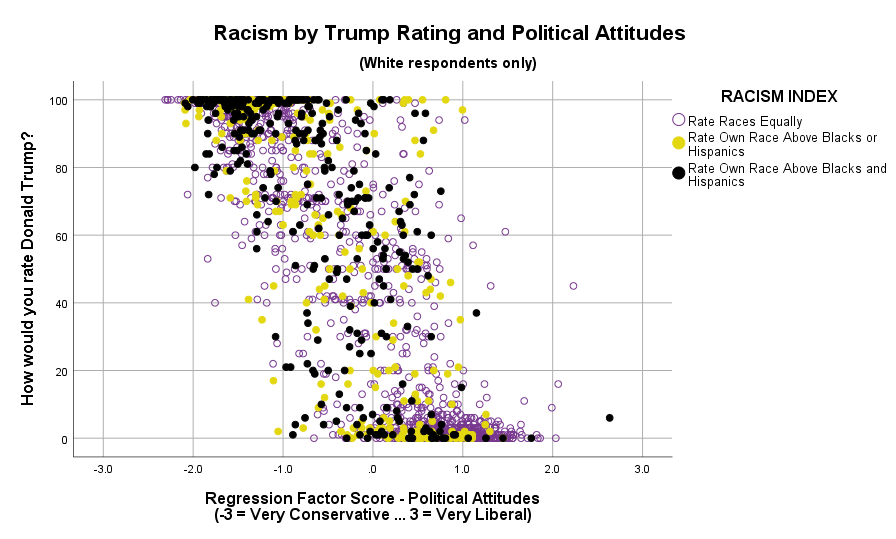
Based on this essay’s definition of a racist attitude, there is a clear (but not deterministic) relationship between racist attitudes and feelings regarding Trump and political attitudes (see Figure 5 below). Most, but not all, of the black and yellow dots (racists) are in the upper left-hand quadrant of the chart.

However, it is not an air tight relationship. The Kendall tau-b statistic of association for racist attitudes and feelings towards Trump is 0.21 (significant at the 0.01 level, two-tailed test), and with political attitudes it is only -0.19 (also statistically significant).

By comparison, feelings regarding Trump and party faction membership (DEM Progressive, DEM Centrist, Independent, GOP Centrist, GOP Conservative) generate a Kendall tau-b statistic of 0.70, indicating a much stronger relationship. Likewise, political attitudes and feelings towards Trump achieve a Kendall tau-b statistic of -0.65.

Figure 5: Political attitudes and favorability towards Donald Trump by racist attitudes


Data Source: 2018 American National Election Study (Pilot); Analysis and Segmentation by Kent R. Kroeger (results use weighted data to account for sampling design and response rate differentials)

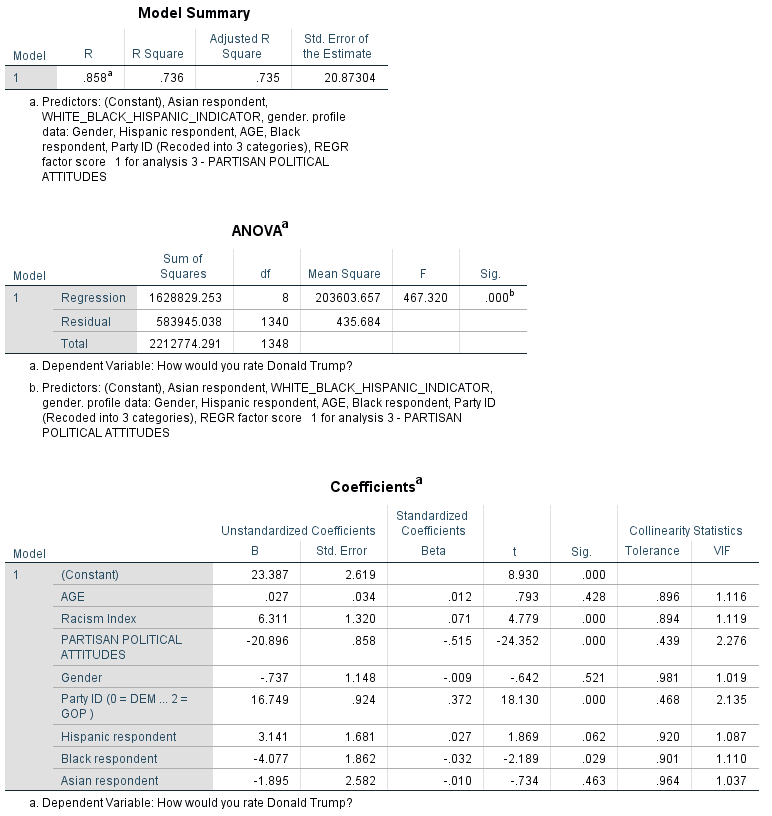
In a multiple regression model with controls for party identification, age, gender, and political attitudes, the racism index is a significant, independent predictor of feelings towards Trump. However, relative to political attitudes and party identification, the racism index is a minor contributor in explaining feelings towards Trump (see Appendix for the linear regression model summary output).

Implications

It is oddly refreshing that Americans appear willing to express their racial biases on a national opinion survey (even if it still may be an under representation of actual racial bias levels in the total population).

If our goal is to reduce all types of racism in this country — assume we can never eliminate it — a good start is creating an atmosphere where everyone feels comfortable talking about their own racial attitudes without fear of shaming and retribution.

German Lopez’ excellent article on Vox.com is a good place to start the process of generating ideas and strategies for reducing racism. As Lopez points out, there are ways to reduce racial bias, but “calling people racist isn’t one of them.” And that is pretty much the level of dialogue we are treated to on a daily basis on cable news channels and social media. Whatever the motives and intentions of these media lords, they aren’t working to reduce racial bias.

In his 1993 book, Race Matters, Harvard professor Dr. Cornel West argues we must first “understand that racism and race are woven in American history and can never be eradicated without understanding that race matters in everything we consider American.”

Knowing this, it is encouraging that Americans from all perspectives seem willing to share their attitudes and beliefs on race with survey researchers. Its a good start in the long process of creating a healthy environment conducive to racial understanding and acceptance.

  • K.R.K.

Data and SPSS computer codes available upon request to: kroeger98@yahoo.com


APPENDIX

Linear regression model for explaining ‘Feelings towards Trump’.

Data Source: 2018 American National Election Study (Pilot); Analysis and Segmentation by Kent R. Kroeger (results use weighted data to account for sampling design and response rate differentials)

Why much of what we think about the Democratic Party is wrong

__________________________________________________________________

This is the first essay in a series dedicated to analyzing the U.S. eligible-voter population using the 2018 American National Election Study (ANES), an online survey administered in Dec. 2018 by researchers from the Univ. of Michigan and Stanford Univ. 

__________________________________________________________________

By Kent R. Kroeger (Source: NuQum.com; March 8, 2019)

Most everything we know about the Democratic Party and its supporters may be wrong or distorted.

As an example, while New York Rep. Alexandria Ocasio-Cortez may be the fastest rising star in the party’s progressive wing, she is not representative of the typical progressive, at least not demographically.

Democratic Party progressives are more likely to be white, educated, wealthy and older, according to the 2018 American National Election Study (ANES).

Democrat centrists, in contrast, are more likely to be African-American or Hispanic, and are less educated, less wealthy and younger. In other words, on average, they look more like Ocasio-Cortez than Minnesota Senator Amy Klobuchar.

This common disconnect, frequently found in media narratives on the Democratic Party’s ideological divisions, stems from the news media’s bias towards covering elites, as opposed to actual voters. This essay will hopefully fill in some of the knowledge gaps arising from this pervasive bias.

Using data from the 2018 ANES, a survey administered by The University of Michigan and Stanford University in December 2018 to a nationally representative sample of eligible U.S. voters, the following analysis investigates the country’s major political fault lines and their potential impact on the 2020 election.

The eligible voter segments in the U.S.

Here is the biggest assumption circulating among political operatives and pundits today: The Democratic Party is deeply divided between a centrist, more free market-oriented faction, often associated with former Secretary of State Hillary Clinton and current Speaker of the House Nancy Pelosi, and a younger, more idealistic faction, represented by politicians such as Ocasio-Cortez, California Rep. Ro Khanna and Vermont Senator Bernie Sanders.

This description of Democrat partisans may work in describing divisions within Democratic elites, but says little about what is going on at the voter level.

Lets start with the issues that best defined the eligible voter segments…

A segmentation of U.S. eligible voters created from the issue-related questions in the 2018 ANES (see Appendix below for the question list) identified five population segments: Democrat Progressives (30% of eligible voters), Democrat Centrists (16%), Independents (19%), GOP Centrists (8%), and the GOP Base (27%). This segmentation clustered eligible voters based strictly on their opinions regarding a wide range of political, social and economic issues, including immigration, health care policy, income inequality, taxation, global warming, gun control, trade policy, and the opioid crisis.

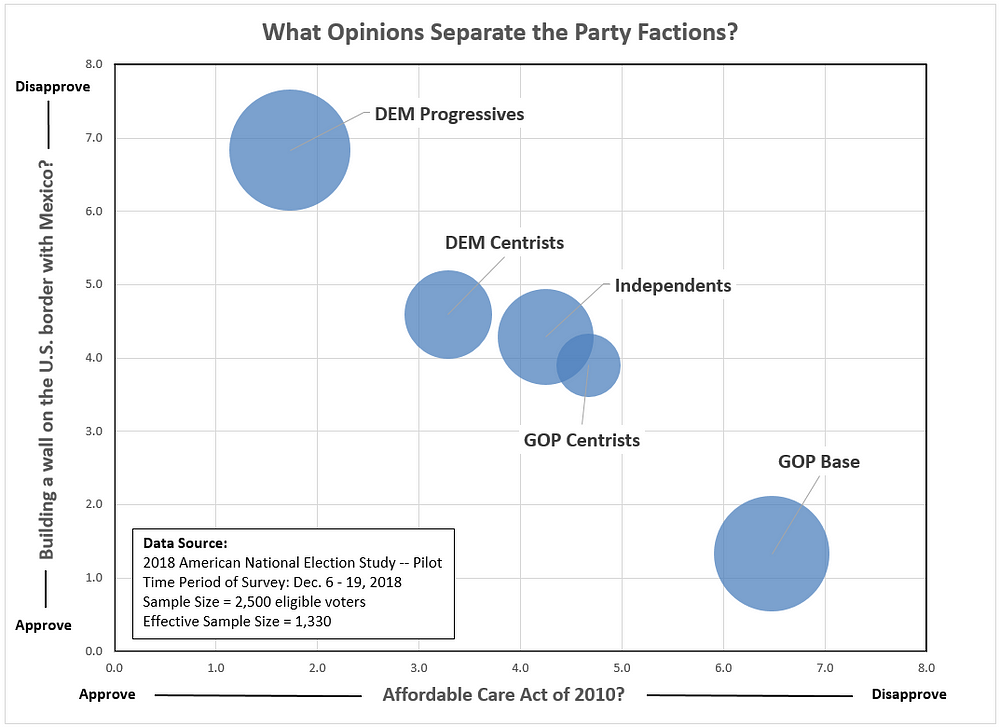
Two policy issues in particular distinguished Democrat Progressives from the GOP Base: attitudes on health care and immigration. More than any other eligible voter segment, Democrat Progressives support the Affordable Care Act of 2010 (ACA) and oppose Donald Trump’s border wall (see Figure 1 below). In stark opposition is the GOP Base, which stands alone in its support for the wall and opposition to the 2010 ACA. And in the middle are partisan Centrists and Independents, collectively representing 43 percent of eligible voters.

Figure 1: Attitudes on health care and immigration divide partisans


Data Source: 2018 American National Election Study (Pilot); Analytics and Segmentation by Kent R. Kroeger
Along with the isolation of the two party bases, the other noticeable feature from Figure 1 is the large political center — a proportion of the total population (43%) more than capable of tilting the advantage in one party’s favor during any given election. Any suggestion otherwise is rubbish. The center still matters. And, yes, they do vote — though not at the same rate as the strong political partisans.

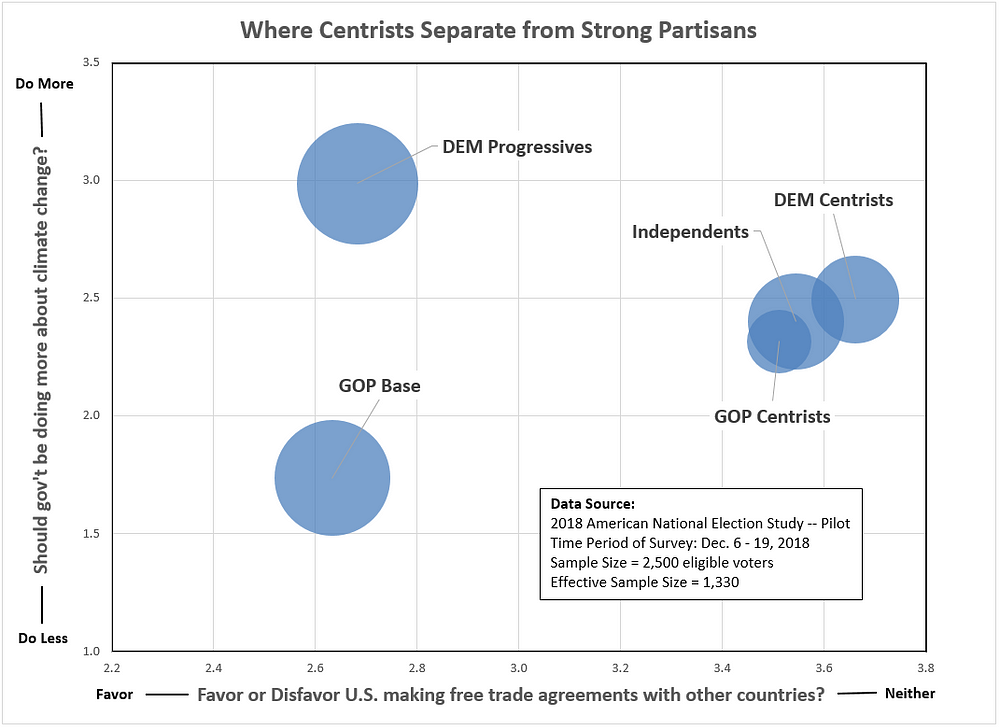
As Figure 2 shows, the party bases are highly divided on climate change as well. Almost every Democrat Progressive in the 2018 ANES said the U.S. should be doing more on climate change (99%), while only 13 percent of the GOP Base held the same view. In contrast, opinions on free trade agreements do not divide the party bases, where both generally support free trade (though they may have different approaches for getting there). It is the political center demonstrating the most skepticism on free trade agreements — which may be indicative of the center’s relative youth and economic vulnerability.

Figure 2: Attitudes on free trade and climate change


Data Source: 2018 American National Election Study (Pilot); Analytics and Segmentation by Kent R. Kroeger

Demographic differences across the eligible voter segments

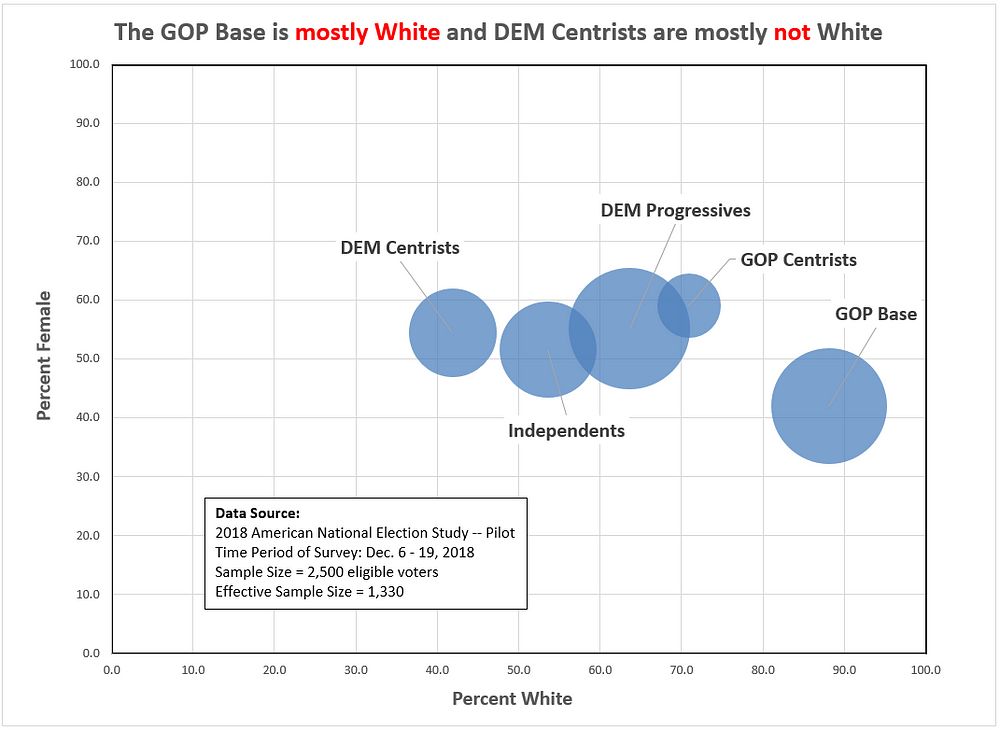
In some cases, the demographic variation in the eligible voter segments may elicit some surprise. But not when it comes to describing the GOP Base, whichstands alone as predominately white and male (see Figure 3). Every other segment is majority female, including GOP Centrists, where nearly 60 percent are female, a higher percentage than any other segment. In fact, GOP Centristsare predominately young, white females and represent, arguably, the party’s greatest strategic weakness heading into the 2020 campaign.

The most ethnically diverse segments are Democrat Centrists (30 percent African American, 22 percent Hispanic, and 5 percent Asian) and Independents (13 percent African American, 23 percent Hispanic and 6 percent Asian).

After the GOP BaseDemocrat Progressives and GOP Centrists are the least ethnically diverse.

Figure 3: Sex and race differences across the eligible voter segments


Data Source: 2018 American National Election Study (Pilot); Analytics and Segmentation by Kent R. Kroeger
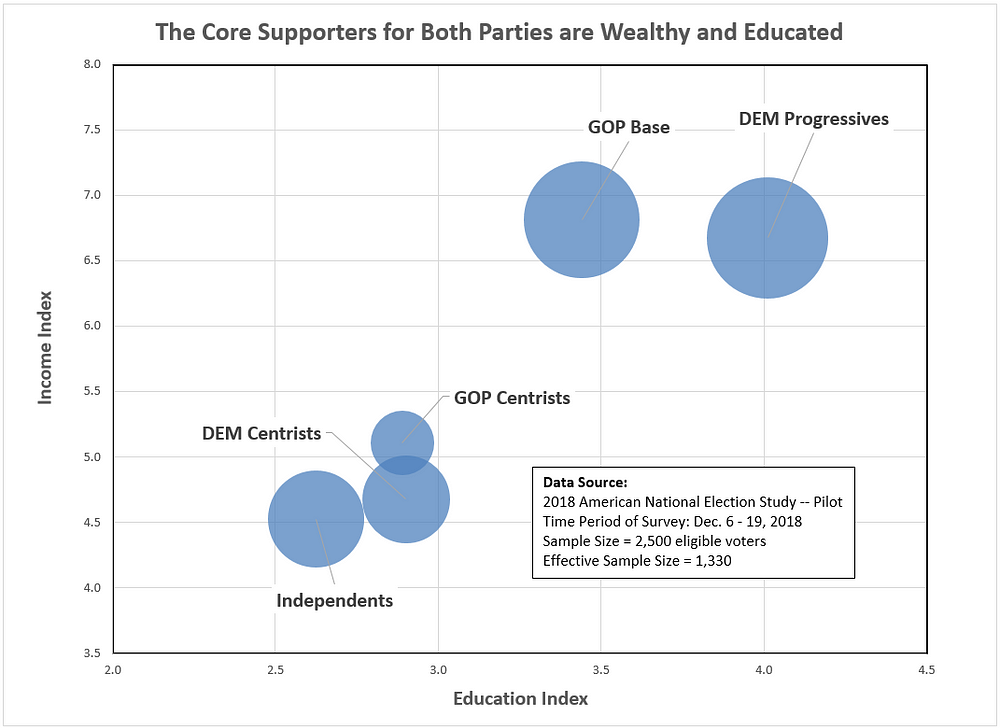
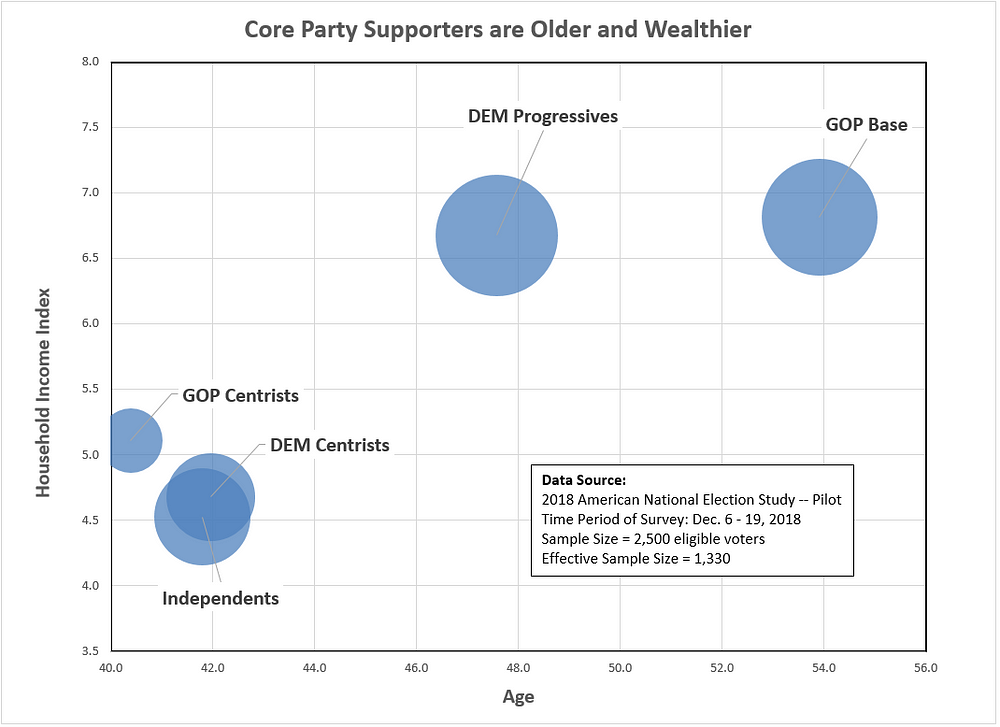
Indeed, a simplified description of Democrat Progressives might be to call them rich, middle-aged, educated, white people (see Figures 4 and 5). They are the second oldest and wealthiest segment, after the GOP Base, and the most  educated.

Centrists and Independents are equally distinctive in the other direction: poorer, younger and less educated.

Figure 4: Income and education differences across the eligible voter segments


Data Source: 2018 American National Election Study (Pilot); Analytics and Segmentation by Kent R. Kroeger
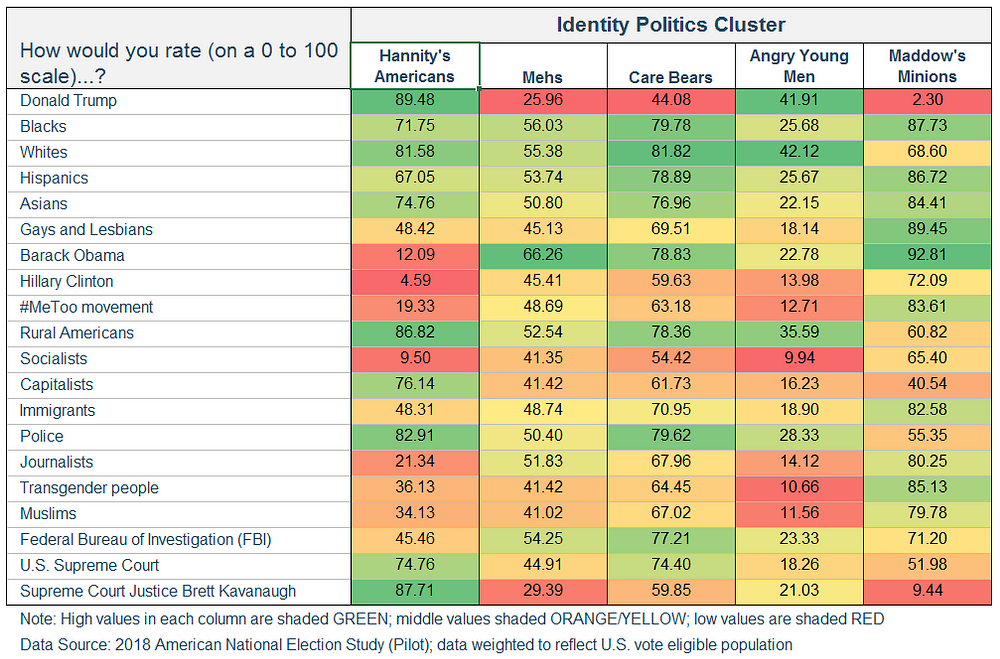
Figure 5: Income and age differences across the eligible voter segments


Data Source: 2018 American National Election Study (Pilot); Analytics and Segmentation by Kent R. Kroeger
That Centrists and Independents share these features should not be surprising, as younger and less educated voters tend to possess weaker partisan ties (which will increase as they age and become more educated and prosperous).

Of course, there are young activists who are highly partisan and they tend to be visible. But that is precisely why the bias persists in the media about millennials being ardent progressives. The average millennial, however, is not. Only 26 percent of millennials (30 years-old or younger) are Democrat Progressives. The majority are Centrists (29%) or Independents (24%).

Now for the big surprise…

Is Bernie Sanders’ viability driven by the Democratic Party’s far left?

The overwhelming assumption among political pundits is that Bernie Sanders remains competitive in the Democratic presidential nomination race because he is sustained by the Democratic Party’s far left.

This is not true. Not even a little bit true.

First, it is important to remind ourselves that a candidate’s policy positions does not necessarily reflect the opinions of a majority of their supporters.

And before you reply with — “Of course they do” — consider this:

As many Bernie Sanders supporters are…wait for it…Centrists and Independents (55% combined) as they are Democrat Progressives (44%)!

This is not news. If anything, he over-performs among Centrists and Independents. This has been known since the 2016 election. In part, this is driven by name recognition, particularly among Centrists, who tend not be as politically active or informed as Democratic Progressives.

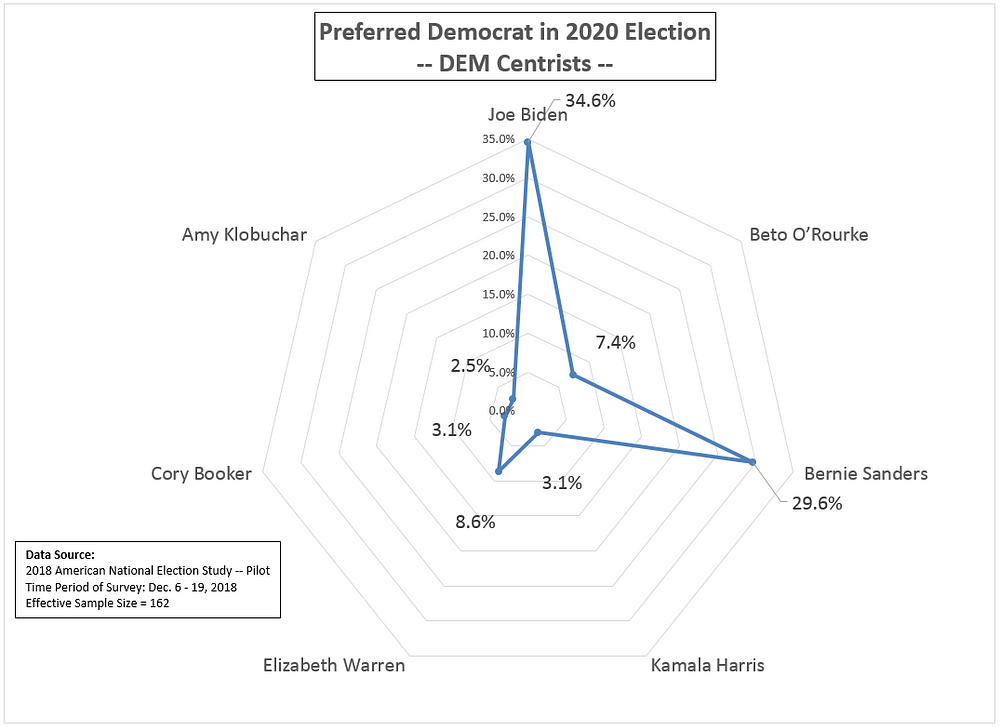
Within Democrat Progressives, Sanders polled third (17%), behind Joe Biden (30%) and Beto O’Rourke (21%) in the Dec. 2018 survey (see Figure 6). Among Democrat Centrists (see Figure 7), Sanders attracted 30 percent support (a statistically significant difference from his support among Democrat Progressives). Sanders, in fact, is tied with Biden among Independents intending to vote in a Democratic primary in 2020 (see Figure 8).

Figure 6: Preferred Democratic presidential nominee among Democrat Progressives 


Data Source: 2018 American National Election Study (Pilot); Analytics and Segmentation by Kent R. Kroeger
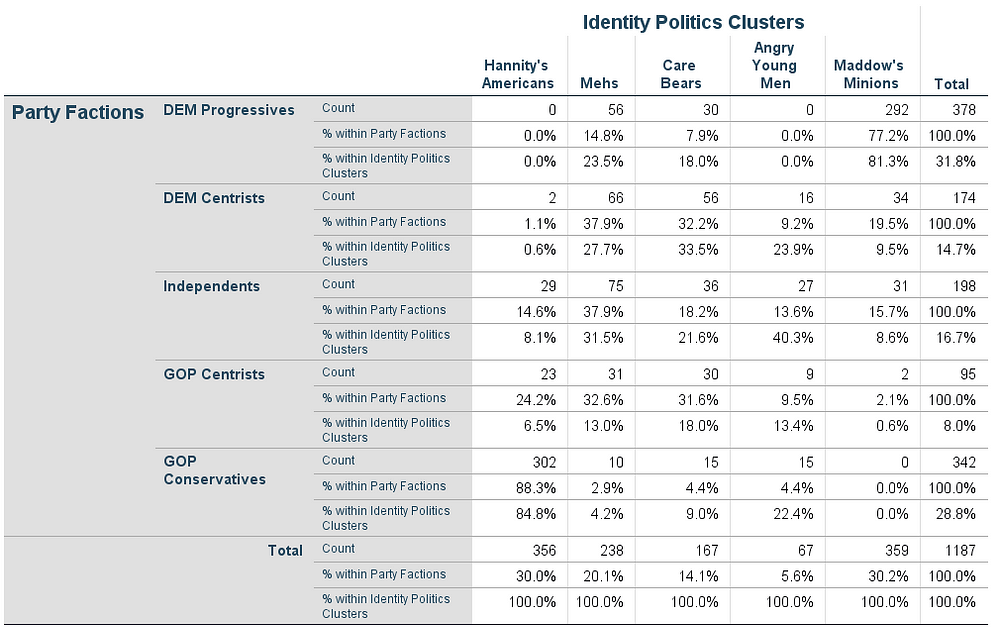
Figure 7: Preferred Democratic presidential nominee among Democrat Centrists


Data Source: 2018 American National Election Study (Pilot); Analytics and Segmentation by Kent R. Kroeger
Figure 8: Preferred Democratic presidential nominee among Independents


Data Source: 2018 American National Election Study (Pilot); Analytics and Segmentation by Kent R. Kroeger
Is it possible Bernie Sanders will pull Centrists and Independents towards the left as many continue to support him in 2020? An interesting question for a panel design study to investigate. Unfortunately, we can’t say that is true based on the cross-sectional data from the 2018 ANES.

However, we do see stark differences across the five segments in how they rate specific identity groups, movements and economic ideologies (see Figures 9 through 11). This patterns lends some credibility to the argument that Sanders’ attraction to Centrists and Independents up to now has been driven in part by his lower emphasis on identity group politics.

But this may be changing for the 2020 campaign based on Sanders’ recent candidacy announcement speech. If his stump speech emphasis does change, it will be interesting to see if Sanders-supporting Centrists and Independents align their views of various identity groups and movements with the party’s progressive wing. It seems odd to say this, but Sanders may lose his moderate base in the Democratic Party if he moves too far to the social issue left in the 2020 campaign.

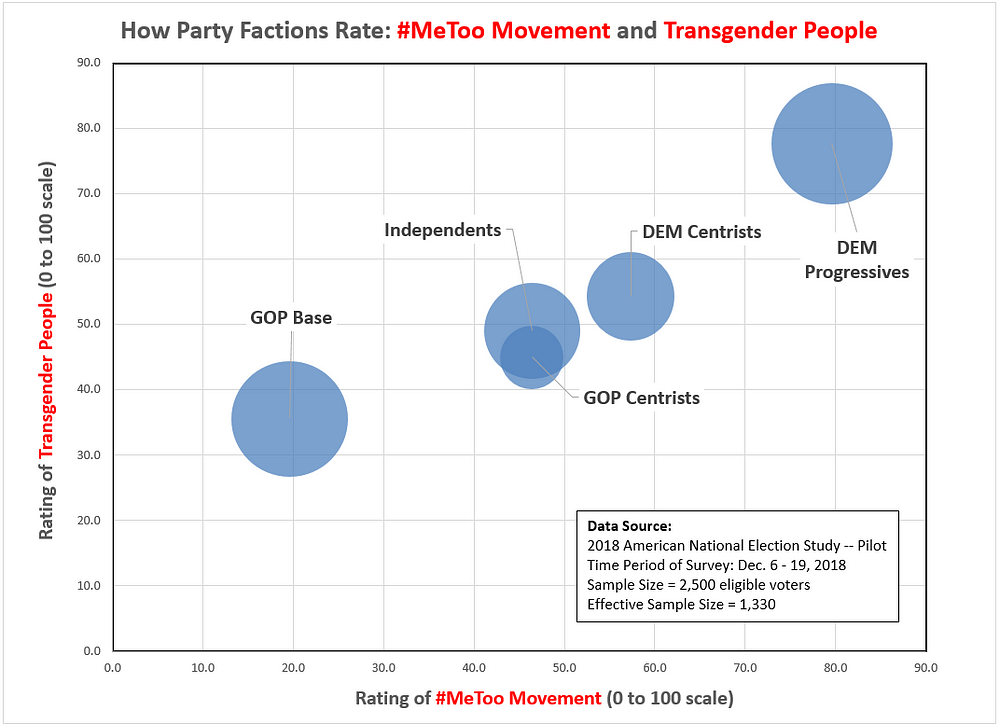
As of December 2018, Centrists and Independents have very different group affinities when compared to Democrat Progressives. For example, where, on average, Democrat Progressives rate the #MeToo movement as an 80 (on a 0 to 100 scale), Democrat Centrists rate it a 58 and Independents a 47 (see Figure 9). All statistically significant differences.

Figure 9: How factions rate the #MeToo movement and the Transgender


Data Source: 2018 American National Election Study (Pilot); Analytics and Segmentation by Kent R. Kroeger
A similar pattern exists for how the segments rate transgender Americans, the alt-Right movement, and antifa (see Figures 9 and 10).

Figure 10: How factions rate the alt-Right movement and antifa


Data Source: 2018 American National Election Study (Pilot); Analytics and Segmentation by Kent R. Kroeger
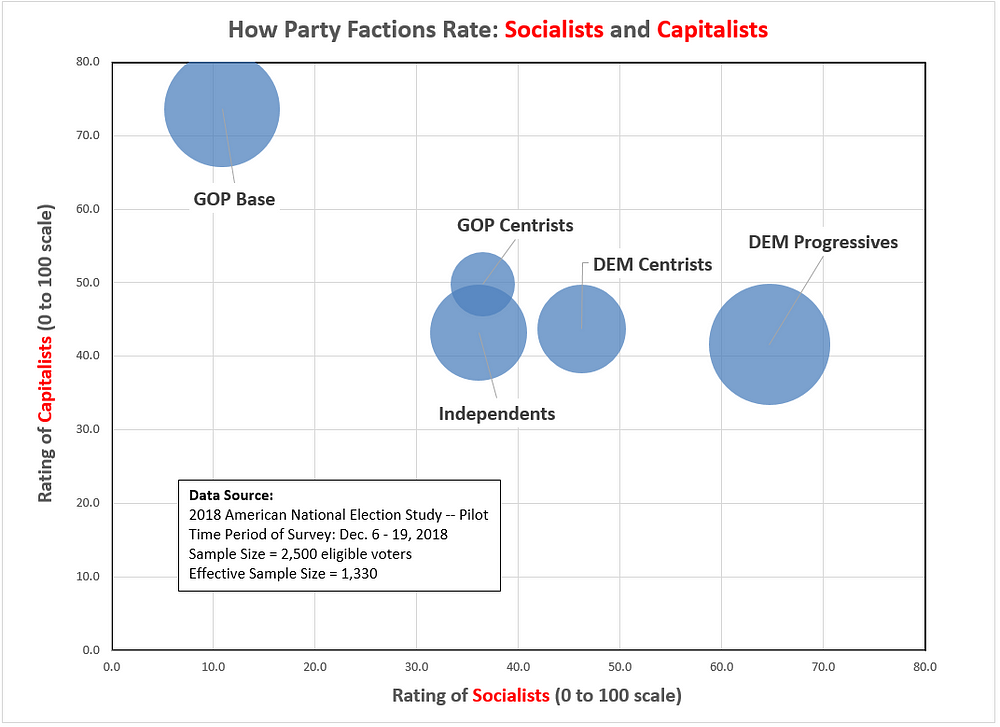
Finally, one of the more interesting relationships in the 2018 ANES data is how the segments rate socialists and capitalists (see Figure 11). All segments — less the GOP Base — rate capitalists below 50, on average. Whereas, ratings of socialists follow the more typical pattern, with Centrists and Independents coming somewhere near the midpoint between the GOP Base and Democrat Progressives. However, only the Democrat Progressives, on average, rate socialists above 50. Even Sanders’ Democrat Centrist supporters rate socialists below 50, on average.

Figure 11: How factions rate Socialists and Capitalists


Data Source: 2018 American National Election Study (Pilot); Analytics and Segmentation by Kent R. Kroeger
Final thoughts

If all we did was consume cable network news and mainstream print media for our political coverage, a biased picture of the American electorate might form. The news media sees a highly polarized American voting population — half still fuming over the 2016 election outcome — that has abandoned the political center for the more organized (and entertaining) partisan camps.

Politics has become even more tribal — or so we are told.

Unfortunately, this narrative falsely characterizes Americans’ political lives. The political center, while smaller than in the past, is alive and well and very relevant to electoral outcomes in this country. The 2018 ANES data finds at least 40 percent of eligible voters somewhere in the political middle.

Still, this faulty chronicle laid out daily for Americans is not borne from a news media wanting to misrepresent reality, but from the market’s demand for engaging, consistent narratives — often lazy and inaccurate in practice — repeated over time in pursuit of larger audiences. And larger audiences increase ad revenues which increase the probability of higher profits.

Its not a crime. Its all good capitalism.

Nowhere is this bias more apparent than how the news media covers the Democratic Party. The narrative goes something like this: The young, progressive left — represented by Ocasio-Cortez’ youthful arrogance and Sanders’ relatable (but dreamy) brand of socialism — versus the sober party centrists like Nancy Pelosi, Hillary Clinton, Joe Biden and Chuck Schumer, who put an emphasis on ‘getting things done.’

Progressives equate to dynamic and creative. Centrists equate to steady and pragmatic. The narrative is not completely wrong — but it is dangerously misleading given what we know about voters and how well they align with this narrative.

Most progressives in the Democratic Party don’t look like Ocasio-Cortez. They are white, middle-aged, (over) educated, and relatively wealthy. And, as for Sanders’ ongoing quixotic quest for the presidency, if it is to succeed, it will be built as much around the Democratic Party’s centrist wing as it will around its progressive wing.

That is not the story we are generally hearing in the news media. And don’t expect to hear it anytime soon.

  • K.R.K.

Data and SPSS computer codes are available upon request to: kroeger98@yahoo.com


APPENDIX:

In developing the segmentation of eligible voters in the 2018 ANES, I used SPSS’ proprietary TwoStep clustering algorithm.

The SPSS TwoStep clustering procedure can handle both continuous and categorical variables by extending the model-based distance measure used by Banfield and Raftery (1993) and utilizes a two-step clustering approach similar to BIRCH (Zhang et al. 1996).

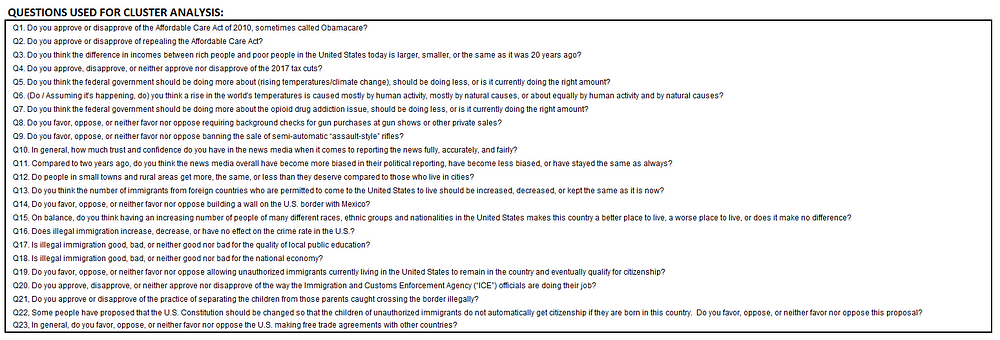
Below is the list of 2018 ANES questions used to create the eligible voter segmentation:

All variables were treated as continuous variables and standardized within the two-step clustering procedure.

Jeffrey Sachs May Have Exposed the Green New Deal’s Biggest Deception

By Kent R. Kroeger (Source: NuQum.com; March 1, 2019)

Professor Jeffrey Sachs, director of the Center for Sustainable Development at Columbia University, thought he was supporting the Green New Deal with his February 22nd editorial published on CNN.com.

And he was.

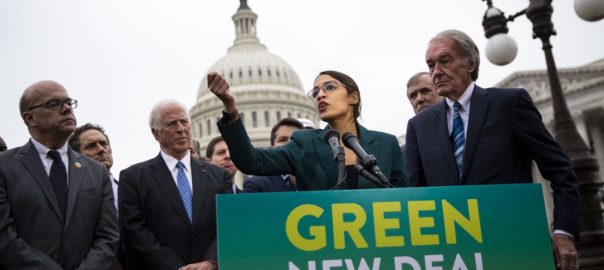
But he may have also exposed the Green New Deal’s greatest deception: the belief among its advocates — New York Rep. Alexandria Ocasio-Cortez being the most prominent — that addressing climate change will require significant federal budget line item expenditures.

Decarbonizing the U.S. economy is this generation’s ‘moon shot’, says Ocasio-Cortez.

But what exactly will the federal government spend money on to decarbonize the country?

Our decarbonization efforts so far have not relied heavily on government programs. Why should this be different in the future?

In an essay designed to remove the myths surrounding the Green New Deal’s likely budgetary requirements, Sachs proceeds to answer that question…and the answer may or may not be what climate activists want to hear.

Writes Sachs:

“Decarbonization is already underway in the US, just not yet with the pace and scale required. US utilities are no longer building coal-fired power plants; many are now scrapping plans for gas-fired plants in favor of renewable energy. Investors and in-house lawyers are warning companies not to invest in fossil fuels, as these investments would be stranded in future years. Automobile companies are rapidly shifting to electric vehicles. New buildings are going electric, with tough efficiency codes. These transformations are being driven mainly by environmental regulations, integrated resource planning by utilities, and market forces, not by federal outlays.”

The significance of Sachs’ last sentence cannot be exaggerated. Regulations, building codes, resource planning, and market forces are transforming the U.S. from a carbon-based to a clean energy-based economy.

And this conversion is moving extraordinarily fast without any significant federal programs or massive investments up to now. Furthermore, as per kilowatt costs for renewable energy continue to decline, this conversion will accelerate as old coal plants are shut down and renewable generation plants are put online.

There is no future for coal in the electricity business, and the prospects for gasoline-powered combustion engines aren’t any brighter, according to Bloomberg NEF, a leading provider of primary research on clean energy.

Bloomberg NEF forecasts that, by 2040, 55 percent of all new car sales worldwide and 33 percent of the global fleet will be electric vehicles (EVs). Pushing the momentum in favor of EVs is the fact that “the upfront cost of EVs will become competitive on an unsubsidized basis starting in 2024; by 2029, almost all segments reach parity as battery prices continue to fall,” according to Bloomberg NEF.

The bulk of this progress on clean energy did not require trillions of dollars in federal outlays. To the contrary, Barack Obama’s administration failed to pass any carbon tax legislation and was forced to rely on the executive branch’s regulatory and rule-making authorities in order to achieve its green energy goals.

In ending coal’s long term relevance, the Obama administration was surprisingly successful in addressing climate change considering it had little support from the legislative branch. Even with the Trump administration’s pro-coal stance, which has led to the relaxing of Obama-era environmental regulations and has encouraged more domestic oil and natural gas production, there is no concerted effort to build new coal plants.

Not Even Donald Trump Can Stop the Green Energy Revolution

While climate change activists are dismayed at the significant increase in U.S. oil and natural gas production in the past 10 years, powering this surge has been a realization within the oil industry that the days of oil and gas will end someday. Extract the oil and gas now while there is still a market for it.

British Petroleum’s chief economist, Spencer Dale, admitted last year that the “speed of the transition underway” now in the energy industry has been a surprise. In particular, India and China have developed solar power at much faster pace than BP expected.

“The continuing rapid growth of renewables is leading to the most diversified fuel mix ever seen,” says BP group chief executive Bob Dudley. That is oil industry speak for, “Yeah, we’re concerned.”

The green energy revolution is unstoppable according to many energy analysts and forecasters. “The evidence certainly suggests that renewables have won and a low-carbon future is all but inevitable,” says Kevin Haley of the Renewable Energy Buyers Alliance.

So why the panic by Ocasio-Cortez and other climate change activists?

Two reasons.

First, the Trump administration’s hostility towards addressing climate change has spurred activists into action to a degree a sympathetic administration might not have inspired. Add to that when the Intergovernmental Panel on Climate Change’s warned that the planet had until 2030 to transition to clean energy to avoid global warming’s worst consequences, the activist community found the perfect storm for generating a massive call to action.

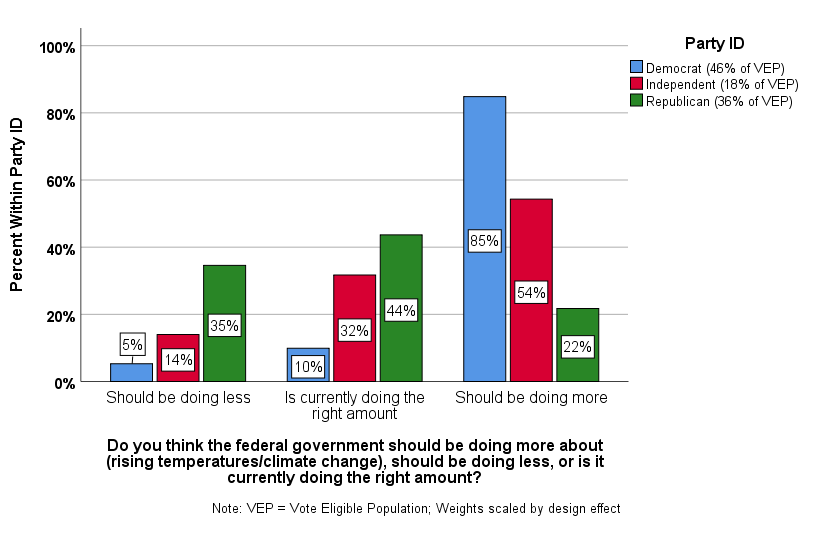
Second, and more importantly, climate change is a highly partisan issue where the Democrats have a clear majority on their side (see Figure 1). The political center is with the Democrats.

According to the American National Election Study (December 2018), 85 percent of Democrats believe the federal government should be doing more on climate change. This represents 39 percent of the total voter eligible population (VEP). But even among ‘independents’ — that do not lean ‘Democrat’ or ‘Republican’ — 54 percent want the government to do more on climate change. That’s another 9 percent of the VEP, combined with Democrats, the percent of the population open to more government action on climate change comes in at 55 percent. If climate change is an important issue to voters when they enter the voting booth in 2020, the Democrats will be in great shape.

Figure 1: Opinions on the Federal Government’s Action on Climate Change (by Party Identification)

Source: American National Election Study (December 2018)

Addressing Climate Change Is Nothing Like the Apollo Moon Program in the 1960s

When Ocasio-Cortez compared the Green New Deal to the U.S. moon program of the 1960s, it was a tremendous disservice to the climate change movement as it leaves the public with a flawed understanding of what will be involved in fighting climate change. The moon landing required a government-centric approach as there was no commercial, private sector motive to go there. Combating climate change, in contrast, will be led by the private sector given phenomenon’s potentially radical impact on the world economy. That is the basic implication of Sachs’ article.

While not zero, the federal government’s role is going to be comparatively small.

Mandates to install heat pumps into new buildings and retro-fitting them into existing buildings is a cost borne largely by the private sector. Ditto for the shuttering of coal plants and replacing them with renewable and clean energy alternatives. Market forces offer the incentives to retool auto plants to manufacture EVs and to build out a national charging station infrastructure that will phase out gasoline combustion engines by around 2050. If we believe the forecasts being generated by Wall Street and automotive industry analysts, it is in the short-term where the government can be most impactful.

“EVs still suffer from a high-cost barrier…and cutting costs will take time,” according to automotive analyst Joshua Gordon. “Therefore as a stop gap, the government can help encourage EV adoption through a selection of incentive programs.”

But that is a transitory federal budget line item.

Other areas where the federal budget will be impacted is in disaster management, research funding, and the updating of the nation’s power grid infrastructure.

And even those expenses can be defrayed through a modest carbon tax, if such a tax could ever be passed in today’s political environment.

On that suggestion, I offer an apology to Modern Monetary Theory (MMT) devotees for my thinking new spending must have an equivalent funding mechanism. Old habits die hard. But even if MMT becomes the accepted economic paradigm and we stop judging government spending by its impact on the deficit, the theory is still not a license to piss federal budget money down a rabbit hole.

The argument for government spending must always be rooted in its social and economic sense, and so it will be for addressing climate change.

Economists and investors generally agree that countries that are the ‘first movers’ on climate change will benefit the most economically in the long-term.

“Global leadership in many new technologies is still up for grabs, and early movers can establish footholds in strongly growing markets,” contend Jens Burchardt, Philipp Gerbert, Stefan Schönberger, Patrick Herhold, and Christophe Brognaux from the BCG Henderson Institute, a business strategy consultancy firm based in Boston, MA. “Given these benefits, policymakers should develop economically optimized (greenhouse gas) mitigation agendas and implement thoughtful policies that incentivize companies (and individuals) to act and help them overcome the investment hurdle.”

Such is mainstream investor thinking on how companies and governments should address climate change, which is in contrast to Ocasio-Cortez’ “maybe we should rethink having children” musings on the topic.

Chicken Little-caliber analyses of the risks associated with climate change are counterproductive. As long as the private sector continues to do what is has been doing on greenhouse gas mitigation and the government remains supportive, the sky won’t be falling. Rather, opportunity will be rising.

That is the tenor of Sachs’ CNN article — even if he wouldn’t quite summarize it that way.

Therefore, the best thing the federal government can do to address climate change is to continue to let market forces lead the transformation to a clean energy economy and to offer assistance when gaps need to be filled.

  • K.R.K.

Data available by request to: kroeger98@yahoo.com