__________________________________________________________________
This is the fourth essay in a series dedicated to analyzing the U.S. eligible-voter population using the 2018 American National Election Study (ANES), an online survey administered in Dec. 2018 by researchers from the Univ. of Michigan & Stanford Univ.
__________________________________________________________________
By Kent R. Kroeger (Source: NuQum.com; March 19, 2019
According to an analysis of the 2018 ANES, Progressive Democrats represent roughly one-third of the American eligible-voter population and two-thirds of all Democrats; and, by some accounts, are the ‘center of gravity’ in American politics today.
But the progressives have a problem. A big problem, if they want to win back the presidency in 2020.
Progressive Democrats are deeply divided. That is does not sound like a breaking news story to anyone that has followed politics in the last two years.
But the usual media narrative goes something like this: Establishment Democrats, centrist and pragmatic in nature, are being pulled (presumably against their better judgment) to the far left by their progressive counterparts in the party.
This narrative often gets confounded with the notion of a progressive versus centrist divide where the party establishment is generally linked to the centristfaction. However, as discussed in a previous essay, when we look at the attitudes of actual voters, the Democratic Party’s establishment wing — often represented among politicians by Nancy Pelosi, Chuck Schumer, Tom Perez, Joe Biden, Kamala Harris, etc. — is a much better match with the progressive voters in the party, not the centrists. Democrat-leaning centrists are decidedly more conservative than their progressive counterparts on abortion and LGBTQ rights, climate change, immigration policy and a whole host of other core issues that tend to define the mainstream of the Democratic Party.
When we talk to flesh and blood human beings, not politicians, the mainstream Democratic Party voter is progressive, not centrist — and the party’s establishment, on most issues, stands squarely with the progressive mainstream.
But this is where it gets tricky and where the political media often gets it wrong when they discuss progressive Democrats.
Labeling someone a ‘progressive Democrat’ is not analytically useful unless you are identifying a specific type of ‘progressive Democrat.’ But the progressive types are not related to variation in policy attitudes (as we might assume). The Progressive Democrats (identified in my earlier segmentation analysis of the 2018 ANES) share, by construction, similar views on: abortion rights, LGBTQ rights, health care policy, gender equality, immigration, social spending, climate change, and racial discrimination (see Figure A.1 in the Appendix).
In my subsequent drill-down into Progressive Democrats (using a K-means clustering algorithm) I find three distinct subgroups based on respondents’ personal orientations and emotional attachments to common elements found in the political world (i.e., groups, identities, individuals, etc.). And further analysis finds these differences to be associated with substantive variation on candidate preferences.
The Three Progressive Segments
Formed from the relative differences respondents’ group affinities, three distinct segments emerge within Progressive Democrats (see Figures 1 through 5 for attitudinal differences between the segments):
Establishment Progressives (45% of all progressive Democrats): Relative to the other two segments, these are progressives with strong affinities towards racial and ethnic groups, the LGBTQ community, the police, capitalists, Hillary Clinton, Special Counsel Robert Mueller, and the FBI.
Paycheck Progressives (32% of all progressive Democrats): Again, relative to the other segments, these are progressives with lower affinities towards racial and ethnic groups, immigrants, the LGBTQ community, Hillary Clinton and the #MeToo movement.
Justice Progressives (23% of all progressive Democrats): And, finally, these progressives show strong relative affinities towards racial and ethnic groups (except whites), the LGBTQ community, the #MeToo movement, immigrants, socialists, but low affinities towards whites, capitalists, rural Americans, journalists, the police, the FBI, Special Counsel Robert Mueller, Hillary Clinton, and the U.S. Supreme Court.
Figure 1: Group Affinities by Progressive Democrats Segment (0 to 100 thermometer scale, where high values indicate strong positive feelings)
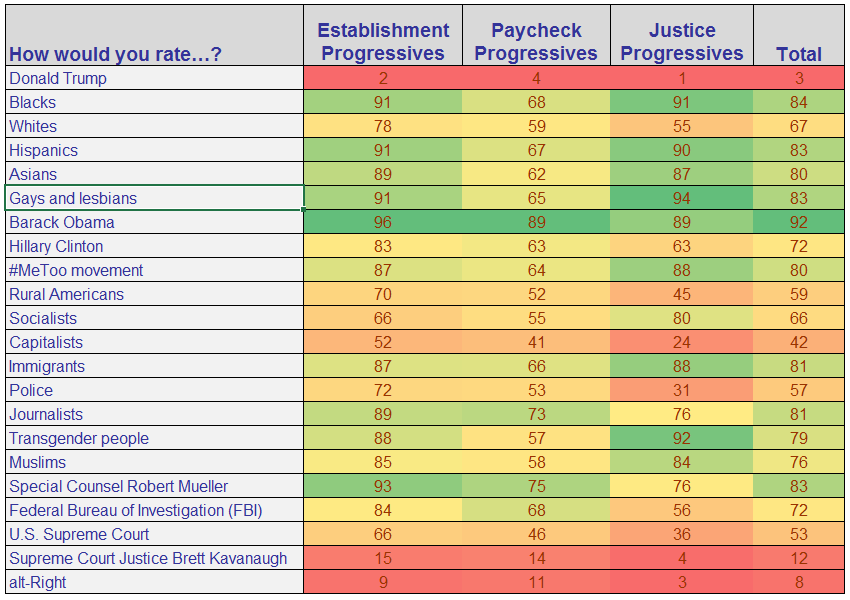
Data Source: 2018 American National Election Study (Pilot); Analytics and Segmentation by Kent R. Kroeger
Figure 2: Group Affinities towards Economic Philosophies
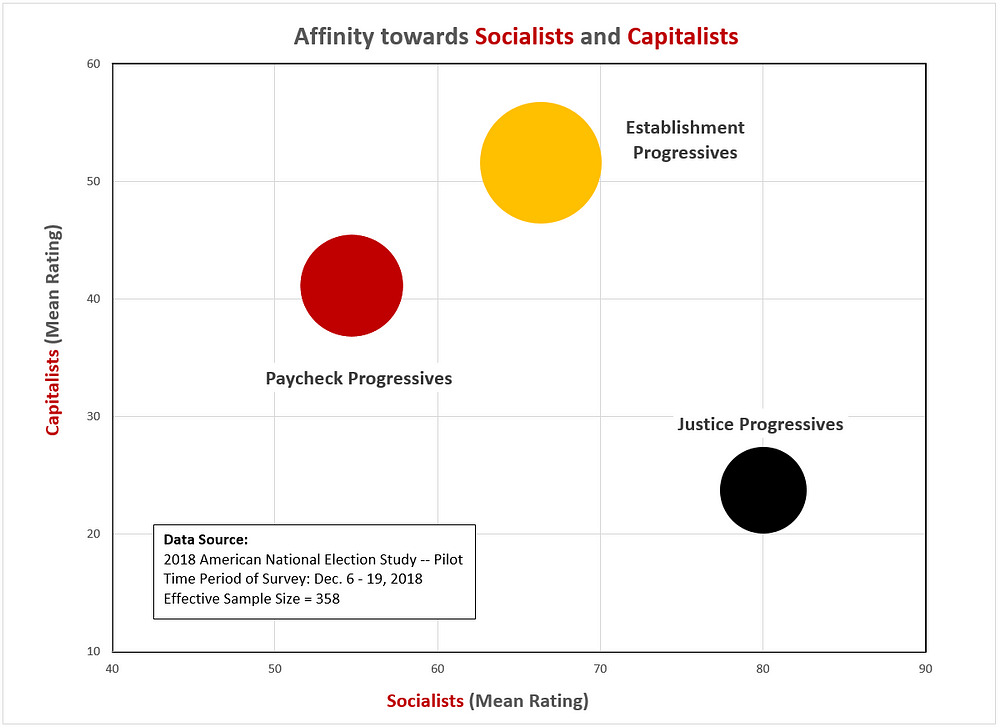
Figure 3: Group Affinities towards the LGBTQ community

Figure 4: Group Affinities towards the #MeToo Movement and Immigrants

Figure 5: Group Affinities towards Racial Groups
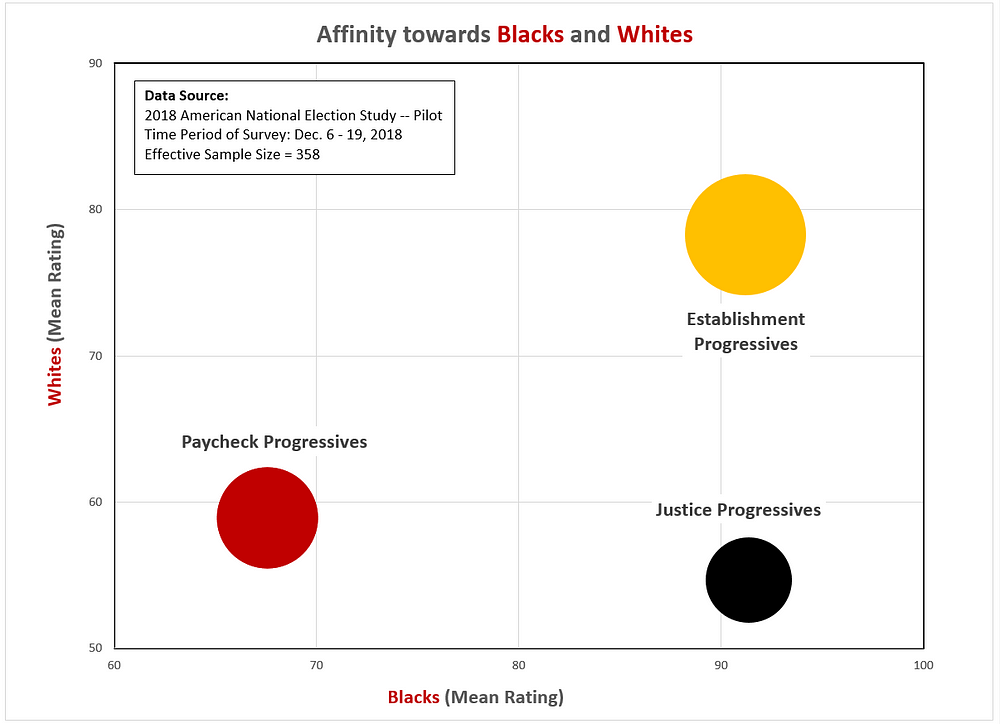
Data Source for Figures 2 through 5: 2018 American National Election Study (Pilot); Analytics and Segmentation by Kent R. Kroeger
Naming the Segments
By construction, the three segments differ in their orientation towards various people and social groups, but they also differ in terms of demographics and behavior.
The most apparent difference is age (see Figure 6). Justice Progressives are the youngest segment (mean age = 38), followed by Paycheck Progressives(mean age = 46), and the Establishment Progressives (mean age = 54).
Figure 6: Age Distributions 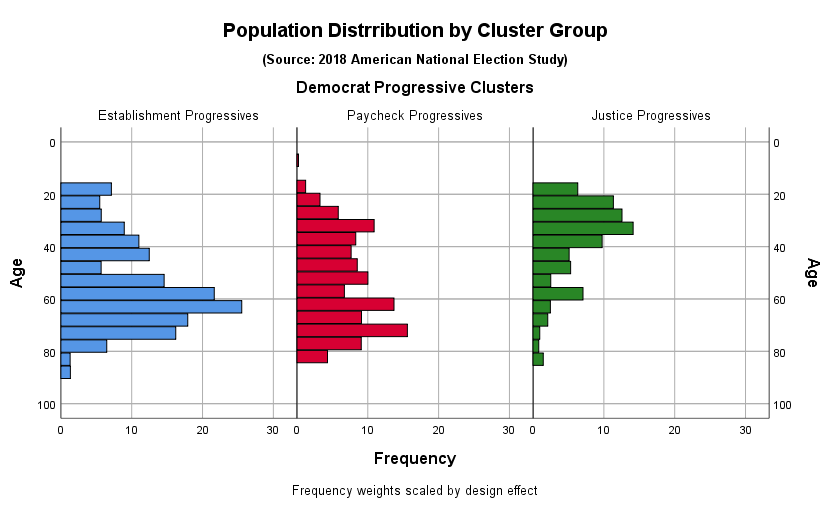
Data Source: 2018 American National Election Study (Pilot); Analytics and Segmentation by Kent R. Kroeger
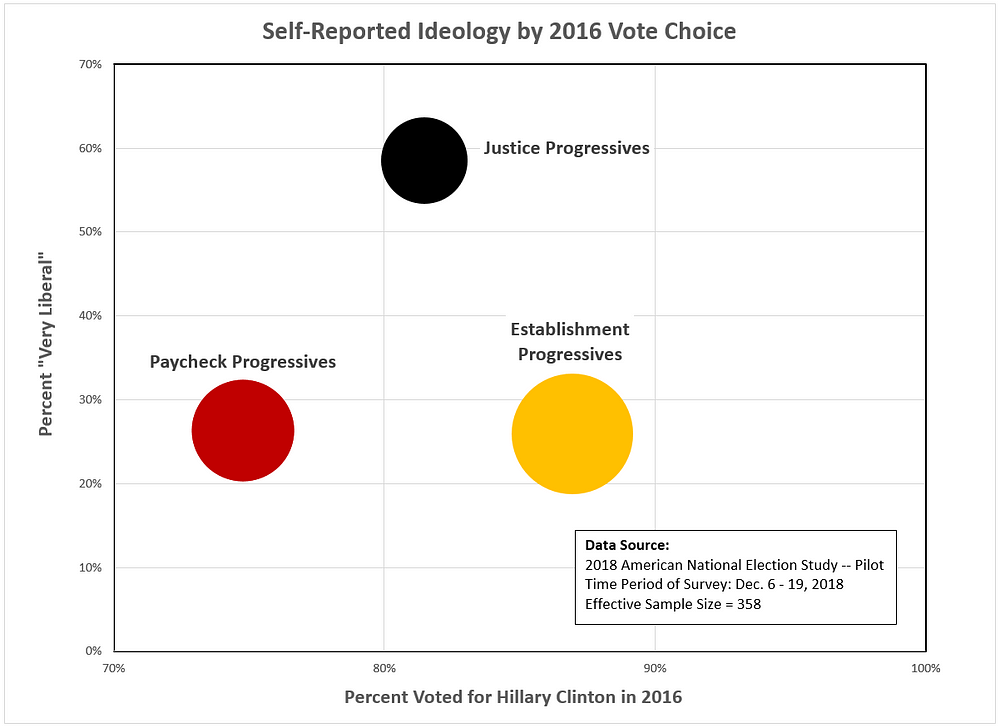
Another factor separating the progressive segments is self-reported ideology. Justice Progressives are most likely to call themselves ‘‘very liberal’ (59%), while Paycheck Progressives and Establishment Progressives are most likely to call themselves ‘somewhat liberal’ or ‘moderate’ (71% and 70%, respectively).
In a multinomial logistic regression analysis, age and self-reported ideology proved to be the most significant predictors of membership in the three progressive segments. Those relationships are evident in Figure 7, particularly in how those factors distinguish Justice Progressives from the other two segments.
Figure 7: Progressive segments by Age and Self-Reported Ideology
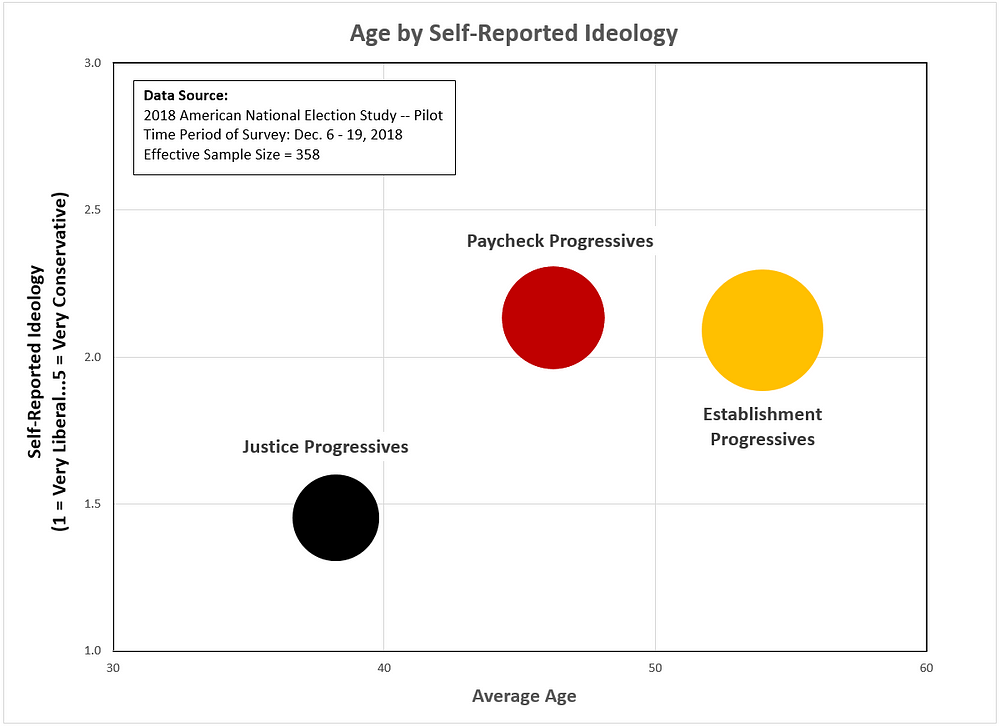
Data Source: 2018 American National Election Study (Pilot); Analytics and Segmentation by Kent R. Kroeger
Gender, age, education, life-stage, and group affinities were central to the naming of the three progressive segments (Figures 8 and 9 show how gender, education, and religious affiliation differentiate the segments). Notably, differences in racial and ethnic characteristics are not statistically significant across the three segments (though, directionally, the Justice Progressives do appear to be more racially and ethnically diverse).
Segment Descriptions
Establishment Progressives tend to be female, older, wealthier, pro-capitalism, and very tuned in to the Robert Mueller investigation. Paycheck Progressives tend to be male, middle-aged, married (with children) and at a point in their life when they are more likely to be concerned about a mortgage payment than identity politics or the Mueller investigation. Finally, Justice Progressives are the prototypical image of progressives offered by the media: female, young, highly-educated, non-religious, anti-capitalist, and more concerned about ‘white privilege’ and identity politics than the Mueller investigation.
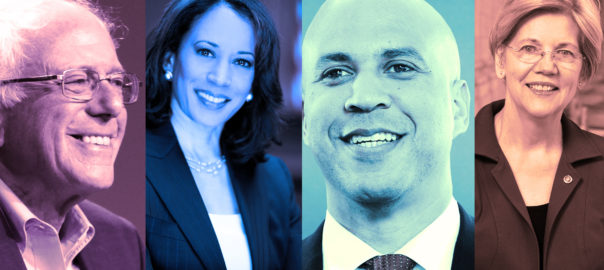
If it helps to put faces on the segments, Establishment Progressives might be represented by Hillary Clinton and Nancy Pelosi, Paycheck Progressives by Joe Biden and New Jersey Senator Cory Booker (admittedly, rough fits here), and Justice Progressives by New York Representative Alexandria Ocasio-Cortez and California Representative Ro Khanna.
Figure 8: Progressive segments by Gender and Education
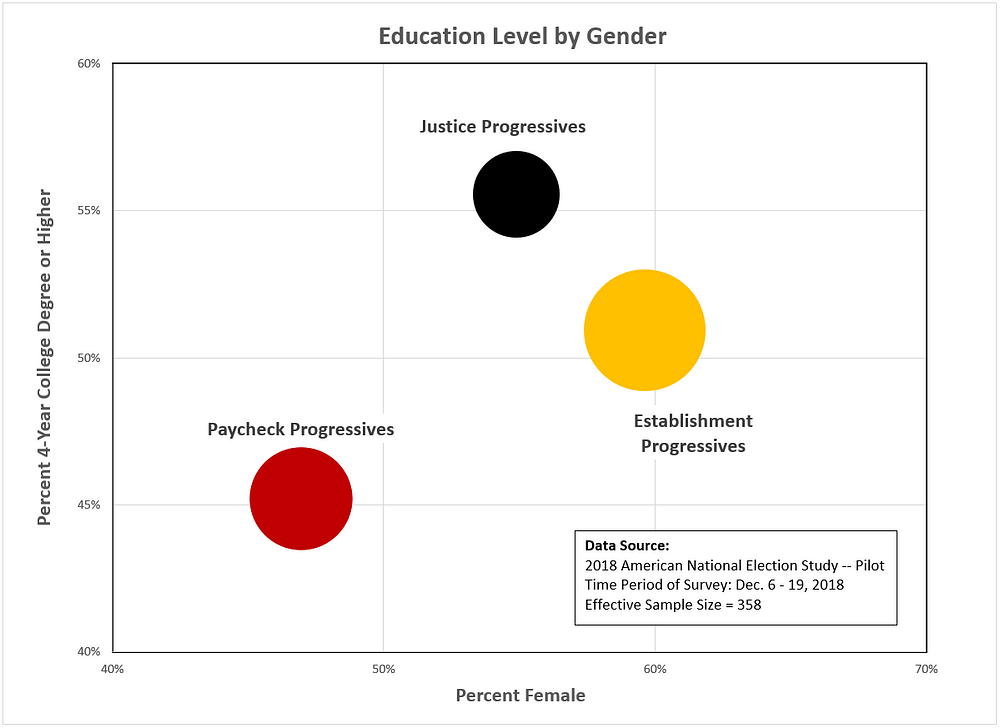
Figure 9: Progressive segments by Religious Affiliation
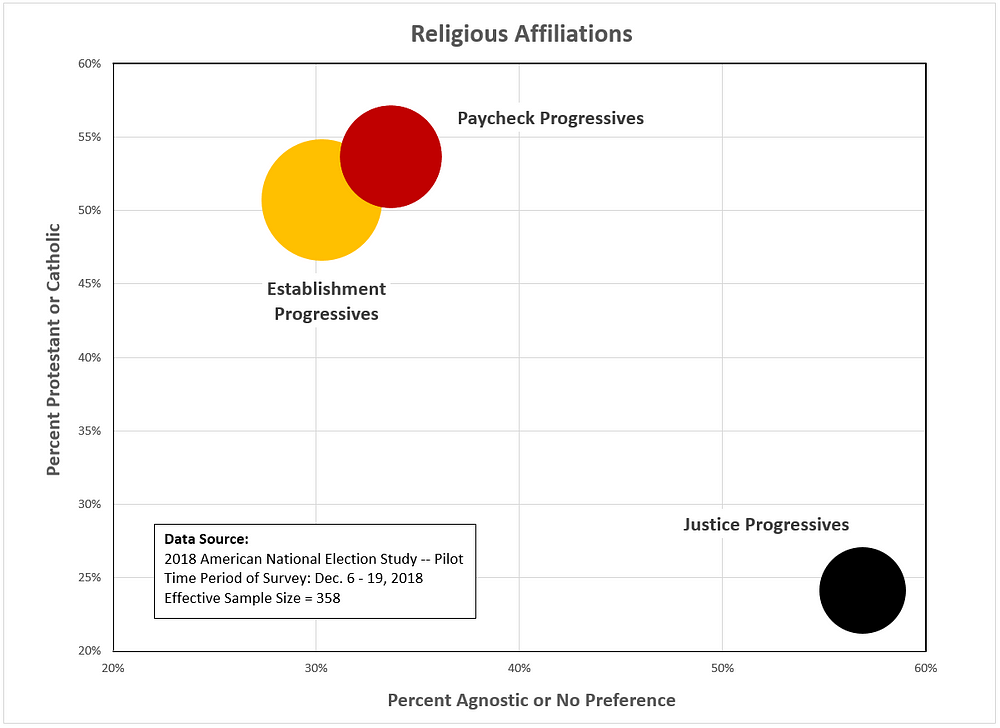
Data Source for Figures 8 and 9: 2018 American National Election Study (Pilot); Analytics and Segmentation by Kent R. Kroeger
Behavioral Differences
Having established the demographic differences, there are also behavioral factors that distinguish the progressive segments — in fact, its these factors that make the segments relevant to the Democratic Party’s strategy going into the 2020 election.
The suspected culprits behind Hillary Clinton’s defeat to Donald Trump in 2016 are many, not the least of which are the Berniecrats who some have claimed disproportionately either voted for Trump, voted for a third party candidate, or did not vote. That dispute won’t be settled here, but the progressive segments give us some clues.
In an earlier essay, I determined that 81 percent of Democratic Progressives, the most liberal voter segment, voted for Hillary Clinton (14 percent did not vote, 4 percent voted for a third party candidate, and 1 percent voted for Trump). When we breakout the Clinton vote by the three progressive segments in Figure 10, we have a likely suspect for the bulk of defections from Clinton: Paycheck Progressives (of whom only 75 percent voted for Clinton, 17 percent did not vote, 4 percent voted for a third party candidate, and 4 percent voted for Trump).
If I am hearing cries of ‘sexist pigs,’ it is understandable given that Paycheck Progressives skew male — but, given the small sample size (115 respondents), there is no statistically significant difference in the 2016 voting behavior of male Paycheck Progressives and female Paycheck Progressives.
But if we are going to call out the Paycheck Progressives, we must also throw a stink-eye gaze at the Justice Progressives, who also voted for Clinton at a lower rate than Establishment Progressives (75% versus 87%, respectively). If the two segments had voted for Clinton at the same rate as the Establishment Progressives, in all likelihood, Clinton wins Florida, Wisconsin, Michigan, Pennsylvania and the presidency.
Figure 10: The Paycheck and Justice Progressives may have let Hillary down
Data Source: 2018 American National Election Study (Pilot); Analytics and Segmentation by Kent R. Kroeger
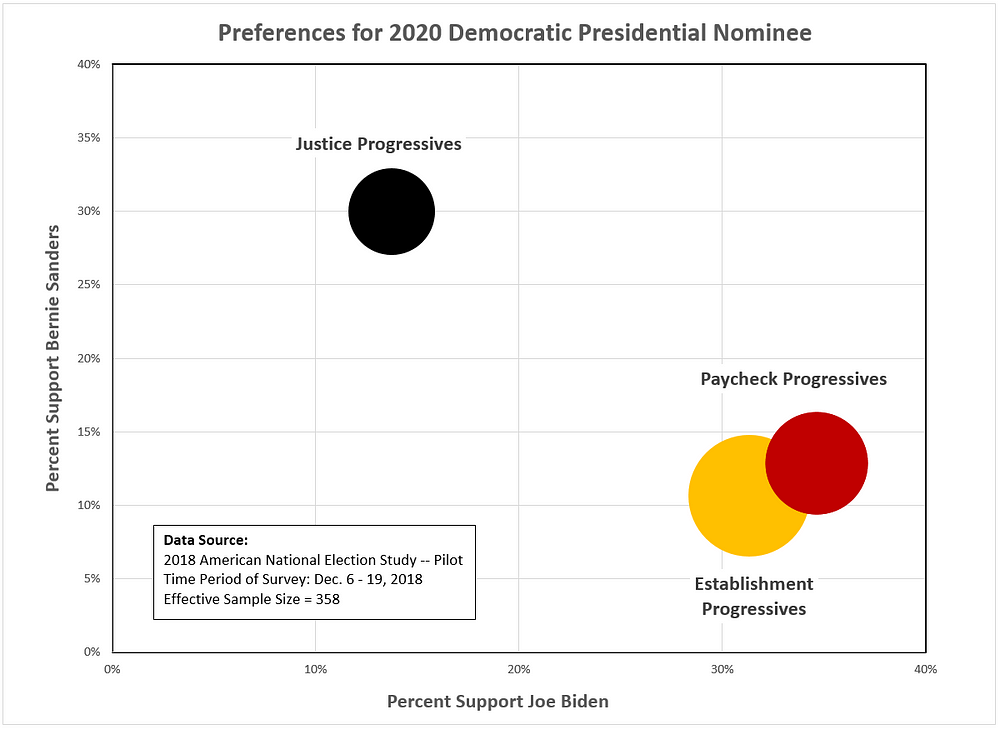
Finally, the 2018 ANES also asked likely 2020 Democratic Party primary voters which candidate they currently prefer (see Figure 11). When this preference is crossed with the progressive segments, we get some validation of the segmentation categories — 30 percent of Justice Progressives prefer Bernie Sanders, while over 30 percent of both Paycheck Progressives and Establishment Progressives prefer former Vice President Joe Biden.
The progressive segments mate nicely with 2020 vote preferences, keeping in mind that most of the now declared Democratic candidates for president were not well known in December 2018 when the survey was conducted. In fact, only three candidates exceed 10 percent support among Democrats in the survey (Biden, Sanders, and Beto O’Rourke).
Figure 11: Preferences for the 2020 Democratic Party Nominee
Data Source: 2018 American National Election Study (Pilot); Analytics and Segmentation by Kent R. Kroeger
Still, this segmentation should cause some worry among Sanders supporters, as the two largest progressive segments, representing three-quarters of progressives, are not (currently) fertile territory for finding Sanders support.
Keep in mind, this analysis does not look at the other Democratic Party-aligned voter segment — Centrist Democrats — which is a group, surprisingly, where Sanders does relatively well, according to the 2018 ANES.
Democratic Progressives however exceed their Centrist allies in market share by 2 to 1 and it is hard to envisage the Democratic Party’s ‘center of gravity’ being anywhere but with the progressives in 2020. Yet, within the progressives, existing divisions — which at least marginally impacted the 2016 election outcome — could easily do so again.
Still, Establishment Progressives are the largest force within the party’s progressive wing, and by extension, the most dominant force in the Democratic Party.
Unless something dramatic happens, that is bad news for Berniecrats.
- K.R.K.
Send comments and online gift cards to: kroeger98@yahoo.com
APPENDIX: Additional Charts, Tables and Graphics
Figure A.1: Policy Attitudes by Progressive Segment 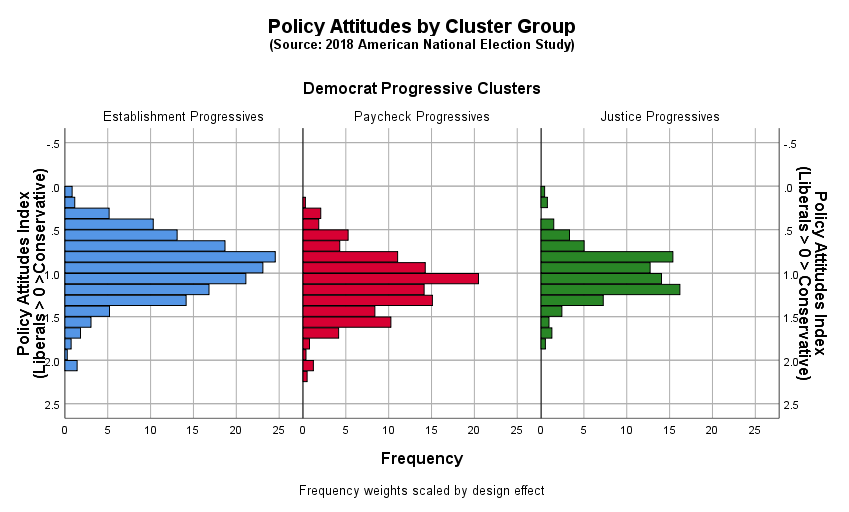
Data Source: 2018 American National Election Study (Pilot); Analytics and Segmentation by Kent R. Kroeger
Figure A.2: Feelings about Capitalism by Age (among Progressive Democrats) 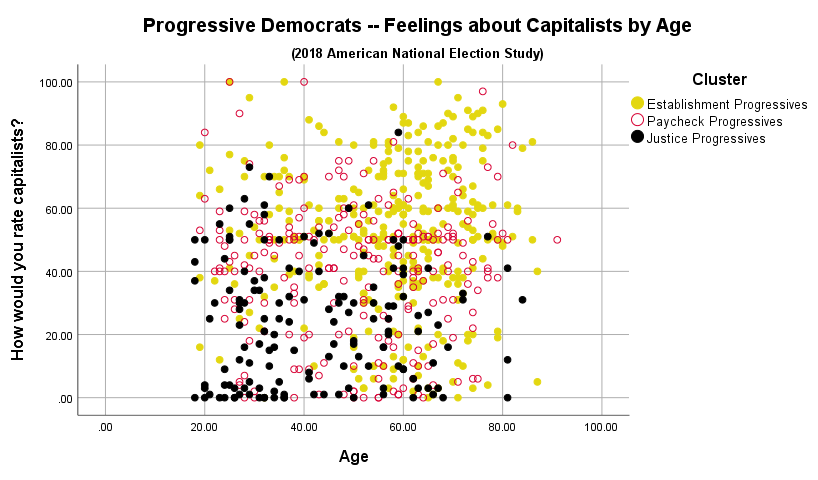
Data Source: 2018 American National Election Study (Pilot); Analytics and Segmentation by Kent R. Kroeger
Figure A.3: Feelings about the Police by Age (among Progressive Democrats) 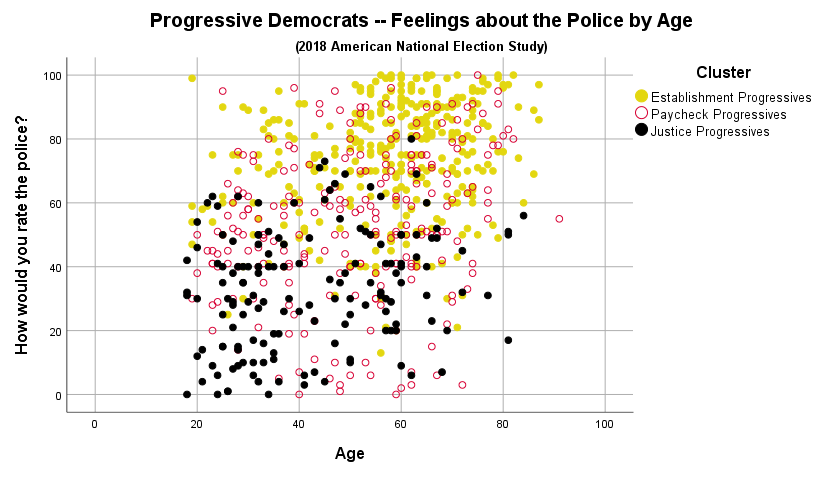
Data Source: 2018 American National Election Study (Pilot); Analytics and Segmentation by Kent R. Kroeger
Figure A.4: 2016 Vote Choice by Progressive Democrat Segments 
Data Source: 2018 American National Election Study (Pilot); Analytics and Segmentation by Kent R. Kroeger
Figure A.5: 2016 Vote Choice by Party Factions 
Data Source: 2018 American National Election Study (Pilot); Analytics and Segmentation by Kent R. Kroeger