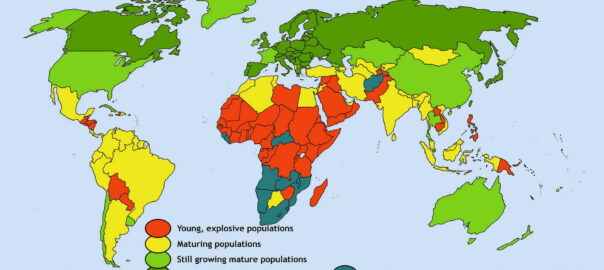
Topline Graphic: Demographic State of World Population (Image by Ionut Cojocaru – Own work, CC BY 3.0)
By Kent R. Kroeger (Source: NuQum.com; August 29, 2020)
Robert Morris first came to my attention with his 2015 book, “Throw Away Your Vote! Why voting for a third party candidate is the only path to real change in 2016,” which someone shared with me on their Kindle at a time when Trump was a mere glint in the Republican base’s eye and mention of Hillary Clinton’s home-brew email server still made me think of craft beer instead of subpoenaed emails and bleached hard drives.
It was a gentler, more naive time.
“The Democrats and the Republicans really want us to believe they are different,” Morris writes. “The problem is that they are not. But we are told that we don’t have any other choice.”
The minimal policy distinctiveness of the two major U.S. parties has long been basic canon for the marginalized left and right in this country, but rarely do people from the center establishment make such a claim. [Why would they? It destroys the major basis of their power over civil society.]
What kind of radical lefty (or righty) is this guy? I thought. And after poking around, I found the author’s website: The More Freedom Foundation.
Christ! The More Freedom Foundation?! With a name like that, I assumed the site is where John McCain acolytes go to jack off over their latest regime change fantasy.
After a little more digging, however, I discovered Mr. Morris was a trained lawyer, former stockbroker, and author of five (political and foreign policy-related) books who had lived in Turkey as an expat for a number of years before returning to New York. On the surface, at least, his biography would be a good fit for any elite-educated establishment-bootlicker (i.e., your prototypical neoliberal, CNN/MSNBC analyst).
Morris describes himself as a “recovering attorney, ex-ex-pat, author and YouTube popularizer of unpopular views” who promises “to do a better job covering them them than any Cable News Channel.”
Not exactly a stretch goal.
As he puts it, “There are a lot of YouTube channels out there who will give you a warm bath of ideology…(and) are perfectly happy to tell you how you should feel about whatever piece of garbage has been served up by the news cycle that day.”
Fine. Its easy to say you are an intellectual outlander, but show us the evidence…
To the contrary, as his website’s name attests, Moore’s worldview appears to align nicely with classic neoliberalism. All else equal, more freedom is good for everyone.
Morris is more inquisitive than subversive; and, despite his often withering critiques of U.S. policy (particularly in the Middle East), Moore doesn’t rage against the machine a la Jimmy Dore as much as he expresses a strong annoyance over how it works.
More importantly, Moore doesn’t attempt to preach to the converted. Moore knows when he’s bucking intelligentsia norms and goes to great lengths to explain his dissension. He feels no need to tell you what you want to hear.
Morris forgoes the deferential and frothy cadences most academics and mainstream media analysts bring to such discussions:
To be clear, the U.S. government is not doing the bidding of the sinister puppet masters at AIPAC. There are many reasons why the U.S. supports Israel so firmly, but at the end of the day it’s about money, pure and simple. Israel’s hardline leadership makes a ton of money for U.S. investors and workers. This is what I call the metastasized Military Industrial Complex (MIC).
Put briefly, this complex has spread like a cancer over the past 75 years. There are now tens or perhaps hundreds of thousands of people across the US and the world whose livelihoods depend on the US defense department. [My note: That number is easily in the millions, just in the U.S.]
This decades old project of war socialism is the biggest jobs program in world history. And it all depends on instability. If you know this 75 year history, then the true role of Israel’s current leadership becomes very clear. They are just one part of a much longer term project.
The only through line to U.S. foreign policy is feeding the Military Industrial Complex. We need instability to feed the beast with outsize military budgets. Israel’s hardline leadership is an important part of this strategy, but they’re not calling the shots. They’re just the latest in a long line of stooges that help us do the job. It’s not Israel’s interests that are being served here. Turning Israel’s neighbors into smoking ruins does not serve the long-term health and stability of the Zionist project. The current Israeli leadership works for the U.S. government, not the other way around.”
[Note: Morris offers a more detailed discussion of the MIC in this video.]
Morris is not the first person to make this observation about the MIC. Its an old (and enduring) argument. Go here and here for a couple of recent politicians who have been saying similar things for over 30 years. And, as far as I’m concerned, no American is fully educated until they’ve memorized President Dwight Eisenhower’s end-of-presidency warning about the MIC (which you can find here along with some analysis).
But Morris doesn’t bring a formulaic, cable-news-friendly partisan hue to his analyses. Sure, he’s expressed his disgust with President Trump’s policies–he’s the only analyst I’ve heard to rightfully observe that the U.S. is already (and wrongfully) at war with Iran— but he’s also offered equally damning analyses of Barack Obama’s foreign policies, particularly with respect to Yemen and Syria. And how many mainstream media analysts knew enough to identify NATO’s role in Russia’s invasion of the Ukraine?
Perhaps most wisely, Morris never fell for the Russiagate hoax that the 448-page Mueller report would eventually reveal was little more than a partisan hatchet job on a duly-elected president.
ts easy to bully the facts to support your own opinions, the challenge is to bully the real world to do the same.
Dr. Meredith Grey on ABC’s “Grey’s Anatomy” said it even better: “Sometimes reality has a way of sneaking up and biting us in the ass. And when the dam bursts, all you can do is swim.”
Moore is proving he’s capable and willing to handle the swim.
K.R.K.
Please send comments to: kroeger98@yahoo.com
or DM me on Twitter at: @KRobertKroeger1
By Kent R. Kroeger (Source: NuQum.com; August 18, 2020)
The data used in this essay can be found here: GITHUB
“The lady doth protest too much, methinks” — Queen Gertrude, Act III, Scene II of Hamlet
In the past few weeks, New York Governor Andrew M. Cuomo’s rhetoric attacking the Trump administration’s response to the coronavirus has noticeably escalated.
Not stopping there, Cuomo compared the coronavirus pandemic to the Vietnam War (not a bad comparison in my opinion) and capped off his partisan broadside with a gasping “shame on all of you” directed at the entire Trump administration.
Even the normally Cuomo-deferential New York media couldn’t help but notice Cuomo’s pointed hyperbole coincided with a growing examination by the New York state legislature (and a small number of journalists) of Cuomo’s decision early in the pandemic to push for the transfer of elderly COVID-19 patients in hospitals to nursing home facilities.
In other words, New York state officials deliberately inserted #coronavirus patients into locations where the people most vulnerable to the virus (the elderly) were concentrated.
The heat on Cuomo has in fact turned up so significantly that the state’s Health Department has already “exonerated” the Cuomo administration of any blame.
It’s good to have friends in high places.
David L. Reich MD, President and COO of The Mount Sinai Hospital and Mr. Michael Dowling, CEO, Northwell Health led a quantitative investigation into any potential link between the transfer of COVID-19 patents into nursing home facilities and nursing home coronavirus deaths.
In their report, they concluded COVID-19 was introduced into nursing homes by infected staff, not by patient transfers from hospitals. They ruled out the transfer policy as the culprit for the following reasons:
“A causal link between the admission policy and infections/fatalities would be supported through a direct link in timing between the two, meaning that if admission of patients into nursing homes caused infection — and by extension mortality — the time interval between the admission and mortality curves would be consistent with the expected interval between infection and death. However, the peak date COVID-positive residents entered nursing homes occurred on April 14, 2020, a week after peak mortality in New York’s nursing homes occurred on April 8, 2020. If admissions were driving fatalities, the order of the peak fatalities and peak admissions would have been reversed.”
So there you go, the problem wasn’t the Governor Cuomo’s coronavirus policies, it was the substandard COVID-19 mitigation efforts of New York’s nursing home facilities. It’s a good thing Governor Cuomo and the state legislature smuggled a provision into the state’s budget bill in late March that increased legal protections for nursing home operators from wrongful death lawsuits related to the coronavirus.
Case closed. Yes?
Hardly.
Dr. Reich’s and Mr. Dowling’s conclusion that the hospital-to-nursing home transfer policy (H2NH) was not responsible for New York’s large number of nursing home based coronavirus deaths is built on a shaky foundation.
As reported by the Associated Press, New York’s coronavirus death toll in nursing homes is very likely an undercount of the true number of COVID-19-related deaths. According to the AP story, state officials adopted a policy that classifies coronavirus deaths as being nursing home-related only if the residents dies on nursing home property. Based on this policy, nursing home residents that die at a hospital are not considered nursing home deaths. According to state officials, the reason for this counting procedure is that it avoids double-counting coronavirus deaths. Certainly a legitimate reason.
However, using New York Department of Health data on vacant nursing home beds, The Hill’s Zach Budryk estimates that 13,000 New York nursing home residents have died from the coronavirus, over twice the official 6,000 number.
Through no fault of Dr. Reich or Mr. Dowling, their statistical analysis of New York nursing home deaths uses faulty data. Nonetheless, their finding that nursing home staff workers brought the virus into nursing homes, not hospital transfers, still begs the question: Why would the state of New York move their most vulnerable coronavirus patients from hospitals into nursing homes, known early in the pandemic to be susceptible to cluster outbreaks, such as a widely reported example in Washington state in March?
Even if their Granger-like causality test didn’t find a rise in nursing home transfers from hospitals was followed by a rise in nursing home coronavirus deaths, Dr. Reich and Mr. Dowling offer no defense of the H2NH policy.
Nursing Home Immunity and the Hospital-to-Nursing Home Transfer Policy
Governor Cuomo is right about one thing, he just failed to name one of the most culpable policymakers — himself. He, along with a handful of other governors, probably made a colossal blunder very early in the pandemic.
The unfortunate interaction of two specific coronavirus policies implemented by a small number of U.S. states (CT, MA, MI, NJ, NY, RI) may have resulted in an additional 27,500 deaths, as of August 13. That translates into about 15 percent more coronavirus deaths than should have occurred given other factors known to correlate with the relative number of state-level coronavirus deaths.
What were the policies?
(1) Granting enhanced immunity to nursing home operators from prosecution over coronavirus-related nursing home deaths (immunity protections), and
(2) Financially enticing nursing home operators to take on elderly coronavirus patients who had been occupying hospital beds (H2NH).
As of today, 19 states have some type of enhanced legal immunity for nursing home operators during the coronavirus pandemic. Those states include: Alabama, Arizona, Connecticut, Georgia, Hawaii, Illinois, Kansas, Massachusetts, Michigan, Mississippi, New Jersey, New York, North Carolina, Oklahoma, Rhode Island, Utah, Vermont, Virginia and Wisconsin. According to the AARP, these laws “differ slightly from state to state, but most shield facilities from civil claims only, and just for the duration of the COVID-19 emergency.”
As for transferring COVID-19 patients to nursing homes, my own research has found only six states that have immunity protections for nursing home operators and have actively provided financial incentives to nursing home operators to take these patients (Connecticut, Massachusetts, Michigan, New Jersey, New York, and Rhode Island).
Superficially, both state-level policies sound morally horrendous: Why grant enhanced legal protections to nursing home operators — an economic group that is not exactly suffering financially these days? And why transfer elderly coronavirus patients from hospitals to nursing homes?
But both policies are predicated on sound reasoning, particularly at the beginning of a pandemic in which experts don’t know the lethality or morbidity rates of a fast-spreading virus. With mortality rates of 4 percent floating around in the media-fueled panic in March (the true number is probably around 0.65 percent, according to the latest CDC numbers), it would seem rational for governors to consider any policy configured to conserve hospital beds.
Cuomo, like all governors, did not know in early March whether the coronavirus might overwhelm the state’s hospital and ICU beds in a matter of weeks or days. Since nursing homes can provide near-hospital level care, it made sense to some states to use excess bed capacities in nursing homes to augment limited bed capacities in hospitals. If that policy required additional protections for nursing home operators, in the end, it would be worth it if the two policies together saved lives.
It was not a crazy set of policies to consider — but it was a tragic set of policies to implement.
For the six states that implemented the immunity protections for nursing homes and the policy of incentivizing nursing homes to take hospital transfers, the outcome is measured in human lives.
According to my analysis below, around 22,500 additional coronavirus deaths have occurred in the U.S. due to Connecticut, Massachusetts, Michigan, New Jersey, New York, and Rhode Island adopting the combination of nursing home operator immunity enhancements and the attendant transfer of elderly coronavirus patients from hospitals to nursing homes.
The Analysis
Policy analysis requires as much piety as it does statistics. It creates mythical worlds — What would be different if this policy did or didn’t exist? — and compares that result to the actual world.
My first pious decision is to ignore existing data provided by most U.S. states on the number of coronavirus deaths in nursing homes — as the evidence suggests those numbers are not consistent across states — and, instead,
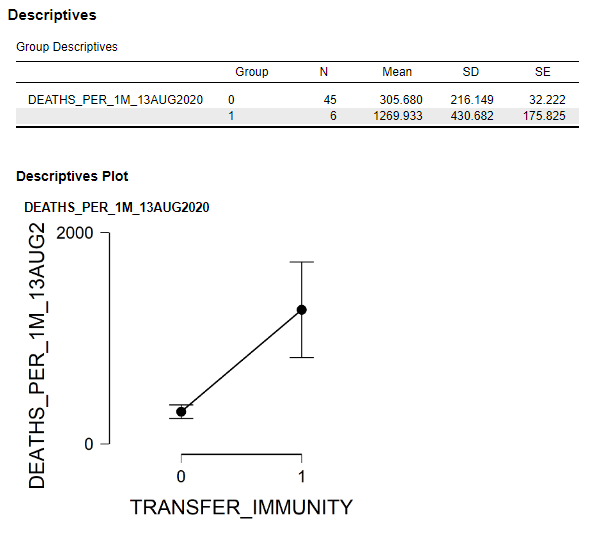
In that spirit, here is a simple comparison of the six dual policy U.S. states that had both policies — the enhanced immunity for nursing homes and the transfer of COVID-19 patients from hospitals to nursing homes — with the 44 states (plus the District of Columbia) that did not. Figure 1 shows the differences in the mean number of coronavirus deaths per 1 million people for those two groups of states.
Figure 1: Comparison of mean coronavirus deaths per 1 million people between U.S. states with both immunity and nursing home transfer policies and U.S. states without the combined policies.
As of August 13, the six dual policy states had a mean number of coronavirus deaths per 1 million people of 1270, compared to only 306 for the other states. This difference is statistically significant.
Why such a big difference?
The answer may be that the combination of the immunity protections and H2NH policies adopted by Connecticut, Massachusetts, Michigan, New Jersey, New York, and Rhode Island were horrendously bad policy decisions. But other factors could also explain those differences such as population density, percentage of the population without health insurance, the state’s relative economic wealth, and other policy decisions.
[Though not addressed in the analysis here, there is also the possibility the coronavirus that has ravaged the U.S. northeast is fundamentally different from the coronavirus hitting other parts of the U.S.]
I further analyzed the U.S. state-level data (including the District of Columbia) using a mediation analysis (see Figure 2) which controls for the other factors that may explain why Connecticut, Massachusetts, Michigan, New Jersey, New York, and Rhode Island have had significantly more deaths per capita (as of August 13).
Figure 2: Mediation model of coronavirus deaths per capita in the 50 U.S. states plus the D.C. (Data source: Johns Hopkins Univ. [CSSE]; data through August 13, 2020)
The focus of this essay is on the effects of the dual policy of immunity protections and the transfer of elderly coronavirus patients from hospitals to nursing homes. In the model estimates (Figure 2), this policy is found to be significantly associated with differences in state-level coronavirus deaths per capita, all else equal. Though I won’t discuss in detail here, other variables found to be significant predictors of coronavirus deaths were (in order magnitude): (1) a state’s population density, (2) the presence of state- or local-level travel restrictions, (3) percent of the state’s population without health insurance, and (4) the number of coronavirus tests per capita.
Using the parameter estimates from the mediation model in Figure 2, two predicted values for each state were calculated: one with the effects of the dual policy (immunity protection and H2NH) included, and one without the effects of the dual policy. Figure 3 compares these predicated values with the actual number of coronavirus deaths per capita for the six states that adopted the dual policy.
Figure 3: The Actual and Predicted Number of Coronavirus Deaths per Capita with and without the Effects of the Dual Policy (CT, MA, MI, NJ, NY, and RI)
According to the estimates in Figure 3, an additional 22,531 coronavirus deaths may have occurred in CT, MA, MI, NJ, NY and RI due to the dual policy of immunity protections and transfer of elderly coronavirus patients from hospitals to nursing homes. New York alone may have already witnessed 9.417 excess deaths due to the dual policy — more than the 6,000+ nursing home deaths currently being reported by the New York Health Department.
If accurate, these are shocking numbers for the six dual policy states. Shocking enough that, at a minimum, further investigation and more sophisticated statistical modeling is warranted to fully understand the potential damage done by the nursing home operator immunity and H2NH policies.
How could such policies be adopted so quickly without more public and scientific input on their rationality? Governor Cuomo and other prominent Democrats enjoy lecturing us on “believing the science.” But where was the science on these two policies?
No doubt, the Republicans will point out that the six dual policy states are all Democrat-dominated states and five are led by Democrat governors (the exception being Massachusetts).
Why would Democrats be more inclined to protect nursing home operators and use nursing home beds to relieve stress on a state’s hospital system?
Could it be money?
Figure 4: Campaign contributions from hospital and nursing home related donors by political party (Source: OpenSecrets.org)
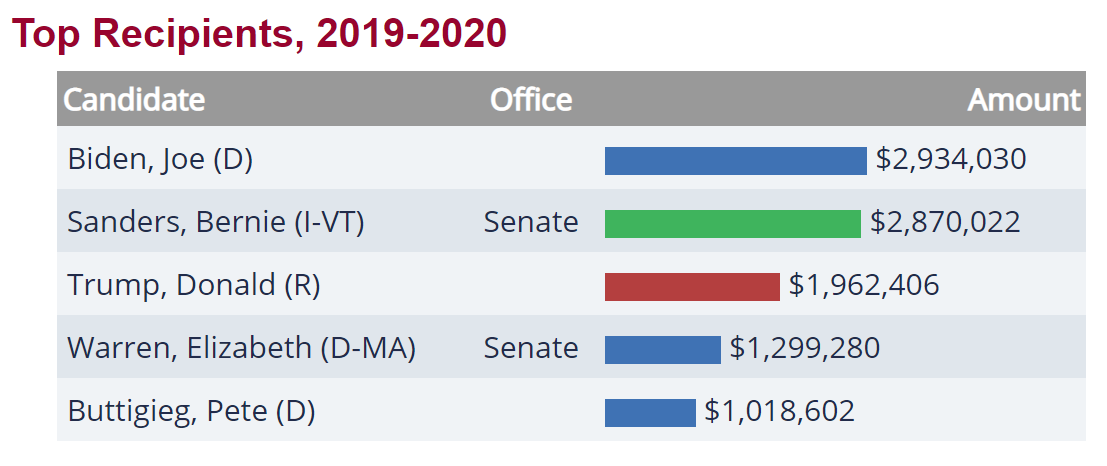
Figure 5: Leading recipients of campaign contributions from hospital and nursing home related interests during the 2019–2020 election cycle (Source: OpenSecrets.org)
For the past three election cycles, the Democrats have received the most campaign contributions from hospital and nursing home donors (see Figure 4). In the current election cycle (2019–2020), the Democrats have received almost twice as much money as the Republicans from hospital and nursing home interests ($24 million versus $12 million, respectively). And it particularly pains me to note that Vermont Senator Bernie Sanders trails only Joe Biden in hospital and nursing home donor money.
Admittedly, this is circumstantial evidence of undue influence on state and federal coronavirus policies by the hospital and nursing home lobbies during this pandemic, but my deep-seated cynicism has suspicions that the scientific community and the American people in general were not at the table when these policies were decided.
Its just a hunch.
K.R.K.
The data used in this essay can be found here: GITHUB
Please send comments to: kroeger98@yahoo.com or DM me on Twitter at: @KRobertKroeger1
Even the normally Cuomo-deferential New York media couldn’t help but notice Cuomo’s pointed hyperbole coincided with a growing examination by the New York state legislature (and a small number of journalists) of Cuomo’s decision early in the pandemic to push for the transfer of elderly COVID-19 patients in hospitals to nursing home facilities.
In other words, New York state officials deliberately inserted #coronavirus patients into locations where the people most vulnerable to the virus (the elderly) were concentrated.
The heat on Cuomo has in fact turned up so significantly that the state’s Health Department has already “exonerated” the Cuomo administration of any blame.
It’s good to have friends in high places.
David L. Reich MD, President and COO of The Mount Sinai Hospital and Mr. Michael Dowling, CEO, Northwell Health led a quantitative investigation into any potential link between the transfer of COVID-19 patents into nursing home facilities and nursing home coronavirus deaths.
In their report, they concluded COVID-19 was introduced into nursing homes by infected staff, not by patient transfers from hospitals. They ruled out the transfer policy as the culprit for the following reasons:
“A causal link between the admission policy and infections/fatalities would be supported through a direct link in timing between the two, meaning that if admission of patients into nursing homes caused infection — and by extension mortality — the time interval between the admission and mortality curves would be consistent with the expected interval between infection and death. However, the peak date COVID-positive residents entered nursing homes occurred on April 14, 2020, a week after peak mortality in New York’s nursing homes occurred on April 8, 2020. If admissions were driving fatalities, the order of the peak fatalities and peak admissions would have been reversed.”
So there you go, the problem wasn’t the Governor Cuomo’s coronavirus policies, it was the substandard COVID-19 mitigation efforts of New York’s nursing home facilities. It’s a good thing Governor Cuomo and the state legislature smuggled a provision into the state’s budget bill in late March that increased legal protections for nursing home operators from wrongful death lawsuits related to the coronavirus.
Case closed. Yes?
Hardly.
Dr. Reich’s and Mr. Dowling’s conclusion that the hospital-to-nursing home transfer policy (H2NH) was not responsible for New York’s large number of nursing home based coronavirus deaths is built on a shaky foundation.
As reported by the Associated Press, New York’s coronavirus death toll in nursing homes is very likely an undercount of the true number of COVID-19-related deaths. According to the AP story, state officials adopted a policy that classifies coronavirus deaths as being nursing home-related only if the residents dies on nursing home property. Based on this policy, nursing home residents that die at a hospital are not considered nursing home deaths. According to state officials, the reason for this counting procedure is that it avoids double-counting coronavirus deaths. Certainly a legitimate reason.
However, using New York Department of Health data on vacant nursing home beds, The Hill’s Zach Budryk estimates that 13,000 New York nursing home residents have died from the coronavirus, over twice the official 6,000 number.
Through no fault of Dr. Reich or Mr. Dowling, their statistical analysis of New York nursing home deaths uses faulty data. Nonetheless, their finding that nursing home staff workers brought the virus into nursing homes, not hospital transfers, still begs the question: Why would the state of New York move their most vulnerable coronavirus patients from hospitals into nursing homes, known early in the pandemic to be susceptible to cluster outbreaks, such as a widely reported example in Washington state in March?
Even if their Granger-like causality test didn’t find a rise in nursing home transfers from hospitals was followed by a rise in nursing home coronavirus deaths, Dr. Reich and Mr. Dowling offer no defense of the H2NH policy.
Nursing Home Immunity and the Hospital-to-Nursing Home Transfer Policy
Governor Cuomo is right about one thing, he just failed to name one of the most culpable policymakers–himself. He, along with a handful of other governors, probably made a colossal blunder very early in the pandemic.
The unfortunate interaction of two specific coronavirus policies implemented by a small number of U.S. states (CT, MA, MI, NJ, NY, RI) may have resulted in an additional 27,500 deaths, as of August 13. That translates into about 15 percent more coronavirus deaths than should have occurred given other factors known to correlate with the relative number of state-level coronavirus deaths.
What were the policies?
(1) Granting enhanced immunity to nursing home operators from prosecution over coronavirus-related nursing home deaths (immunity protections), and
(2) Financially enticing nursing home operators to take on elderly coronavirus patients who had been occupying hospital beds (H2NH).
As of today, 19 states have some type of enhanced legal immunity for nursing home operators during the coronavirus pandemic. Those states include: Alabama, Arizona, Connecticut, Georgia, Hawaii, Illinois, Kansas, Massachusetts, Michigan, Mississippi, New Jersey, New York, North Carolina, Oklahoma, Rhode Island, Utah, Vermont, Virginia and Wisconsin. According to the AARP, these laws “differ slightly from state to state, but most shield facilities from civil claims only, and just for the duration of the COVID-19 emergency.”
As for transferring COVID-19 patients to nursing homes, my own research has found only six states that have immunity protections for nursing home operators and have actively provided financial incentives to nursing home operators to take these patients (Connecticut, Massachusetts, Michigan, New Jersey, New York, and Rhode Island).
Superficially, both state-level policies sound morally horrendous: Why grant enhanced legal protections to nursing home operators–an economic group that is not exactly suffering financially these days? And why transfer elderly coronavirus patients from hospitals to nursing homes?
But both policies are predicated on sound reasoning, particularly at the beginning of a pandemic in which experts don’t know the lethality or morbidity rates of a fast-spreading virus. With mortality rates of 4 percent floating around in the media-fueled panic in March (the true number is probably around 0.65 percent, according to the latest CDC numbers), it would seem rational for governors to consider any policy configured to conserve hospital beds.
Cuomo, like all governors, did not know in early March whether the coronavirus might overwhelm the state’s hospital and ICU beds in a matter of weeks or days. Since nursing homes can provide near-hospital level care, it made sense to some states to use excess bed capacities in nursing homes to augment limited bed capacities in hospitals. If that policy required additional protections for nursing home operators, in the end, it would be worth it if the two policies together saved lives.
It was not a crazy set of policies to consider–but it was a tragic set of policies to implement.
For the six states that implemented the immunity protections for nursing homes and the policy of incentivizing nursing homes to take hospital transfers, the outcome is measured in human lives.
According to my analysis below, around 22,500 additional coronavirus deaths have occurred in the U.S. due to Connecticut, Massachusetts, Michigan, New Jersey, New York, and Rhode Island adopting the combination of nursing home operator immunity enhancements and the attendant transfer of elderly coronavirus patients from hospitals to nursing homes.
The Analysis
Policy analysis requires as much piety as it does statistics. It creates mythical worlds–What would be different if this policy did or didn’t exist?–and compares that result to the actual world.
My first pious decision is to ignore existing data provided by most U.S. states on the number of coronavirus deaths in nursing homes–as the evidence suggests those numbers are not consistent across states–and, instead,
In that spirit, here is a simple comparison of the six dual policy U.S. states that had both policies–the enhanced immunity for nursing homes and the transfer of COVID-19 patients from hospitals to nursing homes –with the 44 states (plus the District of Columbia) that did not. Figure 1 shows the differences in the mean number of coronavirus deaths per 1 million people for those two groups of states.
Figure 1: Comparison of mean coronavirus deaths per 1 million people between U.S. states with both immunity and nursing home transfer policies and U.S. states without the combined policies.
As of August 13, the six dual policy states had a mean number of coronavirus deaths per 1 million people of 1270, compared to only 306 for the other states. This difference is statistically significant.
Why such a big difference?
The answer may be that the combination of the immunity protections and H2NH policies adopted by Connecticut, Massachusetts, Michigan, New Jersey, New York, and Rhode Island were horrendously bad policy decisions. But other factors could also explain those differences such as population density, percentage of the population without health insurance, the state’s relative economic wealth, and other policy decisions.
[Though not addressed in the analysis here, there is also the possibility the coronavirus that has ravaged the U.S. northeast is fundamentally different from the coronavirus hitting other parts of the U.S.]
I further analyzed the U.S. state-level data (including the District of Columbia) using a mediation analysis (see Figure 2) which controls for the other factors that may explain why Connecticut, Massachusetts, Michigan, New Jersey, New York, and Rhode Island have had significantly more deaths per capita (as of August 13).
In this analysis, where the number of deaths per capita is the outcome variable, the number of coronavirus cases per capita is the mediator variable through which the independent effects of (a) the number of tests per capita, (b) population density, (c) GDP per capita, (d) percent of state population without health insurance, (e) the presence of state- or local-level travel restrictions, and (c) the dual policy of immunity protections and H2NH are estimated.
Figure 2: Mediation model of coronavirus deaths per capita in the 50 U.S. states plus the D.C. (Data source: Johns Hopkins Univ. [CSSE]; data through August 13, 2020)
The focus of this essay is on the effects of the dual policy of immunity protections and the transfer of elderly coronavirus patients from hospitals to nursing homes. In the model estimates (Figure 2), this policy is found to be significantly associated with differences in state-level coronavirus deaths per capita, all else equal. Though I won’t discuss in detail here, other variables found to be significant predictors of coronavirus deaths were (in order magnitude): (1) a state’s population density, (2) the presence of state- or local-level travel restrictions, (3) percent of the state’s population without health insurance, and (4) the number of coronavirus tests per capita.
Using the parameter estimates from the mediation model in Figure 2, two predicted values for each state were calculated: one with the effects of the dual policy (immunity protection and H2NH) included, and one without the effects of the dual policy. Figure 3 compares these predicated values with the actual number of coronavirus deaths per capita for the six states that adopted the dual policy.
Figure 3: The Actual and Predicted Number of Coronavirus Deaths per Capita with and without the Effects of the Dual Policy (CT, MA, MI, NJ, NY, and RI)
According to the estimates in Figure 3, an additional 22,531 coronavirus deaths may have occurred in CT, MA, MI, NJ, NY and RI due to the dual policy of immunity protections and transfer of elderly coronavirus patients from hospitals to nursing homes. New York alone may have already witnessed 9.417 excess deaths due to the dual policy–more than the 6,000+ nursing home deaths currently being reported by the New York Health Department.
If accurate, these are shocking numbers for the six dual policy states. Shocking enough that, at a minimum, further investigation and more sophisticated statistical modeling is warranted to fully understand the potential damage done by the nursing home operator immunity and H2NH policies.
How could such policies be adopted so quickly without more public and scientific input on their rationality? Governor Cuomo and other prominent Democrats enjoy lecturing us on “believing the science.” But where was the science on these two policies?
No doubt, the Republicans will point out that the six dual policy states are all Democrat-dominated states and five are led by Democrat governors (the exception being Massachusetts).
Why would Democrats be more inclined to protect nursing home operators and use nursing home beds to relieve stress on a state’s hospital system?
Could it be money?
Figure 4: Campaign contributions from hospital and nursing home related donors by political party (Source: OpenSecrets.org)
Figure 5: Leading recipients of campaign contributions from hospital and nursing home related interests during the 2019-2020 election cycle (Source: OpenSecrets.org)
For the past three election cycles, the Democrats have received the most campaign contributions from hospital and nursing home donors (see Figure 4). In the current election cycle (2019-2020), the Democrats have received almost twice as much money as the Republicans from hospital and nursing home interests ($24 million versus $12 million, respectively). And it particularly pains me to note that Vermont Senator Bernie Sanders trails only Joe Biden in hospital and nursing home donor money.
Admittedly, this is circumstantial evidence of undue influence on state and federal coronavirus policies by the hospital and nursing home lobbies during this pandemic, but my deep-seated cynicism has suspicions that the scientific community and the American people in general were not at the table when these policies were decided.
Its just a hunch.
K.R.K.
Please send comments to: kroeger98@yahoo.com or DM me on Twitter at: @KRobertKroeger1
The data used in this essay can be found here: GITHUB
By Kent R. Kroeger (Source: NuQum.com; August 12, 2020)
The temperature outside here in New Jersey may be 92 °F, but events in the past few weeks and the release of a new film documenting the arrest of Philippine journalist Maria Ressa have put a distinct chill in the air for journalists and free speech advocates.
Abetted perhaps by national governments feeling increasingly empowered during the coronavirus pandemic to exert control over their citizens, press and speech freedoms are being rolled back across the globe at an alarming rate:
On July 16, Moscow police raided the offices of Foundation for Fighting Corruption, an organization founded by Russian opposition politician Alexei Navalny, reportedly over his sharp criticism of individuals promoting a Russian constitutional reform extending President Vladimir Putin’s possible tenure as the Russian leader.
On August 4, Malaysian police raided Al Jazeera’s Kuala Lumpur office and seized two computers soon after the government announced they were investigating Al Jazeera for sedition, defamation and violation of the country’s Communications and Multimedia Act. A July 3rd airing of the Qatar-based news organization’s 101 East televised program raised the ire of Malaysian authorities after criticizing the government’s treatment of undocumented migrant workers during the coronavirus pandemic.
On August 7, a new documentary film,A Thousand Cuts, was released in the U.S. about Maria Ressa, the founder of the internet news site Rappler, and the efforts of the Philippine government under President Rodrigo Duterte to spread disinformation and restrict press freedoms. Ressa, herself, was arrested on February 13, 2019, for “cyber libel” after Rappler published a story about a Philippine businessman’s alleged lending of his sports utility vehicle to since-deceased Chief Justice Renato Corona as a bribed form of favor. Ressa was found guilty on June 15, 2020 and faces between six months and six years in prison and a fine of $8,000.
NEW YORK, NEW YORK — NOVEMBER 2018: (L-R) Honorees Luz Mely Reyes, Amal Khalifa Idris Habbani, Anastasiya Stanko, Nguyễn Ngọc Như Quỳnh, and Maria Ressa attend the Committee To Protect Journalists’ (CPJ) International Press Freedom Awards at the Grand Hyatt on November 20, 2018 in New York City. (Photo by Dia Dipasupil/Getty Images for CPJ; Used under the Creative Commons Attribution 2.0 Generic License)
And on Sunday, Chinese government authorities in Hong Kong arrested Apple Daily founder Jimmy Lai Chee-ying and nine other journalists and pro-democracy activists for colluding with foreign entities under a new national security law implemented in June that broadened the definitions of acts of secession, subversion, terrorism and collusion considered criminal. One of Beijing’s justifications for this new law was to limit large gatherings of people, including protest marches, which can hasten the spread of the coronavirus.
World leaders from the U.S., Japan, Canada, Europe and Britain expressed dismay at the arrests, suggesting this indicated Hong Kong’s new national security law was meant primarily to suppress dissent, not save lives.
During a similar incident in Hong Kong in April, U.S. Secretary of State Mike Pompeo issued a statement condemning the arrest of Hong Kong journalists.
“Beijing and its representatives in Hong Kong continue to take actions inconsistent with commitments made under the Sino-British Joint Declaration that include transparency, the rule of law, and guarantees that Hong Kong will continue to ‘enjoy a high degree of autonomy.”
If only this concern for journalists and free speech by Pompeo and other Western leaders could be taken seriously.
As long as Julian Assange is held indefinitely in a U.K. prison for publishing U.S. state secrets, the West has little credibility on Hong Kong
Wikileaks founder Julian Assange is today being held in a U.K. prison, originally for avoiding extradition to Sweden for questioning on sexual assault charges (which were ultimately dropped by Swedish authorities), and currently for hearings on his extradition to the U.S. on charges of conspiracy to commit computer intrusion by helping Chelsea Manning, then serving in the U.S. Army, gain access to classified information intended for publication on Wikileaks. Since Assange’s imprisonment in the U.K., the U.S. has added 17 additional espionage charges under the 1917 Espionage Act.
U.S. case law arising from the Espionage Act has a long history and is too complicated to easily summarize (A good starting resource is here). But it is fair to say that Manning committed an espionage crime for which she was convicted by court-martial and sentenced to 35 years at Fort Leavenworth. Her sentence was later commuted by President Barack Obama on January 17, 2017, though Manning was later imprisoned in March 2020 for refusing to testify before a grand jury investigating Assange.
What is far from clear is the crime Assange and Wikileaks committed by publishing the whistleblower information provided by Manning. The U.S. Supreme Court’s landmark decision — New York Times Co. v. United States, 403 U.S. 713 (1971) — making it possible for The New York Times and The Washington Post newspapers to publish the then-classified Pentagon Papers without risk of government censorship or punishment looms over the U.S. case against Assange like a butcher’s knife over a ribeye roast.
The U.S. case against Assange appears to rest on the accusation that he personally helped Manning hide her intrusion into classified military information systems, thereby making him an accomplice to the established espionage crime.
[There is a young, ambitious lawyer somewhere in the U.S. today that is going to ensure her career reputation by defending Assange in a U.S. court on these dubious charges.]
That Assange sits in a U.K. prison because of a U.S. District Attorney’s indictment built around the 1917 Espionage Act is particularly odious if you believe in the U.S. Constitution’s First Amendment.
Consider the troubling origins of The Espionage Act itself, passed on June 15, 1917 and which aimed to protect military intelligence by making it illegal to share classified information. Its stated intent during The Great War (World War I) was to target Germans collecting intelligence and planning acts of sabotage within U.S. borders. But as such laws tend to do, seemingly rational intentions were quickly overwhelmed by human flaws and it was German-Americans and their German-language newspapers that became the tangible targets.
After its passage, the 1917 Espionage Act (along with the 1917 Trading with the Enemy Act) had an immediate and chilling effect on U.S. journalism, particularly German-American newspapers which were common throughout the country prior to World War I. However, by the end of the war, the total number of German publications decreased from 522 in 1917 to 278 in 1920.
That same law is again being used to silence a journalist.
Assange sits in a U.K. prison under the accusation of espionage crimes from 2010; but, in truth, resides there because of the political crime of using his publication — Wikileaks — to attack someone who was the presumptive President of the United States in 2016. That was a moral crime, according to the U.S. news media barons who were exposed as establishment tools in the 2016 U.S. presidential election.
U.S. journalists attack Assange — not because of the Manning documents — but because he allowed Wikileaks to be used against Hillary Clinton
Since his arrest at the Ecuadorian embassy in London on April 11, 2019, Assange has been incarcerated in Her Majesty’s Belmarsh Prison (also in London).
“Since 2010, when Wikileaks started publishing evidence of war crimes and torture committed by US forces, we have seen a sustained and concerted effort by several States towards getting Mr. Assange extradited to the United States for prosecution, raising serious concern over the criminalisation of investigative journalism in violation of both the US Constitution and international human rights law,” contends Melzer. “Since then, there has been a relentless and unrestrained campaign of public mobbing, intimidation and defamation against Mr. Assange, not only in the United States, but also in the United Kingdom, Sweden and, more recently, Ecuador.”
Working on Assange’s behalf will always be Wikileaks’ original mission:
“Wikileaks exists to defend the practical rights of whistleblowers to bring their information to the public”
That isn’t a criminal activity. That is what liberal democracies desperately need for their own legitimacy.
And if you think Assange is the only victim of this organized campaign against press freedom, I invite you to learn more about the case of former CIA operative Jeffrey Sterling.
If there is anything powerful people hate most, its freedom of the press.
Reporters Without Borders reported recently that media freedom worldwide has deteriorated by 12 percent since their index was created in 2013. The proportion of countries where press freedom is “very bad” has increased by two points to 13 percent during since then.
The U.S. is among those nations where press freedoms remain under pressure. Regarding events in 2019 that threatened U.S. press freedoms, Reporters Without Borders note in their 2020 Report on World Press Freedom:
In March 2019, a leaked document revealed the US government was using a secret database tracking journalists, activists and others who border authorities believed should be stopped for questioning when crossing certain checkpoints along the US-Mexico border. A couple months later, the Justice Department charged Wikileaks co-founder Julian Assange with 17 counts of the WWI-era Espionage Act. If he is convicted, this would set a dangerous precedent for journalists who publish classified US government information of public interest moving forward.
It is in this context that the U.S. and its allies lecture China on its reprehensible actions in Hong Kong.
Let there be no doubt. China is actively crushing press and speech freedoms in Hong Kong.
Let there also be no doubt that the U.S. and U.K. are doing the same in their own countries.
K.R.K.
Send comments and lectures to: kroeger98@yahoo.com
By Kent R. Kroeger (Source: NuQum.com, August 7, 2020)
As he sat before the House Select Subcommittee on the Coronavirus Crisis on July 31st, Dr. Anthony Fauci, director of the National Institute of Allergy and Infectious Diseases (NIAID), was asked about Europe’s success in controlling the coronavirus (SARS-CoV-2) and the possible need for a national-level mandate on mitigation and suppression policies (M&S) in the U.S. His response illustrates the problem in relying solely on scientists to make sound public policy.
“They (Europe) shut down about 95 plus percent of their (economy)…we (the U.S.) shut down only about 50 percent. As a result, Europe came down to a low baseline (for new daily infections), while we plateaued at about 20,000 cases-a-day at the time that we tried to open up the country–and when we opened up the country we saw–particularly in the southern states–an increase of cases up to 70,000 per day.”
The implication Dr. Fauci was making–and what the Democratic committee member were eagerly poised to jump on–was that the U.S. should have shut down 95 percent (plus) of its economy, as Europe did, and that we may still need to do so.
It is somewhat trivial to say that strict lockdown policies can stem the spread of a highly contagious virus like SARS-CoV-2 (“the coronavirus”). At its extreme–say, lock everyone in a hermetically-sealed canister that can provide them food and water for an extended period of time–and, of course, the virus will not spread.
Few Republicans are arguing that lockdowns (including school closures) don’t achieve their desired goal of reducing viral transmissions. Of course they do.
Instead, the bigger question from the Republicans has always been: By implementing broad (statewide) shut downs, are we doing more damage to the U.S. economy (and the educational advancement of our students) than warranted given that the coronavirus has an CDC-estimated infection mortality rate of around 0.65 percent (or 6.5 times more lethal than the seasonal flu)?
Dr. Fauci, like many epidemiologists weighing in on the “science” of the coronavirus, doesn’t offer a substantive analysis of the trade-off between M&S policies and their economic consequences. And, frankly, its neither his job or expertise to do so.
That is why we elect representatives to go to our state legislatures and Congress to hammer out answers (under advisement from many disciplines) to these difficult questions.
Yes, science is real. But, science is not enough.
Science is not enough in making policies on climate change and it is not enough in making policies on the coronavirus.
Yes, Europe stopped the dangerous spread of the coronavirus through relatively draconian (and I believe necessary) lock down policies. In early March, who really knew how dangerous this virus really is? But what has been the economic damage and how does it compare to the clear benefits of reducing the spread of this virus?
Should Europe return to their prior, severe restrictions? And, if so, for how long? And does your answer to these questions assume the world will have an effective vaccine in the near future?
Though President Donald Trump continues to wax optimistic about a coronavirus vaccine being widely available soon, many epidemiologists are not as sanguine–not because they don’t like Trump–but because the history of vaccines, including effective ones, are peppered with significant setbacks and deficiencies.
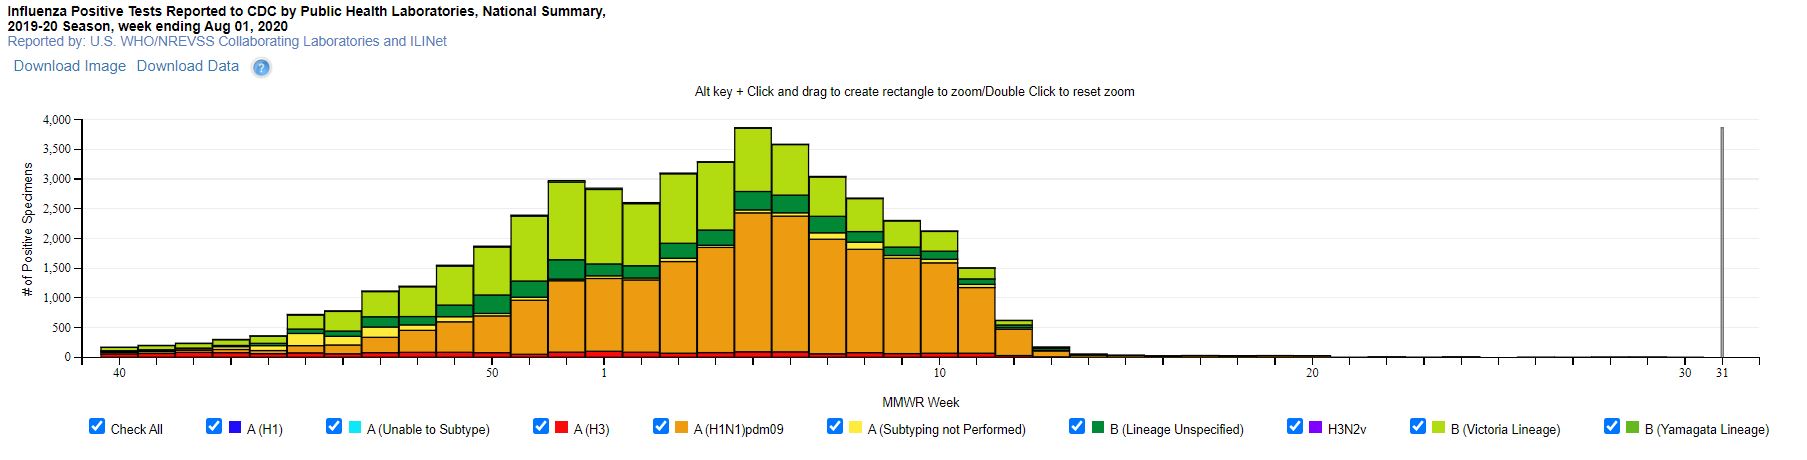
According to a February CDC report, the current influenza vaccine has been 45 percent effective overall against the 2019-2020 seasonal influenza A and B viruses. And that is against viral agents–the seasonal flu varieties–where scientists have many decades of intimate experience.
“There’s no silver bullet at the moment and there might never be,” World Health Organization Director-General Tedros Adhanom Ghebreyesus warned earlier this month.
If European and U.S. politicians think their economies can withstand further broad lockdowns until the SARS-CoV-2 vaccine is waiting at their local CVS Pharmacy, they aren’t too concerned with the economic well-being of their average constituent.
Neither the Democrats or Republicans are on any particular high ground in this debate. Both sides have legitimate concerns (though embarrassing Trump is not one of them), but like any tug-of-war match, at some point an empirical reality will give the advantage to one side over the other.
The latest worldwide coronavirus data says ‘culture matters.’
However, we are nowhere close to definitive answers to the policy questions surrounding the coronavirus–particularly since this pandemic is far from over.
Hence, I do not have the answers to the questions posed above. But, as a statistician with some minor training in epidemiology, I do feel somewhat equipped to draw impressions from the cross-national coronavirus data publicly available on websites such as those maintained by OurWorldInData.org, Johns Hopkins University and RealClearPolitics.com.
From what I see in the worldwide coronavirus fatality data up to now (i.e., deaths per 1 million people) and a recent index of national coronavirus policies (where 100 = strictest and 0 = None), the saddest cases are indisputable:
(Country — Deaths per 1M — Policy Response Index)
Belgium — 863.3 — 61
United Kingdom — 699.5 — 60
Peru — 638.5 — 78
Spain — 610.0 — 60
Italy — 582.3 — 70
Sweden — 565.9 — 35
Chile — 528.0 — 68
U.S. — 498.5 — 62
Brazil — 471.9 — 67
France — 452.5 — 65
Note: Average Policy Response Index across 145 countries = 64 (ranging between 94 in Libya to 12 in Belarus)
And the success stories are equally evident:
(Country — Deaths per 1M — Policy Response Index)
Taiwan — 0.3 — 29
Iceland — 2.1 — 43
Malaysia — 4.0 — 59
Tunisia — 4.4 — 54
New Zealand — 4.5 — 50
Georgia — 4.6 — 75
Singapore — 4.8 — 66
Slovakia — 5.7 — 56
South Korea — 5.9 — 58
Hong Kong — 6.2 — 64
While the above data does not address the timing of policy responses, it does not offer initial compelling evidence that strict coronavirus M&S policies can alone stem the spread and deadliness of the virus.
The relationship between strict M&S policies and the (population-based) mortality rate of the coronavirus is too complicated to be revealed in a simple bivariate correlational analysis.
Unfortunately, even in a more sophisticated multiple variable analysis, the relationship is more nuanced that can be easily summarized in a 3-minute network news segment.
The Data
I analyzed 108 countries using data from OurWorldInData.org, Johns Hopkins University and RealClearPolitics.com. The data is current through August 3rd for the coronavirus policy data (OurWorldInData.org) and through August 5th for the coronavirus case and fatality data (RealClearPolitics.com). Due to issues with its data reporting, I have excluded China from this analysis. Its inclusion, however, would not have changed the substance of the results reported below.
The variables used in this analysis are as follows (The above variables have hyperlinks to their original data sources):
The last two variables deserve some elaboration. The average daily policy response index is derived from an index created by Oxford University researchers (Coronavirus Government Response Tracker) and is averaged on a daily basis over the number of days since a country’s first coronavirus case. Here is a more detailed description of this variable found on OurWorldInData.org:
The research we provide on policy responses is sourced from the Oxford Coronavirus Government Response Tracker (OxCGRT). This resource is published by researchers at the Blavatnik School of Government at the University of Oxford: Thomas Hale, Anna Petherik, Beatriz Kira, Noam Angrist, Toby Phillips and Samuel Webster.
The tracker presents data collected from public sources by a team of over one hundred Oxford University students and staff from every part of the world.
OxCGRT collects publicly available information on 17 indicators of government responses, spanning containment and closure policies (such as such as school closures and restrictions in movement); economic policies; and health system policies (such as testing regimes). Further details on how these metrics are measured and collected is available in the project’s working paper.
The other variable–an indicator for Sinic countries–is taken from work by American Sinologist and historian Edwin O. Reischauer, who grouped China, Korea, and Japan into a cultural sphere that he called the Sinic world. He categorized these countries based on their state centralization and shared Confucian ethical philosophy. This is a blunt measure of a nation’s culture: Is the country a centralized Confucian society or not?
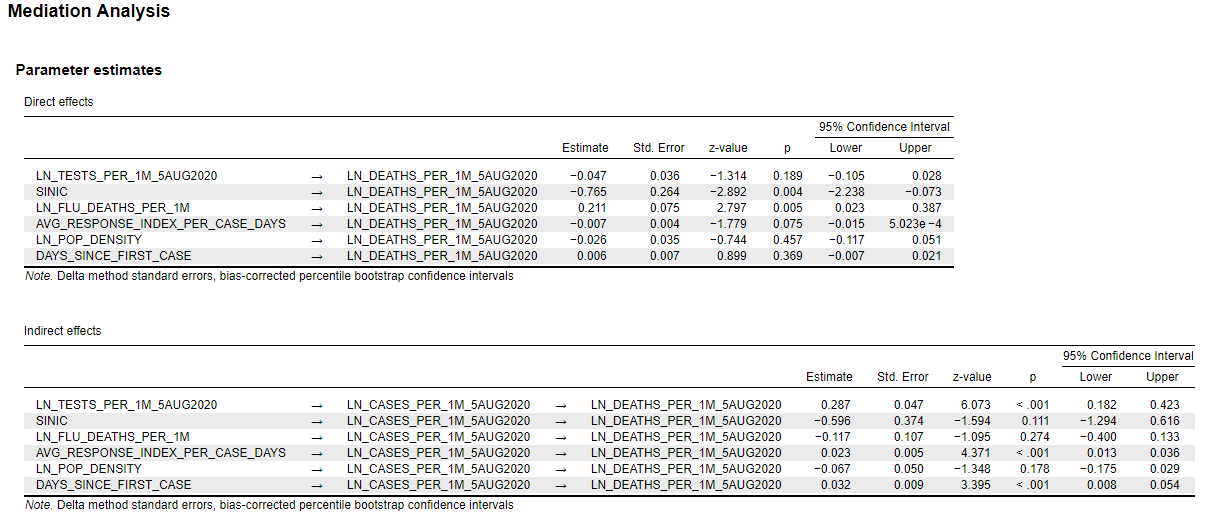
Finally, in order to account for the indirect and direct effects of each variable on the outcome variable (deaths per 1 million people), I employed a mediation analysis using JASP software. The parameter estimates for the complete model are in the appendix below and are available in more detail by request to: kroeger98@yahoo.com.
The Results
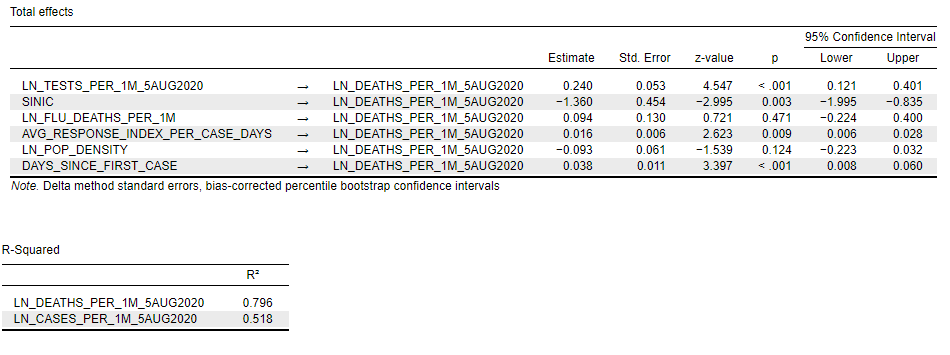
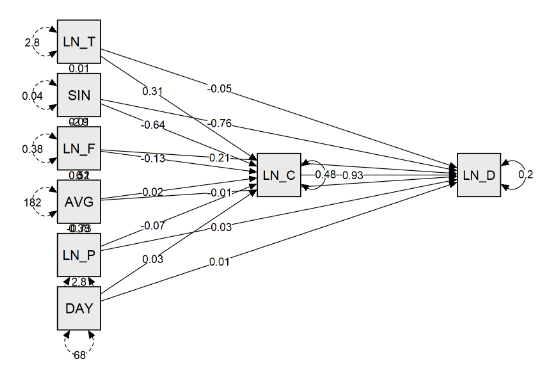
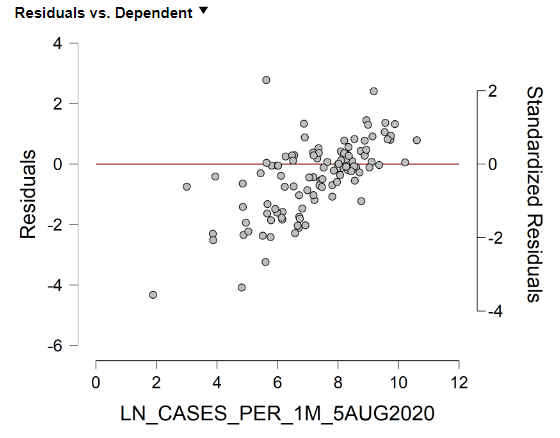
The path model and the parameter estimates for the total effects of each variable on the number of Deaths per 1 Million People (outcome variable) are seen in Figure 2. This table does not include the mediator variable–Cases per 1 Million People–whose effect on the outcome variable is seen in the path diagram and reported in the appendix below.
Figure 2: The Total Effects of Each Predictor Variable on Deaths per 1M People
PATH MODEL:
[Specific interpretations of the parameter estimates are left up to the reader. To learn more about how to interpret parameter estimates in a mediation analysis, I recommend the following resource: University of Virginia Research Data Services]
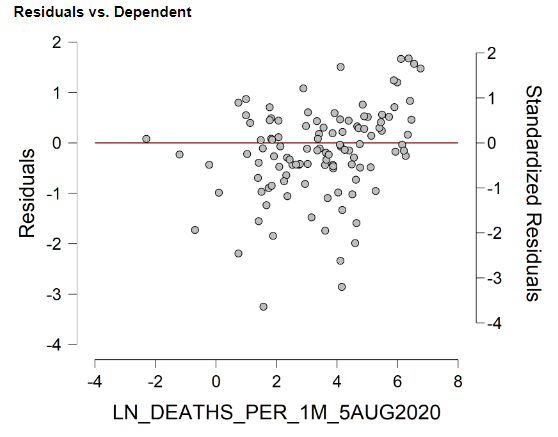
Note first that the models for Deaths per 1 Million People and Cases per 1 Million People have decent fits (R-squared = 0.80 and 0.52, respectively). Also, the errors in both models do not significantly deviate from random noise (see appendix).
More interestingly, only four of the predictor variables are found to have a significant total effect on the number of Deaths per 1 Million People. I will discuss each briefly:
The number of Tests per 1 Million People is the most powerful predictor of the number of Deaths per 1 Million People and the relationship is positive: More tests per capita corresponds to more deaths per capita, all else equal. That does not mean a country can reduce its coronavirus deaths by conducting fewer tests(!). It does mean that countries with relatively more coronavirus deaths also have conducted relatively more tests, even after controlling for the effect of the number of Cases per 1 Million People. In my view, the relative number of tests is a proxy variable for the level of effort a country is putting into understanding and controlling the coronavirus.
The second most significant predictor of coronavirus Deaths per 1 Million People is the number of Days Since 1st Reported Coronavirus Case. In other words, all else equal, the longer the virus has been in the country, the higher the relative number of deaths per capita. Not at all surprising.
The third most significant predictor of coronavirus Deaths per 1 Million People is whether or not a country is a Sinic country. All else equal, highly centralized and Confucian-based societies (i.e., South Korea, Singapore, Taiwan, Hong Kong) have a significantly lower number of deaths per capita.
Culture matters when it comes to controlling the spread of the coronavirus. It matters a lot. As it has been put to me many times from multiple sources, people in East Asia (and Russia) know how to be sick.
Finally, the real conundrum of this analysis. The coronavirus policy index variable is a significant predictor of the number of coronavirus deaths per capita, but in the positive direction(!). In other words, all else equal, countries with the strictest coronavirus M&S policies have a higher number of coronavirus deaths per capita.
But relax. The interpretation of this result is critical. The best interpretation, in my opinion, is that strict coronavirus M&S policies are a response by countries that have faced the worst invasion of this virus (up to now)–Italy, Spain, U.S., and Belgium, etc.–with Sweden a notable exception. In Sweden’s case, the country did not have particularly draconian reaction to the pandemic and–as of August 5th–has not suffered any more or less than a large number of countries that with a relatively large number of deaths per capita despite implementing strict M&S policy measures.
These conclusions are obviously far from definitive. And, keep in mind, I have done nothing here to consider the economic consequences of a particular M&S policy.
These conclusions are obviously far from definitive. Further data collection and analyses are required that account for the bidirectional causality of these relationships (such as coronavirus policies being a response of the relative number of deaths) and that model the causal dynamics in a time-series context (e.g, changes in X at time 0 cause changes in Y at time 1).
As the policy science on the coronavirus pandemic stands today, any declarative statements made by politicians, scientists, or the news media about the effectiveness of some M&S policies — such as economic lockdowns — must be considered in concert with the potential political or partisan biases of the statement’s source. The actual evidence supporting the many M&S policy options — -”the science” as they say — is far too complex and nuanced to be handled as simplistically as it usually is in the national media.
The coronavirus pandemic has become a political football, used primarily as a cudgel against the current U.S. administration. When this pandemic is over, the most interesting analytic question–which I have no doubt nobody in U.S. academia will touch–is how many deaths were caused by the politicization of the coronavirus pandemic.
In the past I have said that hyper-partisanship is deadly to our democracy. I didn’t mean it literally then, but I might now.
Final Thoughts
Despite the panic pornthat describes most of the national media’s coverage of the coronavirus pandemic, I do believe the policy answers we crave are already out there.
“Testing, isolating and treating patients, and tracing and quarantining their contacts. Do it all.
“Inform, empower and listen to communities. Do it all.
“For individuals, it’s about keeping physical distance, wearing a mask, cleaning hands regularly and coughing safely away from others. Do it all.
“The message to people and governments is clear: Do it all.”
On a fundamental level, Dr. Tedros is talking about changing world culture so it can better handle highly contagious and deadly viruses like SARS-CoV-2. As the analysis here suggests, the Sinic countries may be farther along in that regard.
Dr. Tedros’ advice is also in stark contrast to Dr. Fauci, the Democrats and the anti-Trump mob, as he does not mention the further shutting down of the world economy for indefinite amounts of time in the hope that a vaccine is just around the corner.
He knows better. The world can’t afford to be that wrong.