By Kent R. Kroeger (Source: NuQum.com; February 28, 2022)
“My definition of a free society is a society where it is safe to be unpopular.” Adlai Stevenson
“If liberty means anything at all, it means the right to tell people what they do not want to hear.” George Orwell
Freedom can never be taken for granted.
Russia’s violent and ill-advised invasion of Ukraine brings this reality into immediate focus.
But the events in Ukraine overshadow decidedly smaller, long-festering threats that nonetheless, in the collective, may be eroding freedoms worldwide with as much certainty.
One such small threat was highlighted by a recent news story that warranted little more than a minor headline on sports news websites such as ESPN.com and CBS Sports.com.
On February 25th, Callaway Golf, the largest golf equipment manufacturer in the U.S., decided to “pause” its business relationship with legendary golfer Phil Mickelson, a six-time major champion, over “controversial” remarks he made in an interview about Saudi Arabia, the country financing a new professional golf league to compete with the dominant PGA Tour.
Earlier in the week, KPMG (a Big Four accounting firm), Workday (a large U.S. software firm) and Amstel Light terminated their relationship with Mickelson.
What did Mickelson do?
He told a journalist that, while he recognized Saudi Arabia was using the new golf league to “sportswash” the country’s well-documented human rights violations, he was prepared to look past that in order to put pressure on the PGA Tour to increase compensation for that tour’s golfers.
“We know they killed (Washington Post columnist Jamal) Khashoggi and have a horrible record on human rights. They execute people over there for being gay,” Mickelson told The Fire Pit Collective’s Alan Shipnuck. “Knowing all of this, why would I even consider it? Because this is a once-in-a-lifetime opportunity to reshape how the PGA Tour operates.”
Mickelson, who also described the Saudi’s as “scary,” issued an apology within days of news getting out about his Saudi-related comments:
“Although it doesn’t look this way now given my recent comments, my actions throughout this process have always been with the best interests of golf, my peers, sponsors and fans,” he wrote on Twitter. “There is the problem of off-the-record comments being shared out of context and without my consent, but the bigger issue is that I used words that do not reflect my true feelings or intentions. It was reckless, I offended people, and I am deeply sorry for my choice of words. I’m beyond disappointed and will make every effort to self-reflect and learn from this.”
Mickelson’s fellow golfers offered little support to the backlash over his comments, exemplified by Rory McIlroy who called Mickelson “naive, selfish, egotistical, (and) ignorant.” [A description that could apply to almost every celebrity I’ve ever met.]
Rarely mentioned or hyperlinked in the news reporting about Mickelson’s comments were details of Saudi Arabia’s most egregious human rights violations. So here is an attempt to remedy that oversight:
It is understandable to think the public admonishment of a multi-millionaire golfer over critical comments about Saudi Arabia is not relevant to the average citizen, but consider this — If an independently wealthy golf hero can be forced to publicly prostrate himself over statements he made based on widely accepted fact, imagine how an average schlub would be disciplined? Or someone from a marginalized community? Or someone who dares to challenge the status quo or the powerful?
The words of Stevenson and Orwell have never been more germane, but it is perhaps this quote that is more pertinent: “In a time of universal deceit, telling the truth is a revolutionary act” (a quote falsely attributed to George Orwell).
I respect the right of private corporations and entities to censor those who use their services or are under their employ. But it is unfortunate when the news media fails to challenge them for such practices.
It is particularly worrisome when people who speak their mind in good faith are then threatened with the loss of their livelihood.
The tyranny of the thought police does not always operate in darkness. Anymore it appears to happen in the light of day.
By Kent R. Kroeger (Source: NuQum.com; February 24, 2022)
In a previous essay, I shared a statistical model that partitioned variation in COVID-19 death rates across the 50 U.S. states (plus the District of Columbia) based on a variety of factors, including the stringency of state COVID-19 policies, vaccination rates, preexisting economic conditions, the availability of nurses in nursing homes, and the healthiness of the state’s population.
The primary conclusion was that stringent state-level COVID-19 policies had a discernable association with death rates, all else equal, but that preexisting levels and changes in a state’s unemployment rate had a comparable, if not stronger, relationship.
Lockdowns and other COVID-19 mitigation policies worked in minimizing COVID-19 death rates, but their positive impact was betrayed somewhat by the extent to which they harmed a state’s economy and employment levels.
In the midst of a worldwide virus pandemic, unemployment and economic distress can kill just as ruthlessly as a virus.
It is far too easy in our highly partisan political environment to see the world in oversimplified motifs such as: Democrats trust the science and Republicans deny it.
That lazy conceit is not only inaccurate, it is unconstructive to a public debate on how to handle a viral pandemic.
Throughout this public health crisis, the science has been understandably tentative, sometimes ambiguous and too often nakedly political.
And why would anyone expect the public policies issued in this environment to be consistent and coherent?
The reality is that the science on COVID-19 is evolving along with the virus itself. Science is never perfect. It makes mistakes. Politicians and media personalities can lecture others to “trust the science,” but actual scientists don’t have that luxury. They can’t trust the science. By training, it is their job to always question it. Poke it. Prod it. Unrelenting skepticism is a virtue in their line of work, not a vice.
More crucially, science doesn’t operate in a vacuum. When science is translated into policy — as it has been throughout the COVID-19 pandemic — it is a political act. Scientists can’t be expected to understand the social implications of their research findings and recommendations — which is why, in our system of government, we purposefully put elected representatives between the scientists and their policy recommendations. The U.S. is a representative democracy, not a technocracy — and for good reason, policymaking requires a wholistic view of issues that few scientists possess.
In an article for the American Institute for Economic Research, economist Jon Murphy outlined how the disconnected perspectives between elected leaders and scientists explain the cascade of mistakes and contradictions that regrettably define many of the policy decisions made during the COVID-19 pandemic:
“Experts are just like us. They are experts in their specific fields, but not beyond them. The problem with a pandemic is that it is not simply a medical phenomenon. There are economic issues at play, political issues at play, mental health issues, educational issues, etc. Dr. Fauci may be a brilliant immunologist, but he is no economist.”
State policies mattered during the COVID-19 pandemic
At the beginning of the pandemic, World Health Organization Director General Tedros Adhanom Ghebreyesus warned that “this virus does not respect borders.”
Two years later, he has been proven right — no jurisdiction has been spared.
But a handful of Republican governors confused the easy transmissibility of the coronavirus with the belief that strict, broadly-targeted statewide policies could not contain the virus’ spread and reduce the number of deaths. [Early in the pandemic, I believed the same thing.]
They (including me) were dead wrong.
However, these same governors rightfully recognized that strict COVID-19 lockdowns also cause significant economic harm, particularly to people who were financially vulnerable heading into the pandemic. Florida Governor Ron DeSantis repeatedly resisted lockdown policies because, in his words, they would “hurt families who can’t afford to shelter in place for six weeks.”
Was he wrong?
The answer is complicated. Still, I prefer simple displays of data whenever possible.
So, my first stab at answering the question is looking at a basic bivariate plot of state-level COVID-19 deaths per capita versus the average daily stringency of state-level COVID-19 policies from March 1, 2020 to December 1, 2021.
Figure 1 is that initial plot…
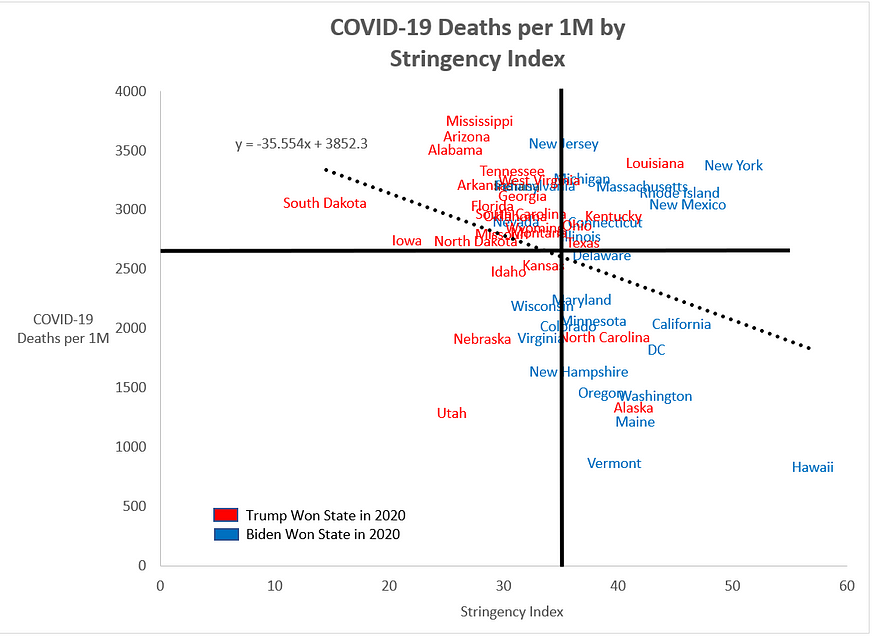
Figure 1: COVID-19 deaths per 1 million people by the OxCGRT Policy Stringency Index (March 2020 to December 2021)
It is evident from Figure 1 that Republican states disproportionately pursued less stringent COVID-19 policies and suffered disproportionately higher COVID-19 deaths per capita.
Mississippi, Arizona, Alabama, and South Dakota are not COVID-19 success stories. They largely ignored the virus and the consequences can be measured in deaths among their residents. In contrast, Hawaii, Vermont, Maine, Alaska, Oregon and Washington seemed to do pretty well. They instituted strict COVID-19 policies which resulted in significantly fewer deaths per capita.
But Figure 1 does not consider the economic impact of COVID-19.
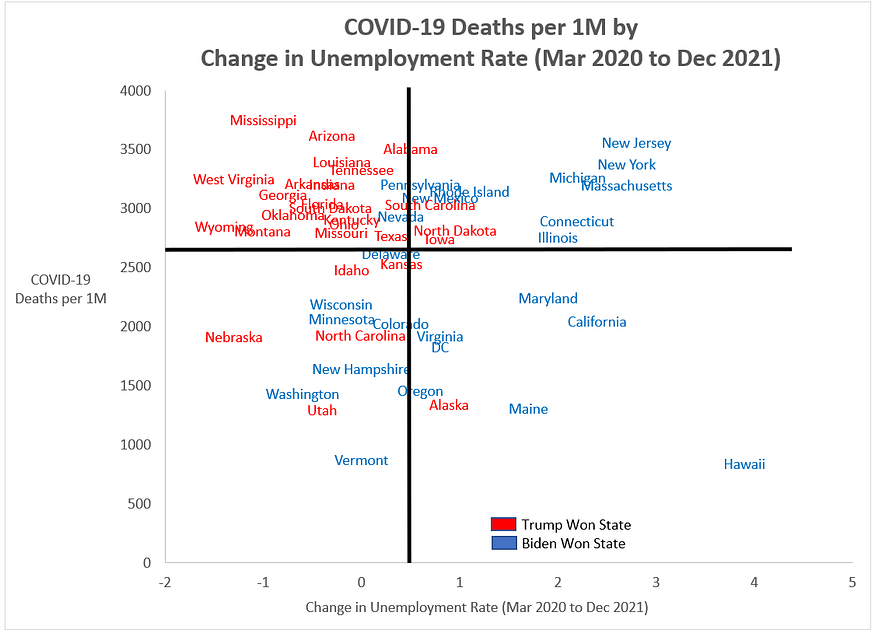
Figure 2 plots COVID-19 deaths per capita at the state-level versus the change in unemployment.
Figure 2: COVID-19 deaths per 1 million people by the Change in Unemployment Rate (March 2020 to December 2021)
Now we have a better picture as to which states performed better than others during this pandemic.
Figure 2 is quadrant analysis. The upper-left-hand quadrant (high COVID-19 death rates and small changes in the unemployment rate) and the lower-right-hand quadrant (low COVID-19 death rates and large increases in the unemployment rate) are non-exemplary cases. These states either chose to minimize the pandemic and suffered disproportionately high numbers of deaths, or chose to shutdown their economies and suffered economically.
The other two quadrants separate out the genuine failures and leaders of the COVID-19 pandemic. In the failure category are states like New York, New Jersey, Michigan and Massachusetts — all “Blue” states — who suffered high COVID-19 deaths rates and large increases in unemployment.
Their COVID-19 policies failed by any objective measure.
On the positive side are states that minimized COVID-19 deaths rates while keeping their economies relatively strong. Those states include Vermont, Utah, Washington, New Hampshire, Nebraska, North Carolina, Minnesota, and Wisconsin — three of which are “Trump” states.
It is convenient to assume “Blue” states outperformed “Red” states during the COVID-19 pandemic. If COVID-19 death rates are your preferred metric, they did. But when considering the impact of COVID-19 policies on state economies, the biggest failures were, by far, some of the biggest “Blue” states and a meaningful percentage of the successful states were “Red.”
Mississippi and Arizona kept their economies open (and successful) during the pandemic and paid a significant price in human lives.
In contrast, Hawaii, Maine, California and Maryland shut their economies down during the pandemic and saved many lives in the process.
Who was right and who was wrong?
In the end, voters will decide which states pursued the best COVID-19 policies…but don’t assume voters will choose human lives over economic growth.
Unfortunately, Dr. Fauci, like the rest of the medical and scientific community, has been more hostage to the coronavirus than a prescient sage as to its future trajectory.
Like a broken analog clock, Dr. Fauci may be right this time, but what a price the world continues to pay for a virus whose behavior often has been unpredictable and whose origins still remain unknown.
However, getting more attention than Dr. Fauci’s declaration about the next phase for COVID-19 was a working paper (i.e., not peer-reviewed) by three economists who conducted a meta-analysis on the effects of public policy on COVID-19 mortality. In this study, economists from Johns Hopkins University, Lund University (Sweden), and the Center for Political Studies in Copenhagen, Denmark — Jonas Herby, Lars Jonung, and Steve H. Hanke — found that “lockdowns in Europe and the United States only reduced COVID-19 mortality by 0.2 percent on average.”
Apart from the predictable efforts by news media elites to smear the credentials of the study’s authors and the intellectual value of a non-peer-reviewed working paper, sober academics and medical experts found the study interesting but far from conclusive. [For example, the study only covered outcomes during 2020.]
Dr. Vinay Prasad, MD MPH, offers a balanced perspective on the this new lockdown study: “(This) early meta-analysis suggests (lockdowns) didn’t do that much. I don’t find it that incredible but I also think it’s not the right moment to do a meta-analysis because the lockdown’s effect is a massive perturbation on the economy and society (and) it’s not just about the short-run mortality. What about the long-run mortality? What about the mortality you’re paying for down the road because of all the disruptions to society?”
A common analytic tool employed in the studies analyzed by Herby, Jonung, and Hanke was Oxford University’s Covid-19 Government Response Tracker (OxCGRT) which collects systematic information on policy measures that governments have taken to tackle COVID-19. Included in their tracking data is a “stringency index” summarizing these policy measures for each U.S. state which is computed on a daily basis and made available to the public on GITHUB.
According to the creators of the OxCGRT Stringency Index, the index summarizes the strictness of COVID-19 policies that primarily restrict people’s behavior, including containment, closure, economic, health system and vaccination policies.
[All variables used in this analysis are available in my personal GITHUB repository or can be obtained directly from the original sources listed at the bottom of Figure 2.]
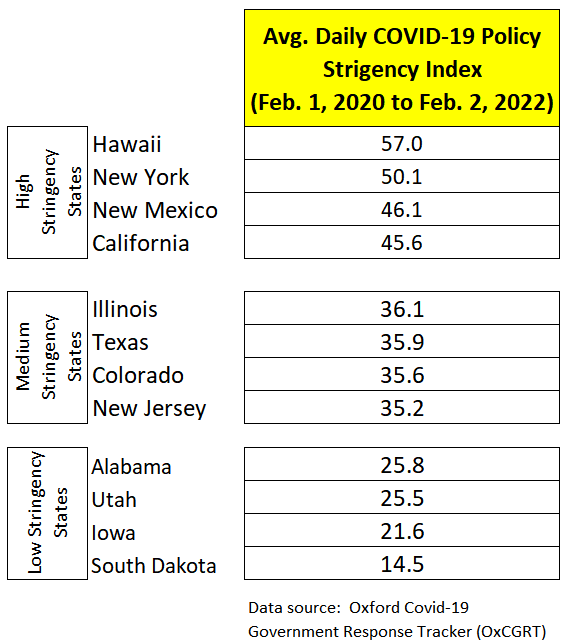
Figure 1 shows 12 selected U.S. states to represent three levels of the stringency index (High Stringency States, Medium Stringency States, and Low Stringency States).
Figure 1: Stringency Index scores for selected U.S. states from February 1, 2020 to February 2, 2022
On its face, the OxCGRT Stringency Index appears to strongly correlate with a common understanding of the states that have implemented restrictive COVID-19 policies and those that did not during this two-year pandemic.
A linear model of state-level COVID-19 death rates
Is there any evidence that stringent state-level COVID-19 policies helped reduce death rates?
Since it is unwise to make causal statements in the context of a linear model using aggregated, cross-sectional data, the answer is an emphatic ‘maybe.’ But the associations in the state-level COVID-19 data are strong enough to increase the plausibility of such conclusions.
[In general, I tried to avoid causal statements in this essay and preferred to use terms such as ‘association’ and ‘correlation.’]
Using the variables displayed in Figure 2, I estimated a linear model to explain state-level variations (51 cases) in the number of COVID-19 deaths per 1 million people.
[Model estimates and diagnostic measures can be seen in the Appendix below. More detailed diagnostics are available upon request.]
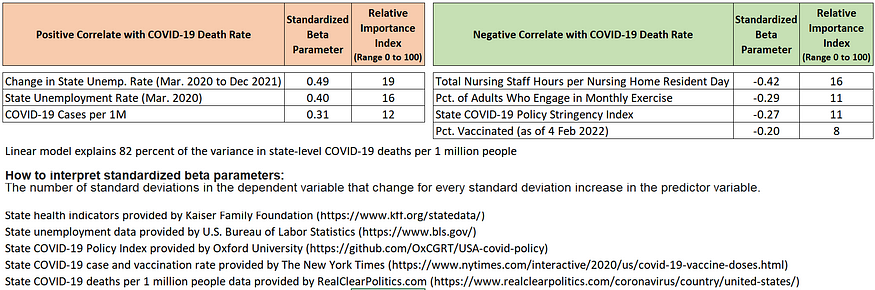
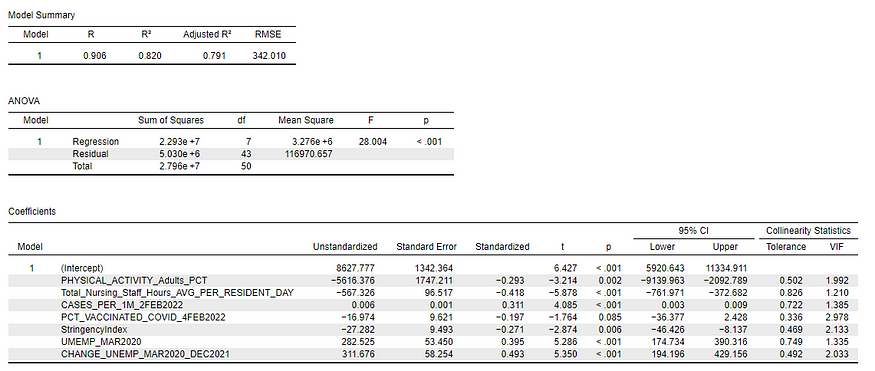
Figure 2: The relative importance of predictor variables on state-level COVID-19 death rates from February 1, 2020 to February 2, 2022
According to the linear model, state-level unemployment rates at the beginning of the pandemic, changes in those unemployment rates between March 2020 and December 2022, and the number of confirmed COVID-19 cases (per 1 million people) are positively associated with higher state-level death rates. In other words, states with relatively weak economies heading into the pandemic and states that experienced the most economic stress during the pandemic have significantly higher death rates. In fact, they are the two variables most associated with COVID-19 death rates.
But what factors helped to lower state-level COVID-19 death rates?
Among those factors which associate with lower state-level death rates, the number of nursing staff hours per nursing home resident day appears to be the strongest, followed by aggregate measures of people’s exercise habits, the strictness of COVID-19 policies, and a state’s vaccination rate.
By interpreting the standardized regression coefficients in Figure 2, the concrete impact of the predictor variables are stunning.
For example, given that state-level COVID-19 death rates have a standard deviation of 740 deaths per 1 million people, a one standard deviation increase in the unemployment rate change associates with an increase of 363 deaths per 1 million people (or about 117,600 nationally if the unemployment rate change is applied to all 50 states and the District of Columbia).
If every state entered the pandemic with a higher unemployment rate by one standard deviation, the COVID-19 death rate might have been higher by 296 deaths per 1 million (or about 96,000 people).
By comparison, a one standard deviation increase in the stringency index associates with 200 fewer deaths per 1 million people (or about 65,000 people nationwide).
Cautionary note: Due to the high level of collinearity between state-level vaccination rates and COVID-19 stringency policies, it is preferable not to interpret their standardized coefficients separately and more instructive to combine these parameters to estimate their combined impact.
When we do that, it appears the reduction in COVID-19 deaths rates associated with higher vaccination rates and stronger COVID-19 policies is comparable in their impact to similar changes in unemployment rates.
The implication is that policymakers in the future would be smart to explicitly weigh the potential costs and benefits of those COVID-19 policies before making decisions. Through their impact on state economies, strict COVID-19 measures (such as lockdowns) have the potential to kill as many people as they save.
Final thoughts
A complete analysis of the impact of policy choices on COVID-19 death rates should also consider “collateral” deaths, which are deaths not directly related to COVID-19 but the result of strains on hospital resources such as ICU bed utilization rates and staffing availability.
This analytic augmentation would bring to the forefront the question of the total impact of the unvaccinated on state-level death rates.
In other words, the unvaccinated not only increase their personal risk of dying from COVID-19, but they increase the probabilities that other people will die of other causes when hospital and ICU beds are filled to capacity.
How many collateral deaths should be added to the current U.S. COVID-19 death count of almost 950,000 people?
A credible estimate of collateral deaths comes by way of a statistical model computed at the Centers for Disease Control and Prevention (CDC) which calculates the number of “excess” deaths occurring in the U.S. each week. Through these models, the CDC estimates “excess” deaths caused by COVID-19 and “excess” deaths by other causes.
Since the widespread availability of the COVID-19 vaccines after March 2021, the CDC estimates almost 80,000 non-COVID-19 “excess” deaths have occurred through January 1, 2022, almost all of which occurred during COVID-19 surge periods when the most stress was placed on hospital resources (beds, staff availability, etc.). Even if we deduct the probable impact of vaccinated people hospitalized for COVID-19 during this period, the unvaccinated still account for about 66,000 collateral deaths, according to the CDC numbers.
That is a big number which accounts for around three percent of all U.S. deaths during that period, or about 270 collateral deaths per day.
When President Biden said last July that anti-COVID-19 vaccine propagandists are “killing people,” he was articulating what most fully vaccinated Americans believe — the unvaccinated are indirectly guilty of killing thousands of their fellow citizens.
Was he right in saying that?
In a simplistic sense, yes, but not if one rightfully considers why so many Americans remain skeptical of the COVID-19 vaccines, effective as they are in preventing severe illness from the virus.
As I’ve written elsewhere, despite my own aggressive eagerness to vaccinate myself and my family, I understand why many people are resistant to receiving these vaccines.
The reasons are easy to list:
(1) The COVID-19 mRNA vaccines are based on a new technology with debatable levels of long-term research to add confidence in their widespread use,
(5) Two scientists from the Food and Drug Administration’s vaccine advisory committee resigned last year over what they believed to be a rushed (‘political’) decision to recommend booster shots in relatively young populations. Writing with a group of other scientists in a September 2021 Lancet editorial, they said: “Although the benefits of primary COVID-19 vaccination clearly outweigh the risks, there could be risks if boosters are widely introduced too soon, or too frequently, especially with vaccines that can have immune-mediated side-effects (such as myocarditis, which is more common after the second dose of some mRNA vaccines [footnote],or Guillain-Barre syndrome, which has been associated with adenovirus-vectored COVID-19 vaccines [footnote]). If unnecessary boosting causes significant adverse reactions, there could be implications for vaccine acceptance that go beyond COVID-19 vaccines. Thus, widespread boosting should be undertaken only if there is clear evidence that it is appropriate.
According to Dr. Prasad, as yet, there is no persuasive evidence suggesting that boosting is necessary in healthy people between the ages of 12 and 50.
I don’t expect unvaccinated Americans are closely following the scientific debates over COVID-19 vaccines in medical journals, but I am constantly amazed in my interviews with the unvaccinated how often they possess at least a basic familiarity with some of the more complicated issues within the vaccine research community (e.g., myocarditis).
Yes, misinformation is abound about COVID-19 in the cyberverse — but so is a lot of valid information finding its way into the everyday conversations people have over these vaccines and the COVID-19 pandemic in general.
Some people want to assume the unvaccinated are stupid. I believe the exact opposite is true — they are awash in information and given their overactive levels of distrust and skepticism, are over-thinking what should be a fairly simple decision.
Furthermore, I find it immoral to incriminate the unvaccinated when other European countries with a similar percentage of unvaccinated still have a substantially lower number of COVID-19 deaths per capita.
And, yet, when we observe countries with similar vaccination rates to the U.S., they have substantively lower COVID-19 death rates:
Netherlands — 71% vaccination rate (1,242 deaths per 1M) Greece — 69% vaccination rate (2,300 deaths per 1M) Switzerland — 68% vaccination rate (1,532 deaths per 1M) Austria — 68% vaccination rate (1,624 deaths per 1M) Israel — 66% vaccination rate (1,066 deaths per 1M) U.S. — 65% vaccination rate (2,882 deaths per 1M)
Why are they doing better?
It is still too early to draw strong conclusions when the pandemic is ongoing. But early research is finding that a health care system’s characteristics have helped some countries better handle the exigencies of the COVID-19 crisis.
The U.S. health care system is left wanting on these factors.
As evidence, since 1960, the U.S. has seen a consistent decline in the number of hospital beds per 1,000 people. According to World Bank data, the U.S. went from 7.9 hospital beds in 1970 to 2.9 in 2017.
The U.S. clearly wasn’t preparing for a future pandemic when it allowed so many rural hospitals to close over the past 50 years.
When comparing the European countries with similar COVID-19 vaccination rates to the U.S. by the number of hospital beds per one thousand people, the U.S. comes in dead last, according to the World Bank:
Netherlands — 3.2 hospital beds per 1K Greece — 4.2 hospital beds per 1K Switzerland — 4.6 hospital beds per 1K Austria — 7.3 hospital beds per 1K Israel — 3.0 hospital beds per 1K U.S. — 2.9 hospital beds per 1K
But it is not just hospital beds that put the U.S. at a disadvantage in handling the coronavirus pandemic, it is a health care system in which job loss and financial insecurities drive too many citizens to forgo early and sometimes life-saving medical care.
The U.S. was not pandemic-ready in early 2020, and that is not the fault of the unvaccinated — it is the fault of our political, news media, health insurance, and medical community leadership.
Before shaming and blaming the unvaccinated — which doesn’t vaccinate one person and most likely leads to greater resistance to the jab — would it not make more sense to address the structural problems in a health care system where the most economically vulnerable suffer disproportionately during a national health crisis?
If anything, we all share in the blame for a national health care system that has been outperformed by Mexico in the COVID-19 pandemic (2,823 deaths per 1M vs 2,386 deaths per 1M, respectively). If we were doing as well as Mexico — where about 60 percent of its citizens are fully vaccinated — the U.S. would have 144,000 fewer deaths right now.
But it is so much easier just to blame the unvaccinated.
K.R.K.
Send comments and data requests to kroeger98@yahoo.com
Appendix: Linear model estimates and selected diagnostics.
By Kent R. Kroeger (Source: NuQum.com; February 6, 2022)
A popular political narrative in the U.S. news media is the story of a deeply polarized electorate where voters restrict their news consumption to partisan-friendly sources, avoid dissenting viewpoints, and remain loyal to their preferred party.
A November 2021 report by Pew Research summarizes this political landscape: “Partisan polarization remains the dominant, seemingly unalterable condition of American politics. Republicans and Democrats agree on very little — and when they do, it often is in the shared belief that they have little in common.”
In such a political landscape, major legislative compromises become rarer and important domestic and international problems remain unsolved.
Roll Call writer Stuart Rothenberg echoes this viewpoint: “Partisan polarization with two relatively equal parties takes its toll on the country and on voters. It is difficult for Washington to address important issues, since each side can essentially veto what the other wants to accomplish. And it breeds distrust of the opposition’s motives and allegiances.”
Gridlock isn’t all bad, however: Corporate America flourishes in this environment as tax and regulatory policies are more predictable since major changes to them are less likely — but that is an issue for a different essay.
How can we lessen our political divide?
One hypothesis on how our partisan divide will lessen over time — and thereby start the process to solve our nation’s most intractable problems (e.g., economic inequality, rising public debt, addressing climate change, rising health care costs, etc.) — assumes secular trends in national demographics will over time benefit one party (the Democrats) to the disadvantage of the other (the GOP).
Others political observers theorize that the paralyzing effects of extreme partisanship and political gridlock could give rise to a reform movement that crosses political lines and values compromise and civility over partisan rancor.
Writes Rothenberg: “…the resulting paralysis could eventually produce a reform movement — either inside one party or outside of the two parties — that would place a high priority on political compromise, civility and the rule of law.”
Political scientists Robert Putnam and Shaylyn Romney Garrett offer a more detailed description of this argument in their 2020 book The Upswing in which they argue our current political environment mirrors the Gilded Age (1890s) in terms of the conditions that preceded a long era of political consensus and reform — the Progressive Era (1896–1916).
The past is prologue, in their view.
How real is the partisan echo chamber?
Any conjecture on how this country will rediscover political harmony, however, must contend with a highly politicized media environment in which, according to some observers, few voters ever read or hear enough opposing points of view necessary to change their own points of view.
Still, on average, conservative Republicans are more likely to watch Fox News while Democrats turn to CNN or MSNBC.
But is this characterization accurate?
Based on evidence from the 2020 American National Election Study (ANES), I conclude that the partisan echo chamber assumption is inaccurate and misrepresents a common tendency among Americans to watch, listen and read news from more than one partisan perspective.
While 48 percent of Americans do not regularly watch cable TV news (CNN, MSNBC, or Fox News), the other 52 percent do so and most of them do it across the partisan spectrum, according to the 2020 ANES.
Any attempt to explain the growth in political polarization (or conjecture how to lessen it) cannot rely on the belief that most voters lack exposure to alternative points of view as expressed in the news media. Most Americans who regularly consume cable TV news do so from media outlets across the political divide.
The partisan echo chamber is more myth than reality
The 2020 ANES asked 8,280 U.S. adults which television programs they regularly watch at least once a month. Using that information, I defined three cable TV news viewer categories based on whether they regularly watch at least two news shows on that network each month. Accordingly, a Fox News Viewer is someone who watches at least two Fox News shows each month, a CNN News Viewer watches at least two CNN shows each month, and an MSNBC Viewer watches at least two MSNBC shows each month.
[Note that the three viewing groups as I defined them— Fox News viewers, CNN viewers, and MSNBC viewers — are not mutually exclusive categories. Some ANES survey respondents belong to two or more of those groups.]
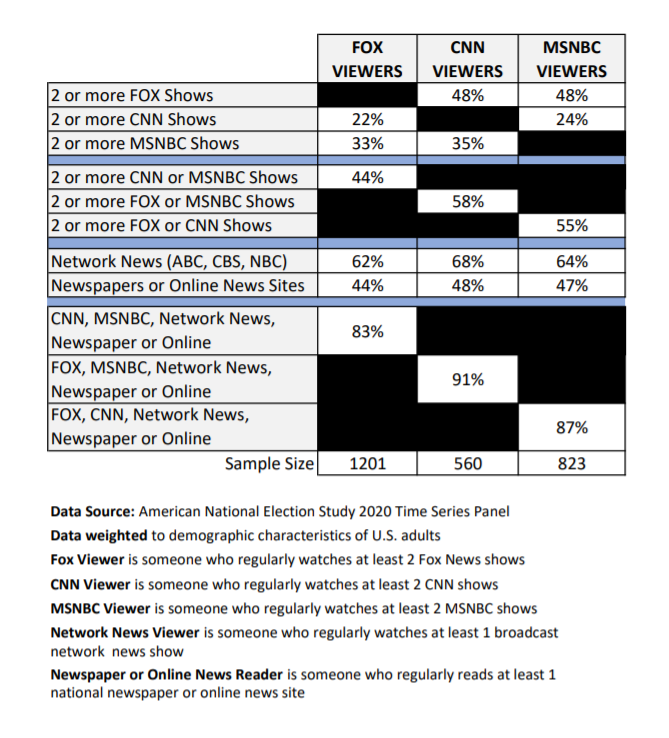
Figure 1 (below) shows the extent to which these three cable TV news viewing groups watch other cable TV news networks. If you believe most Americans who watch cable TV news limit their viewing to sources aligned with their personal political views, the following results are enlightening.
In reality, 22 percent of Fox News viewers regularly watch two or more CNN shows and 33 percent watch two ore more MSNBC shows. Likewise, 48 percent of CNN and MSNBC viewers regularly watch two or more Fox News shows.
Forty-four percent of Fox News viewers regularly watch two or more CNN or MSNBC shows.
Figure 1: Cross-network viewing among regular viewers of the three cable TV news networks (Fox, CNN, and MSNBC)
If we expand our news universe to the broadcast networks (CBS, NBC, ABC, PBS) and online news sites (Bloomberg News, Huffington Post, NPR, New York Times, USA Today, Washington Post, and Yahoo News), 83 percent of Fox News viewers tap into these news sources on a regular basis, compared to 91 percent of CNN viewers and 87 percent of MSNBC viewers.
The oft-repeated assumption that the average Fox News viewer lives in a (mis)information bubble that reinforces pro-Republican, conservative talking points is wholly inaccurate. Surprisingly, Fox News viewers routinely reach across the ideological divide for their cable news consumption, as do half of CNN and MSNBC viewers.
The 2020 ANES media consumption data do not allow for a comprehensive volumetric analysis but it still offers tangible evidence refuting the assumption that Americans live in their own personal “news and information bubble.”
Most Americans who routinely consume cable TV news do so by distributing their consumption across the mainstream political spectrum.
The strange interactions of Fox News, CNN and MSNBC viewership
If we sum the number of cable TV news network shows regularly watched by network for each 2020 ANES respondent, we can roughly approximate their viewing volume.
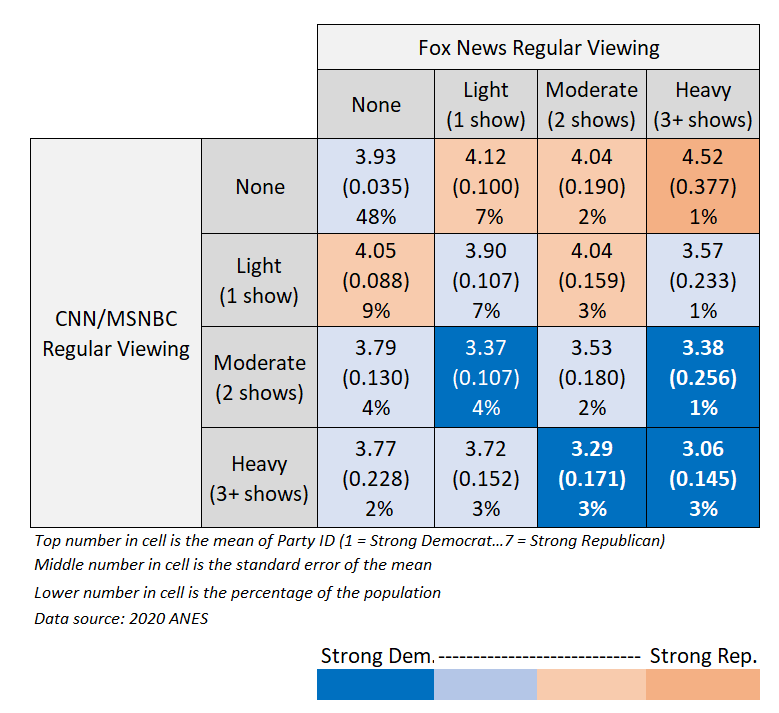
Thus, I categorized Fox News and CNN/MSNBC viewers into one of four volumetric categories: No Cable TV news viewing (0 shows), Light viewing (1 show), Moderate viewing (2 shows) or Heavyviewers (3 or more shows). I then crossed their cable news viewing status with their party identification (Party ID), which was measured on a 7-point scale where 1 = Strong Democrat and 7 = Strong Republican. Hence, any cell in Figure 2 with an average Party ID over 4 is considered to be “Republican-leaning,” while an average below 4 indicates “Democrat-leaning.”
The results of this analysis (in Figure 2) are illuminating, as well as puzzling.
First, as seen in the upper-left-hand cell in Figure 2, almost half of Americans (48%) do not watch CNN, MSNBC or Fox News.
Figure 2: Cross-network viewing among regular viewers of the three cable TV news networks (Fox, CNN, and MSNBC)
Concentrating on the first row in Figure 2 (i.e., people who do not regularly watch CNN or MSNBC), as regular viewing of Fox News increases, the probability of being a strong Republican also increases. Among heavy Fox News viewers who do not watch CNN or MSNBC, the average Party ID is 4.52 — the strongest Republican group among the 16 cells in Figure 2. That makes intuitive sense.
Also notice that only one percent of U.S. adults are heavy Fox News viewers who do not watch any CNN or MSNBC shows. But if we look at the counterpose cases in the first column of Figure 2 (i.e., people who do not regularly watch Fox News), there is not a clear linear trend in Party ID. Light CNN/MSNBC viewers who do not watch Fox News skew slightly Republican (avg. Party ID score = 4.05), but among heavy CNN/MSNBC viewers, the average Party ID score decreases to 3.77 — a difference that is not statistically significant, but is in the expected direction.
But now where things get strange…
Column 4 in Figure 2 contains heavy Fox News viewers (3+ shows). As noted, the most Republican group in Figure 2 is heavy Fox News viewers who do not watch CNN or MSNBC. No surprise there.
Also expected, as CNN/MSNBC viewing goes up, the average Party ID becomes more Democrat — going from an average Party ID score of 4.52 to 3.06 in the bottom right-hand cell.
But among heavy CNN/MSNBC viewers (the fourth row in Figure 2), the average Party ID gets progressively more Democrat as we increase Fox News consumption, going from a score of 3.77 (heavy CNN/MSNBC viewers who do not watch Fox News) to a significantly lower score of 3.06 among people who are heavy viewers of CNN/MSNBC and Fox News.
What the heck?! Among CNN/MSNBC viewers, increased Fox News viewing is associated with an increased chance of someone being a strong Democrat?
My first reaction is to assume I coded the variables wrong. But after a series of check-double-check routines, I could not find a coding mistake (Note: My SPSS code and dataset are available on GITHUB here — feel free to double check my work).
My second hunch is that we are looking at ‘News Junkies’ in the lower right-hand cell and perhaps they are just more likely to be strong Democrats than strong Republicans. But what social or pyschology theory explains that asymmetry?
Earlier in this essay I cited a 2018 study that found political partisans who are exposed to opposing viewpoints on social media tend to, on average, become more partisan. The authors of the study write: “Republican (study) participants expressed substantially more conservative views after following a liberal Twitter bot, whereas Democrats’ attitudes became slightly more liberal after following a conservative Twitter bot — although this effect was not statistically significant.” Explanations these researchers offered to explain their results included:
(1) A ‘backfire’ effect where “people who are exposed to messages that conflict with their own attitudes are prone to counterargue them using motivated reasoning, which accentuates perceived differences between groups and increases their commitment to preexisting beliefs.”
(2) the relative anonymity of social media “emboldens people to act in an uncivil manner…in the absence of facial cues and other nonverbal gestures that might prevent the escalation of arguments in offline settings” and thereby reinforces preexisting partisan preferences.
(3) An asymmetric version of the ‘backfire” effect where, because conservatives hold values that prioritize certainty and tradition, compared to liberals who value change and diversity, conservatives are more likely to act defensively to opposing information.
All of these explanations sound a bit hobbledy-gobbledy-goo to me, but until I hear better ones, I’ll accept their hypotheses.
But if I could offer my own hypothesis as to why this ‘backfire effect’ might operate more on Democrats more than on Republicans, it would go something like this:
Mainstream media content, especially within entertainment TV, movies, music, etc., is overwhelmingly oriented towards liberal social values and narratives. The natural consequence of this intrinsic bias is that anyone who increases their media consumption will get their liberal beliefs reinforced more often than someone with conservatives beliefs. That there are people who are heavy viewers of CNN/MSNBC and Fox News — an apparent contradiction — may simply be an artifact of their heavy consumption of all media.
The ANES 2020 data on media consumption lacks the breadth and fidelity to address these hypotheses as to why increased Fox News viewing might increase partisan polarization among Democrats, but increased viewing of CNN/MSNBC among Republicans might soften the partisan divide.
I suspect the mechanisms at play are far more profound than simply assuming CNN and MSNBC are persuasive while, to the sane, Fox News comes across as batshit crazy. As I hope I’ve demonstrated over the years I’ve written about politics and news, there is plenty of batshit crazy to go around for both political parties and their propaganda outlets.
Final thoughts
The main thesis of this essay is that a significant number of Americans do not live in a partisan media bubble, though a near majority eschew cable news in general. Notably, the vast majority of regular Fox News viewers consume news across the political divide. Likewise, almost half of CNN/MSNBC viewers watch Fox News on a regular basis.
The partisan echo chamber is more myth than reality.
As a result, there remain substantive avenues through which partisan political actors and their surrogates can create significant opportunities for opinion change within the voting public.
However, even with this potential for persuasion to occur, it may be more likely to benefit the Democrats than Republicans. The 2020 presidential election may be the textbook example of this dynamic.
In a study of the 2020 presidential election conducted by Harvard University’s Shorenstein Center on Media, Politics, and Public Policy, a content analysis of CBS News and Fox News coverage of the presidential election found that almost 90 percent of CBS’s statements towards Joe Biden were positive, while only five percent were for Donald Trump. Conversely, Fox News was positive towards Biden and Trump at roughly the same rate (41 and 42 percent, respectively).
From the ANES 2020 data, we know that many loyal Fox News viewers were exposed directly to CBS News’ 2020 election coverage, as well as coverage from other establishment news outlets with a discernable anti-Trump bias (e.g., CNN and MSNBC).
Could this have had an effect on the 2020 outcome, not just by discouraging voter turnout among weak Trump supporters (and encouraging turnout by weak Biden supporters), but also through genuine opinion change?
Since a large number of Americans do not live in the oft-assumed partisan echo chamber, the answer to this question is likely Yes!