By Kent R. Kroeger (Source: NuQum.com; July 6, 2021)
“Our political opinions and attitudes are an important part of who we are and how we construct our identities. Hence, if I ask your opinion on health care, you will not only share it with me, but you will likely resist any of my attempts to persuade you of another point of view,” New York University psychologists Philip Pärnamets and Jay Van Bavel wrote in Scientific American in 2018.
Pärnamet, Van Bavel and their associates at Lund University in Sweden had previously found that manipulating a person’s opinions and attitudes is not as difficult as sometimes thought in today’s highly partisan environment, and once changed, these new opinions and attitudes can be surprisingly durable.
In their study, after giving study participants false-feedback on one of their opinions — for example, telling a participant they had indicated their opposition to raising taxes when, in fact, they had said they supported raising taxes — the researchers offered them a chance to give an argument for their “new” opinion without fearing they would be criticized for it. It turned out that the act of rationalizing this “new” belief in a non-judgmental context made it more durable over time.
“When it comes to the actual political attitudes we hold, we are considerably more flexible than we think,” according to New York University psychologists Philip Pärnamets and Jay Van Bavel. “People have a pretty high degree of flexibility about their political views once you strip away the things that normally make them defensive.”
In other words, remove a person’s feeling of needing to defend their ideas from criticism, they are more open to alternative ideas.
Conversely, unwillingly expose someone to an opposing opinion and they are likely to erect defensive barriers to it and, in turn, become more entrenched in their original belief. [I suspect that is the reason I lose a few Facebook friends every time I post a video excerpt from Tucker Carlson Tonight.]
This is good and well, but the dominant (non-Fox News) media narrative was that, after four years of a near constant drumbeat of negative news coverage, Trump’s popularity was near an historical low-point for an incumbent president and, subsequently, the vast majority of Americans had already made up their minds about him.
Axios’ Neal Rothschild laid out the facts supporting that narrative in a Sept. 2020 article:
A wealth of evidence suggests more Americans have made up their minds by this point compared with years past:
The conventions had practically no impact on the shape of the race: Biden’s national polling lead (+7.5 per FiveThirtyEight’s average of polls) is just a half-point smaller than it was a month ago.
Just 3% of likely voters said they didn’t know who they’d vote for in a recent national Quinnipiac poll. The same percent of registered voters said they were undecided in a Monmouth poll this week.
An August poll by the Pew Research Center found that among those who preferred Biden or Trump, just 5% said there was a chance they’d change their minds.
Compare that to Pew’s poll in August 2016, which found that 8% of Hillary Clinton’s supporters said there was a chance they might vote for Trump. Similarly, for those who preferred Trump, 8% said they might vote for Clinton.
Even in the swingiest of swing states, most people’s minds appear made up. Just 5% of Floridians say they might change their minds, according to a recent Quinnipiac poll.
Political scientists happily concurred with the ‘set in stone’ narrative heading into the 2020 general election. “There were Republicans who were undecided in 2016 but ultimately rallied to Trump,” John Sides, a political science professor at Vanderbilt, told Axios. “This year, they’re likely on board. And, if not, they jumped ship a while back.”
Rothschild and Sides were justified in their conclusions, but still wrong in the bigger picture.
To what extent did attitudes about the 2020 presidential candidates change?
Data from the 2020 American National Election Study (ANES), conducted in two waves (pre- and post-election) between August and December 2020, confirm significant numbers of vote eligible Americans changed their opinions about the two major presidential candidates during the course of the general election.
Enough that it could have changed the final outcome? Probably not. Nonetheless, it is inaccurate to suggest, even in today’s highly partisan political environment, that attitudes about Biden or Trump were largely ‘set in stone’ before Election Day.
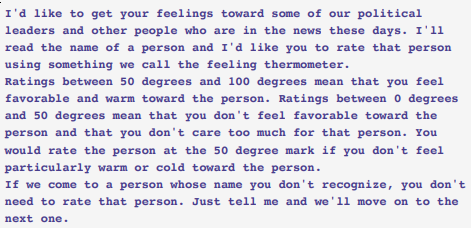
For starters, one-third of eligible voters changed their favorability rating of Trump by at least 10-points (on a 100-point scale) during the course of the general election. [The text of the ANES 2020 thermometer favorability questions are in the Appendix A.]
Among Strong Republicans, 24 percent of respondents became less favorable towards Trump during the campaign. That translates to 11.5 million Strong Republicans — three million of whom either voted for Biden (660,000) or did not vote (2.3 million!). These are potentially election outcome changing numbers, especially when an outcome change in just four closely contested states would have changed the Electoral College outcome.
Tables 1a and 1b (below) show the percentage of vote eligible Americans that changed their favorability rating by at least 10-points for Joe Biden and Trump between the general election and the post-election period.
For example, among Strong Democrats, 14 percent of ANES 2020 voters reported lower favorability ratings for Biden between the general election and post-election period, while 26 percent increased their favorability rating for him. Sixty percent reported no change in their favorability rating of Biden. Weak (‘Not Strong’) Democrats and Independents leaning-Democrat were similarly inclined to upgrade Biden.
More importantly, the percentage of Independents who upgraded Biden was significantly higher than those who downgraded him (32% versus 21%).
Among Republicans, no significant difference existed between the percentage of those who upgraded or downgraded Biden between the pre- and post-election periods.
Overall, 44 percent of eligible voters changed their favorability rating of Biden between the pre- and post-election ANES 2020 surveys.
Table 1a. Biden Favorability Change (Pre- to Post-Election)
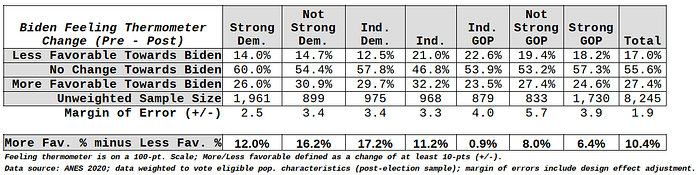
Table 1b. Trump Favorability Change (Pre- to Post-Election)
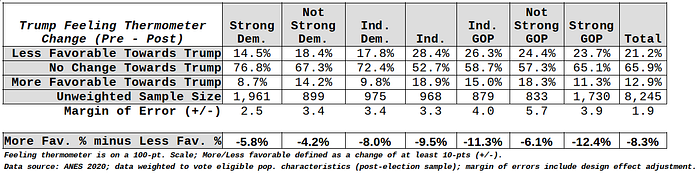
The pattern for Trump was quite different.
Across all party identification groups — with the exception of Weak (‘Not Strong’) Republicans and Weak (‘Not Strong’) Democrats — all partisan groups experienced a higher percentage of respondents who downgraded Trump versus those who upgraded him. For example, among Independents, 28 percent lowered their favorability towards Trump, while only 19 percent increased it.
Overall, 66 percent of eligible voters did not change their view about Trump over the course of the 2020 presidential campaign, compared to only 56 percent for Biden.
For many possible reasons, Biden plainly increased his favorability advantage over Trump during the 2020 general election (see Table 2a) and this advantage was significantly correlated with final vote choices (see Table 2b).
Table 2a. Mean Levels and Mean Changes in Candidate Favorability (100-point scale)

Table 2b. Correlation between Favorability Rating Gaps and 2020 Vote Choice
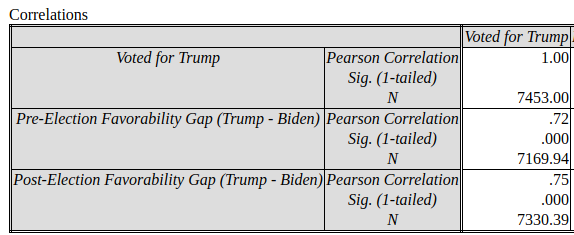
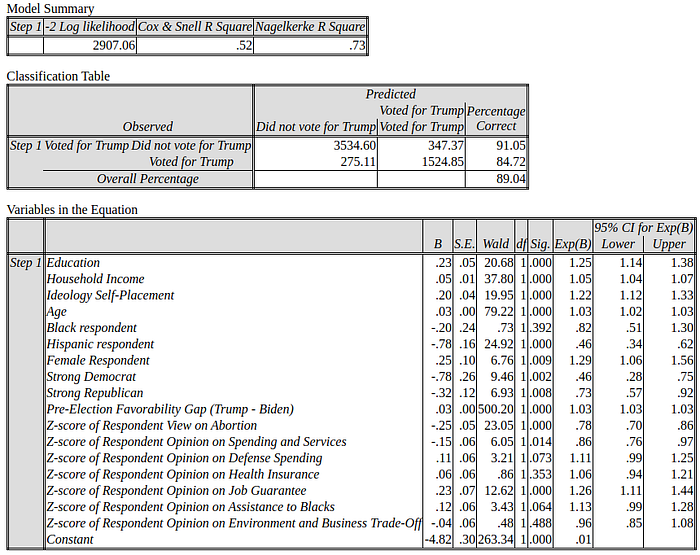
Even after controlling for key demographic characteristics (age, education, income, race, sex), party identification, political ideology, and policy attitudes (abortion, health care, job guarantee, social spending, defense spending, and environment), the favorability gap between Trump and Biden was the strongest predictor of vote choice (see in Appendix B a preliminary logistic model of the 2020 presidential vote choice).
Trump failed to tarnish Biden
A methodological note is required before moving forward…
The ANES 2020 post-election favorability question was asked after the actual election. Subsequently, how a respondent answered that question was potentially impacted by the outcome of the election. It is, therefore, dubious to draw any conclusion about the impact of a change in candidate favorability on how people voted. Our predictor variable (change in favorability ratings) is contaminated by the outcome variable (vote choice).
Nonetheless, the relationship between those two variables is informative. Tables 3a and 3b show the relationship between changes in the Biden and Trump thermometer ratings and 2020 vote choices.
In Table 3a, among the largest thermometer change group (No Change Towards Biden), 44 percent voted for Biden, compared to only 32 percent for Trump. Conversely, among those who indicated no change in favorability towards Trump, 30 percent voted for Trump, compared to 48 percent who voted for Biden (see Table 3b).
Table 3a. Biden Favorability Change (Pre- to Post-Election) by 2020 Vote Choice
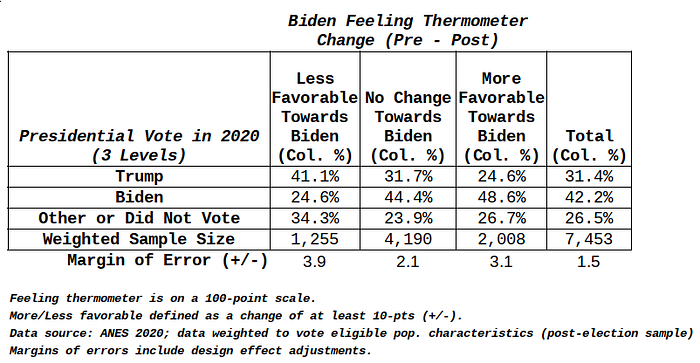
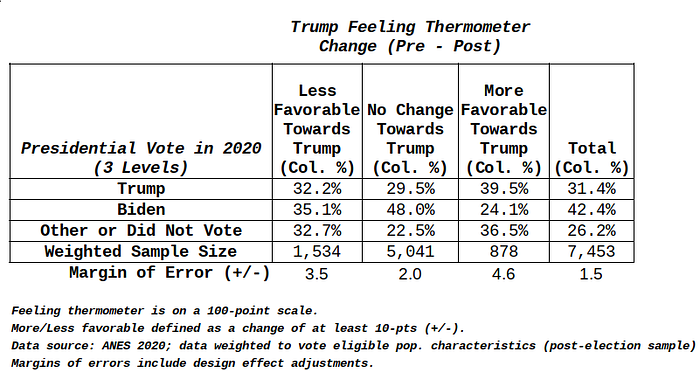
Table 3b. TrumpFavorability Change (Pre- to Post-Election) by 2020 Vote Choice
The status quo was in Biden’s favor. But what about among voters who increased their rating of Biden between the pre- and post-election periods?
Forty-nine percent of respondents who increased their rating for Biden also voted for him, compared to only 25 percent who voted for Trump — that is a 24-point gap (see Table 3a).
In contrast, 40 percent of respondents who increased their rating for Trump also voted for him, compared to 24 percent who voted for Biden — that is a 16-point gap (see Table 3b). In that same group, 37 percent did not vote for president — the highest non-voting rate among the thermometer rating change groups.
Among respondents who lowered their view of Trump during the general election, there was no significant vote share difference between Trump and Biden (32% versus 35%, respectively). Put differently, beating Trump down did not change many votes. Instead, Biden’s victory was built on the back of a status quo environment already in his favor (e.g., the COVID-19 pandemic, a weakened economy) and a general election campaign that generated additional positive feelings towards him.
The Trump campaign and Republican Party failed to convince the American voting public to dislike Biden, and it wasn’t for a lack of trying.
It is hard to see the resiliency of Biden’s popularity and not think the news media played a critical role. In a previous essay, I detailed the overwhelming advantage in tone Biden had over Trump in online news coverage during the 2020 election.
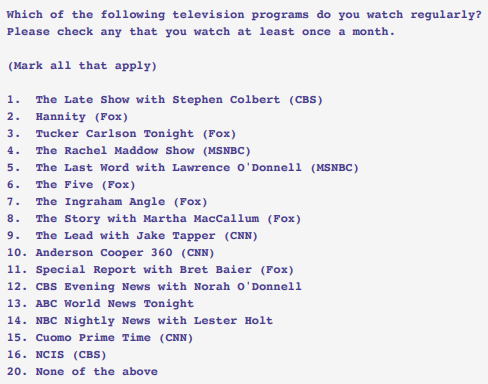
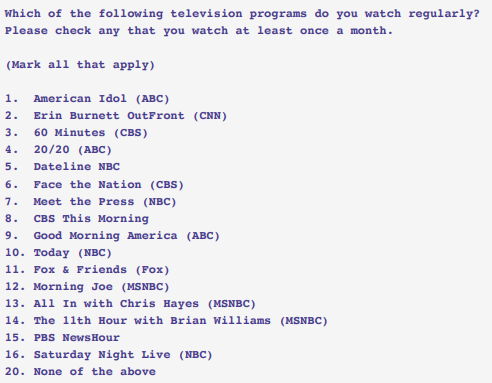
But were there any particular TV news programs disproportionately associated with Americans who changed their opinions of Biden and Trump during the campaign? Fortunately, the ANES 2020 asked respondents which TV news programs they watched regularly (question text is in Appendix A) and offers at least a preliminary look at that question.
Did some news shows matter more than others in 2020?
Quantifying media effects in political campaigns has been one of the holy grail quests of political scientists for decades. And, typically, when positive results have been found, the research has required tightly-controlled experimental designs and idealized research settings. The challenge in finding consistent, strong media effects in political campaigns is partly the result of two real-world challenges.
First, there is a mammoth selection bias problem. People do not choose their media sources randomly. The factors that drive their selection of news shows also drive their preferences for political candidates. Furthermore, we don’t have a Walter Cronkite who can suddenly voice disillusionment with the Vietnam War and bring millions of Americans along with him. Anything Rachel Maddow says on her show, her audience is most likely already with her.
Second, virtually every potential voter consumes information derived from the news media. Voters are awash in news and information. Trying to determine if a voter’s opinions are affected by the news media is akin to wondering if a fish likes water.
Despite the methodological hurdles, the ANES 2020 data does show some interesting (while admittedly small) associations in TV news program preferences and changes in 2020 candidate favorability ratings. And while these associations don’t hold up when controlling for other factors (demographics, party id, policy attitudes, etc.), the bivariate relationships show some intriguing patterns.
Table 4 shows the relationship between a change in Biden or Trump favorability and TV news programs regularly viewed. Only statistically significant associations (chi-square statistic) are indicated, either by a (+) indicating a positive association, or a (-) indicating a negative association.
For example, regular viewers of Stephen Colbert’s Late Night were more likely to have their favorability towards Trump go unchanged during the campaign, and less likely to have become more favorable towards Trump. The net effect of Late Night’s continual bashing of Trump seemed to be in enforcing status quo opinion.
Table 4. Change in Biden/Trump Favorability by Regular Viewers of Selected News Programs (Pre- versus Post-Election)
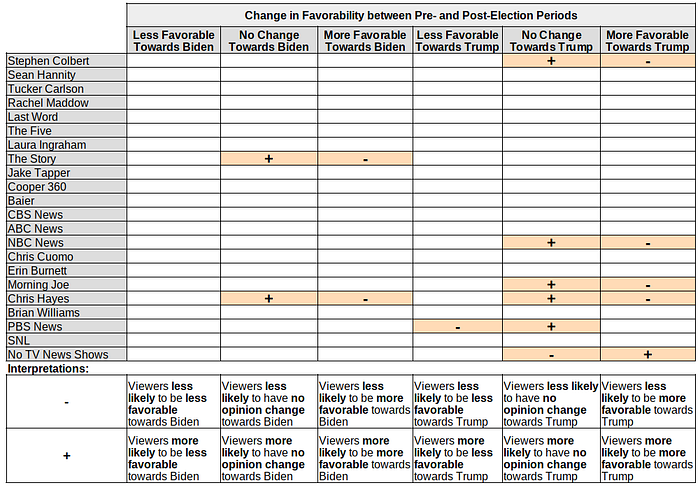
For every news programs demonstrating significant associations with Biden or Trump favorability, the association was positively related to “no opinion change.” In fact, the only positive relationship with a change in candidate favorability was between people who became more favorable towards Trump and do not watch TV news programs regularly (see bottom-right corner of Table 4).
My interpretation: To the extent individual TV news programs matter at all in elections, it is in attracting viewers who are already less inclined to change their opinions about candidates. TV news programs enforce partisan alignments and are not independent, unbiased sources for news and information.
Final Thoughts
If ever there was going to be an election where the outcome was ‘set in stone’ long before Election Day, it would have been the 2020 presidential election.
In reality, there was significant opinion change among eligible voters towards Biden and Trump in the 2020 general election, despite a relentless effort by the mainstream news media to dampen such behavior.
Research by Swedish psychologists Pärnamets and Van Bavel mentioned at the beginning of this essay has been focused on changes in policy attitudes, not candidate support, but their conclusions concerning the former are likely relevant to the latter:
“…we need rethink what it means to hold an attitude. If we become aware that our political attitudes are not set in stone, it might become easier for us to seek out information that might change them.
There is no quick fix to the current polarization and inter-party conflict tearing apart this country and many others. But understanding and embracing the fluid nature of our beliefs, might reduce the temptation to grandstand about our political opinions. Instead humility might again find a place in our political lives.”
Amen.
- K.R.K.
Send comments to: kroeger98@yahoo.com
Appendix A:
Key Questions from ANES 2020
Pre-election Favorability Question:
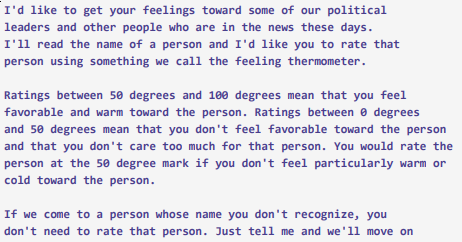
Post-election Favorability Question:
TV Show Viewing Question:
Appendix B:
Preliminary Logistic Model of 2020 Vote Choice