The U.S. may have experienced 7.7 million additional COVID-19 cases and 155 thousand additional COVID-19 deaths due to its subpar health care system.
This finding is based on a cross-national statistical analysis of 20 West European and West European-heritage countries using aggregate, country-level data provided by Johns Hopkins University (COVID-19 cases and deaths per 1 million people), OurWorldInData.org (Policy Stringency Index) and HealthSystemFacts.org (Health Access and Quality Index). The analysis covers the period from January 1, 2020 to February 5, 2021.
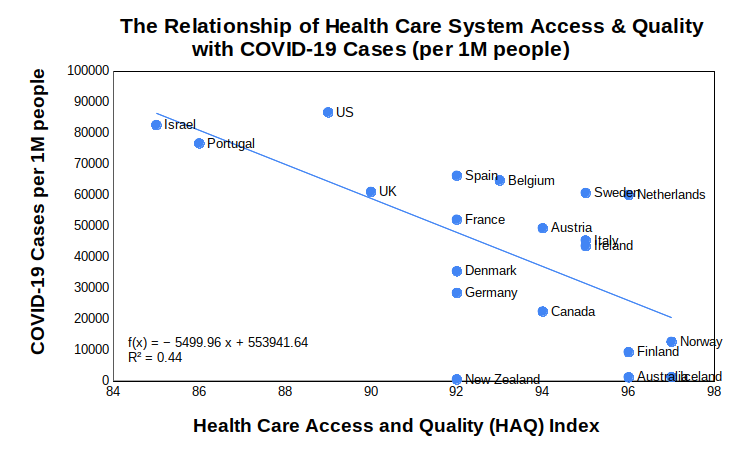
Figure 1 (below) shows the bivariate relationship between the number of COVID-19 cases (per 1 million people) and the quality of a country’s health care system as measured by the Health care Access and Quality Index (HAQ Index ) that was compiled during the 2016 Global Burden of Disease Study.
In countries where health care access is universal and of high quality, the performance on the number of COVID-19 cases per capita is much better. New Zealand, Australia, Iceland, Finland and Norway are positive exemplars in this regard. Israel, Portugal, U.S., and the U.K., in comparison, are not.
Figure 1: Health care access/quality (HAQ) and its relationship to COVID-19 cases per 1 million people
More interestingly, if over the study period we control for the average level of COVID-19 policy actions (as measured by Oxford University’s COVID-19 Government Response Tracker (OxCGRT)) and whether or not a country is an island, the significance of the quality of a country’s health care system remains significant.
As seen in this simple linear regression model, three variables — the HAQ Index, COVID-19 Policy Stringency, and whether or not the country is an island — account for about 60 percent of the variance in COVID-19 cases per capita for these 20 countries.
Using this model, we can estimate the number of COVID-19 cases (per 1 million people) the U.S. would have experienced if its health care system was as good as the countries rated as having the best health care systems in the world (Iceland and Norway — HAQ Index = 97).
[Note: U.S. has approximately 330 million people and its HAQ Index = 89]
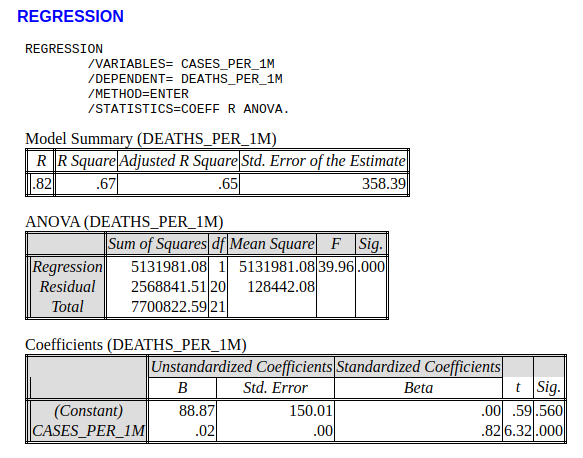
Additionally, as there is a strong relationship between the number of COVID-19 cases per capita and the number of COVID-19 deaths per capita (i.e., roughly 0.2 deaths per case — see Appendix), we can estimate that the U.S. has experienced 155,560 additional deaths as a result of inadequacies with its health care system.
The U.S. does not have the best health care system in the world
Remarkably little discussion within the national news media has been about the systemic problems within the U.S. health care system and how those problems contributed to the tragic COVID-19 numbers witnessed by this country during the pandemic. Where most of the media attention has been focused on political failures associated with the COVID-19 pandemic — and most of that has been directed at the Trump administration — the hard evidence continues to suggest systemic factors, such as racial disparities in socioeconomics and health, are driving U.S. COVID-19 case and death rates above other developed countries.
“Socioeconomically and racially segregated neighborhoods are more vulnerable and are more likely to be disproportionately impacted by the adverse effects of COVID-19,” conclude health analysts Ahmad Khanijahani and Larisa Tomassoni. As for why this is the case, Khanijahani and Tomassoni offer this explanation:
“Black and low-SES individuals in the US are more likely to be employed as essential workers in occupations such as food distribution, truckers, and janitors. Most of these jobs cannot be fulfilled remotely and usually do not offer adequate sick leaves. Additionally, individuals of low-SES and Black minority are disproportionately impacted by homelessness or reside in housing units with limited space that makes the practice of isolating infected family members challenging or impossible. Moreover, limited or no child/elderly care and higher uninsurance rates impose an additional financial burden on low-SES families (emphasis mine) making it challenging to stop working.”
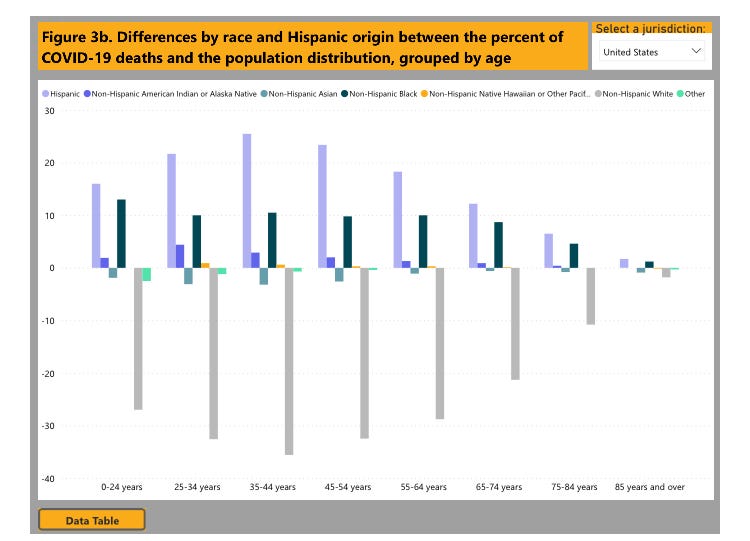
Figure 2: Racial/ethnic disparities in COVID-19 deaths in the U.S. (Source: CDC)
The gray bars in Figure 2 show how non-Hispanic Whites across all age categories have experienced fewer deaths than expected relative to their prevalence in the total U.S. population. In stark contrast, across all age groups, Hispanic and non-Hispanic Blacks account for a significantly higher percentage of COVID-19 deaths than expected based on their population numbers.
Figure 2 is what a broken health care system interacting with systemic racial and ethnic inequalities looks like in a chart.
Final thoughts
Citing the negative role of the U.S. health care system on COVID-19 outcomes is not an indictment of U.S. health care workers. To the contrary, because Americans live in a country where health care is significantly rationed by market forces — e.g., a relatively high rate of uninsured, people delaying preventative care, diagnoses and treatments due to financial concerns, etc. — our health care workers are forced to work harder as a high number of COVID-19 patients enter the health care system only after their symptoms have already become severe.
The awful impact of the COVID-19 pandemic on Americans is less a political failure than it is a systemic failure —though we cannot dismiss the ineptitude of politicians like New York Governor Andrew Cuomo who, presumably at the behest of his health policy experts, authorized sending critically ill seniors from hospitals to nursing homes in order to free up hospital beds. New York’s elderly paid a steep price so Governor Cuomo could learn that nursing homes are not hospitals.
More broadly, the COVID-19 pandemic exposed a broken and inadequate U.S. health care system that is better designed to protect high profit margins for insurance and pharmaceutical companies and the billing rates of physicians than it is to ensure the health of the American people.
Sadly, with the physician, health insurance and pharmaceutical lobbyists firmly entrenched in the policymaking machinery of the Biden administration, don’t expect any time soon the types of health care system reforms needed to fix our systemic problems.
K.R.K.
Send comments to: nuqum@protonmail.com
Methodological Note:
The decision to analyze just 20 West European and West European-heritage countries (i.e., U.S., Israel, Canada, Australia, and New Zealand) was prompted by a desire to control for two factors that are significantly related to country-level COVID-19 outcomes: (1) cultural norms, and (2) economic development.
Controlling for cultural norms, particularly the differences between countries with individualistic cultures (i.e., Western European nations) and those with collectivist cultures (i.e., East Asian nations), facilitated a clearer look at the impact health care systems on COVID-19 outcomes.
As for the exclusion of lesser-developed countries from this analysis, I simply don’t trust the accuracy or completeness of their COVID-19 data.
APPENDIX — A Linear Model of COVID-19 Deaths (Per 1 Million People)
By Kent R. Kroeger (Source: NuQum.com; February 11, 2021)
There is no weenier way of copping out in data journalism (and social science more broadly) than posing a question in an article’s headline.
This intellectual timidity probably stems from the fact that most peer-reviewed,published social science research findings are irreproducible. In other words, social science research findings are more likely a function of bias and methodology than a function of reality itself.
As my father, a mechanical engineer, would often say: “Social science is not science.”
The consequence is that social science findings are too often artifacts of their methods and temporal context — so much so that a field like psychology has become a graveyard for old, discredited theories: Physiognomy (i.e., assessing personality traits through facial characteristics), graphology (i.e., assessing personality traits through handwriting), primal therapy (i.e., psychotherapy method where patients re-experience childhood pains), and neuro-linguistic programming (i.e., reprogramming behavioral patterns through language) are just a few embarrassing examples.
Indeed, established psychological theories such as cognitive dissonancehave proven to be such an over-simplification of behavioral reality that their practical and academic utility is debatable.
And what does this have to do with COVID-19? Not much. I’m just venting.
Well, not exactly.
The COVID-19 pandemic has unleashed a torrent of speculation and research about what COVID-19 policies work and don’t work.
For example, how effective are masks and mandatory mask policies?
In part, the variation in findings on mask-wearing is a product of a healthy application of the scientific method. No single study can address every aspect of mask effectiveness.
Research is like a gestalt painting where a single study represents but a tiny part of the total picture. One must step back from the specific research findings of one study in order to understand the essence of all the research together.
In other words, masks work, but with some important caveats.
Some countries have done a better job than others at containing COVID-19
Among the largest, most developed economies, it is increasingly apparent which countries have been most effective at minimizing the impact of COVID-19.
According to the cumulative tally reported at RealClearPolitics.com, these 10 developed countries have the lowest COVID-19 deaths rates (per 1 million people) as of February 10, 2021:
Taiwan — 0 (deaths per 1 million) China — 3 Singapore — 5 New Zealand — 5 Iceland — 6 South Korea — 29 Australia — 36 Japan — 52 UAE — 99 Norway — 111
On the other end of the scale, these 10 developed countries have the highest COVID-19 deaths rates (per 1 million people) as of February 10, 2021:
Belgium — 1,880 (deaths per 1 million) UK — 1,712 Italy — 1,522 U.S. — 1,467 Portugal — 1,431 Spain — 1,350 Mexico — 1,335 Sweden — 1,210 France — 1,196 Switzerland — 1,139
If there are complaints about the validity of the data from China or Taiwan, I am all ears. However, regardless of their inclusion, an informal review of the other advanced countries suggests some patterns in their COVID-19 outcomes over time.
First, in fighting COVID-19, it helps to be on an island (Taiwan, Singapore, New Zealand, Iceland, Australia, and Japan). And for all practical purposes, I consider South Korea to have near-island status as few people enter that country by way of a land border.
Second, it appears European romance language countries such as Italy, Portugal, Spain, France (tourism perhaps?) and countries with subpar health care systems (such as the U.S. and Switzerland which rely disproportionately on insurance-based health care access) have not fared well in fighting COVID-19.
On an anecdotal level, at least, I’ve explained most of the high- and low-performing countries with respect to COVID-19 without even referencing their COVID-19 policies.
So what impact have COVID-19 policies had on containing this pandemic?
Though lacking a definitive answer that question on a specific policy level, in the aggregate, there are strong indications that changes in national COVID-19 policies have had, for a small subset of countries, at least one of two discernible relationships with weekly variation in new COVID-19 cases: A small number of countries have been proactive in their COVID-19 policies and the result has been relatively few COVID-19 deaths per capita. Another small set of countries have been reactive in their COVID-19 policies and their COVID-19 deaths per capita have been relatively higher in comparison to the proactive countries. As for most countries, they fall somewhere in the middle, as they are both proactive and reactive.
Before we look at the data, here is a conceptual perspective.
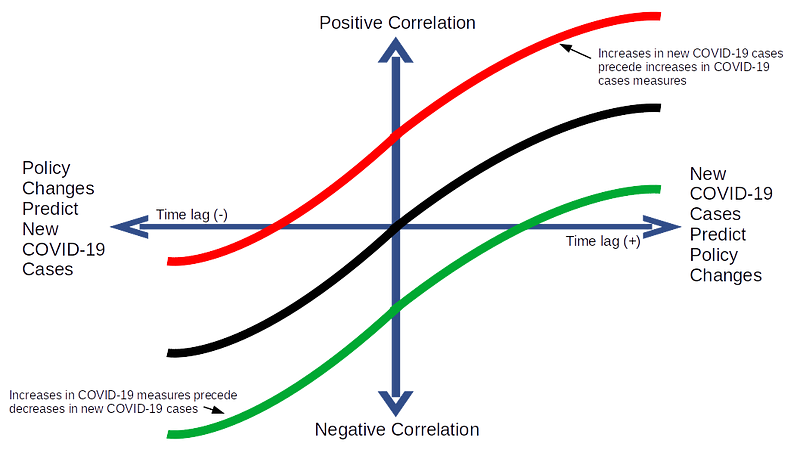
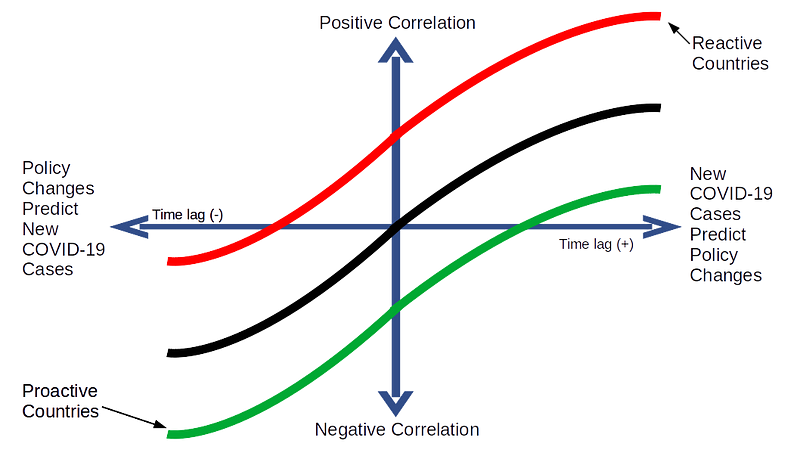
Figure 1 visualizes a theoretical framework for how national policies may relate to the spread of COVID-19 (see Figure 1). There are two axes: (1) The vertical axis represents the correlation between changes in COVID-19 policies and changes in weekly new cases of COVID-19, while the (2) second axis represents that relationship at various time lags.
In this construct, consider the weekly number of new COVID-19 cases to be our outcome variable (Y) and the stringency of national COVID-19 policies to be our input variable (X).
The intersection of the two axes represents the contemporaneous relationship between COVID-19 policies (X) and new COVID-19 cases (Y). As one proceeds to the left of center on the vertical axis, this represents the relationship between prior values of COVID-19 policy with future numbers of new COVID-19 cases (i.e., X causes Y). As one proceeds to the right of center on the vertical axis, this represents the relationship between prior numbers of new COVID-19 cases with future values of COVID-19 policy (Y causes X).
Figure 1: A Theoretical Framework for Understanding COVID-19 Policies
Figure 2 shows the practical implication of Figure 1: COVID-19 policies in some countries will generally follow the red line over time (reactive), while others the green line (proactive), and still others — probably the majority of countries — will follow the black line (a combination of reactive and proactive policy changes).
Figure 2: Proactive Policies versus Reactive Policies
In fact, these patterns did emerge across the 30 countries I analyzed when I plotted the cross correlations over time between changes in their COVID-19 policies and changes in the weekly number of new COVID-19 cases.
Country-level patterns in COVID-19 policy effectiveness
As demonstrably important as COVID-19 policies such as mask mandates or business lockdowns are to containing COVID-19, my curiosity is with an aggregate measure of those policies, as any single policy will not be enough to address something as pervasive as COVID-19.
As a result, I used country-level COVID-19 policy data from the Coronavirus Government Response Tracker (OxCGRT) compiled by researchers at the Blavatnik School of Government at the University of Oxford who aggregate 17 policy measures, ranging from containment and closure policies (such as such as school closures and restrictions in movement); economic policies; and health system policies (such as testing regimes), to create one summary measure: The COVID-19 Policy Stringency Index (PSI). Details on how OxCGRT collects and summarizes their policy data can be found in a working paper.
The outcome measure used here is the number of new COVID-19 cases reported by Johns Hopkins University every week from January 20, 2020 to February 5, 2021 for each of the following countries: Australia, Austria, Belgium, Brazil, Canada, Denmark, Finland, France, Germany, Greece, Iceland, India, Indonesia, Ireland, Israel, Italy, Japan, Mexico, Netherlands, New Zealand, Norway, Portugal, Russia, South Africa, South Korea, Spain, Sweden, Switzerland, UK, and US.
It should be noted that the raw data from OxCGRT and Johns Hopkins were at the daily level, but was aggregated to the weekly level for data smoothing purposes.
In total, there were 50 data points for each of the 30 countries, and to address the relevance of the theoretical framework in Figure 2 a bivariate Granger causality test is employed for each country (an example of the R code used to generate this analysis is in the appendix).
The Results
Of the 30 countries in this analysis, bivariate Granger causality tests found only three in which prior increases in the stringency of COVID-19 policies (PSI) were significantly associated with decreases in the weekly numbers of new COVID-19 cases (Iceland, New Zealand, and Norway). Figures 3 through 5 show the cross correlation functions (CCF) for those countries in which their COVID-19 policies shaped events, instead of merely reacting to them. Hence, I label their COVID-19 policies as proactive.
In another six countries it was found that increases in the stringency of COVID-19 policies tended to follow increases in the weekly numbers of new COVID-19 cases (see Figures 6 through 9). In other words, their COVID-19 policies tended to follow events instead of shaping them. The policies in these countries are therefore labeled as reactive.
For the remaining 21 countries, the Granger causality tests revealed no significant relationships in either causal direction, though their CCF patterns tended to follow the S-curve shape posited in Figures 1 and 2. The lack of statistical significance in those cases could be a function of the limited samples sizes which was a product of aggregating the data to the weekly-level.
PROACTIVE COUNTRIES:
Figure 3: Cross Correlation Function — Iceland
Figure 4: Cross Correlation Function — New Zealand
Figure 5: Cross Correlation Function — Norway
REACTIVE COUNTRIES:
Figure 6: Cross Correlation Function — Germany
Figure 7: Cross Correlation Function — Israel
Figure 8: Cross Correlation Function — Switzerland
Figure 9: Cross Correlation Function — Austria
Proactive countries have had better COVID-19 outcomes
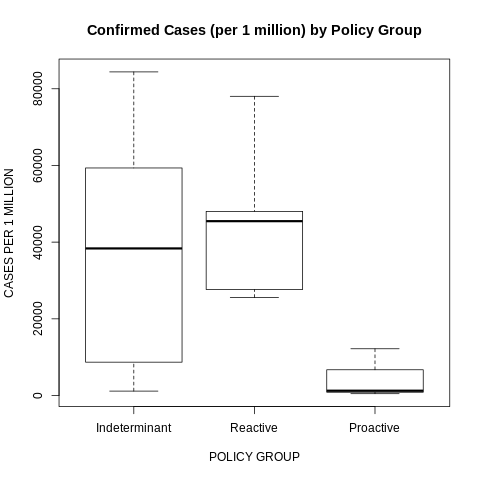
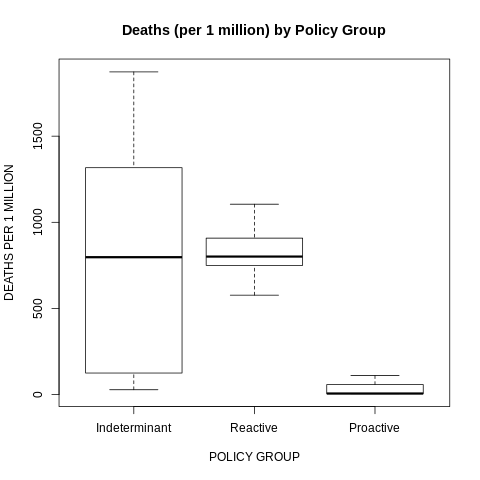
Figure 10 and 11 reveal how the COVID-19 outcomes in the proactive countries were significantly better than in the other countries. Countries that kept ahead of the health crisis did a better job of controlling the health crisis.
Figure 10: Confirmed COVID-19 Cases (per 1 million) by Policy Group
Figure 11: Confirmed COVID-19 Deaths (per 1 million) by Policy Group
Not coincidentally, many of the qualitative and quantitative analyses of worldwide COVID-19 policies have found Iceland, New Zealand, and Norway among the highest performers according to their metrics (examples are here, here and here).
Final Thoughts
In no way does my analysis suggest that COVID-19 policies in only three countries (Iceland, New Zealand, and Norway) were effective and the policies in the remaining countries were mere reactions to an ongoing health crisis they could not control.
Undoubtedly, there are well-documented examples of policy impotence across this worldwide pandemic. The lack of a consistent mask mandates in U.S. states like Arizona, North Dakota and South Dakota may help explain why those states have among the highest COVID-19 infection rates in the country. Sweden’s initial decision to keep their economy open during the early stages of the pandemic most likely explains their relatively high case and fatality rates relative to their Scandinavian neighbors.
But, in fairness, not every policy (or lack thereof) is going to work for a pathogen that has proven to be so pernicious. At the same time, as this pandemic winds down with the roll out of vaccinations, we are now seeing evidence in retrospect that a relatively small number of countries did do a better job than others in managing this pandemic. For the majority of countries, however, their policy leaders may have had frighteningly little impact on the ultimate course of this virus. Their citizens would have been better off moving to an island.
K.R.K.
Send comments to: nuqum@protonmail.com
Appendix
R code used to generate the bivariate Granger causality test for Iceland:
library(lmtest) par1 <- as.numeric(par1) par2 <- as.numeric(par2) par3 <- as.numeric(par3) par4 <- as.numeric(par4) par5 <- as.numeric(par5) par6 <- as.numeric(par6) par7 <- as.numeric(par7) par8 <- as.numeric(par8) ox <- x oy <- y if (par1 == 0) { x <- log(x) } else { x <- (x ^ par1 - 1) / par1 } if (par5 == 0) { y <- log(y) } else { y <- (y ^ par5 - 1) / par5 } if (par2 > 0) x <- diff(x,lag=1,difference=par2) if (par6 > 0) y <- diff(y,lag=1,difference=par6) if (par3 > 0) x <- diff(x,lag=par4,difference=par3) if (par7 > 0) y <- diff(y,lag=par4,difference=par7) print(x) print(y) (gyx <- grangertest(y ~ x, order=par8)) (gxy <- grangertest(x ~ y, order=par8)) postscript(file="/home/tmp/1auwb1612990002.ps",horizontal=F,onefile=F,pagecentre=F,paper="special",width=8.3333333333333,height=5.5555555555556) op <- par(mfrow=c(2,1)) (r <- ccf(ox,oy,main='Cross Correlation Function (raw data)',ylab='CCF',xlab='Lag (k)')) (r <- ccf(x,y,main='Cross Correlation Function (transformed and differenced)',ylab='CCF',xlab='Lag (k)')) par(op) dev.off() postscript(file="/home/tmp/2xjfo1612990002.ps",horizontal=F,onefile=F,pagecentre=F,paper="special",width=8.3333333333333,height=5.5555555555556) op <- par(mfrow=c(2,1)) acf(ox,lag.max=round(length(x)/2),main='ACF of x (raw)') acf(x,lag.max=round(length(x)/2),main='ACF of x (transformed and differenced)') par(op) dev.off() postscript(file="/home/tmp/3zoqj1612990002.ps",horizontal=F,onefile=F,pagecentre=F,paper="special",width=8.3333333333333,height=5.5555555555556) op <- par(mfrow=c(2,1)) acf(oy,lag.max=round(length(y)/2),main='ACF of y (raw)') acf(y,lag.max=round(length(y)/2),main='ACF of y (transformed and differenced)') par(op) dev.off()
By Kent R. Kroeger (Source: NuQum.com; February 4, 2021)]
In April 1985, the Coca-Cola Company, the largest beverage company in the world, replaced their flagship beverage, Coca-Cola, with New Coke — a soda drink designed to match the sugary sweetness of Coca-Cola’s biggest competitor, Pepsi.
At the time, Pepsi was riding a surge in sales, fueled by two marketing campaigns: The first campaign was a clever use of blind taste tests, called the “Pepsi Challenge,” and through which Pepsi claimed most consumers preferred the taste of Pepsi over Coca-Cola. The second, called the “The Pepsi Generation” campaign, featured the most popular show business personality at the time, Michael Jackson. Pepsi’s message to consumers was clear: Pepsi is young and cool and Coca-Cola isn’t.
Hence, the launch of New Coke — which, to this day, is considered one of the great marketing and re-branding failures of all time. Within weeks of New Coke’s launch it was clear to Coca-Cola’s senior management that their loyal customer base — raised on the original Coca-Cola formula — was not going to accept the New Coke formula. Hastily, the company would re-brand their original Coca-Cola formula as Coca-Cola Classic.
What did Coca-Cola do wrong? First, it never looks for good for a leader to appear too reactive to a rising competitor. On a practical level, for brands to lead over long periods they must adapt to changing consumer tastes — but there is a difference between ‘adapting’ and ‘panicking.’ Coca-Cola panicked.
But, in what may have been Coca-Cola’s biggest mistake, they failed to understand the emotional importance to their loyal customers of the original Coca-Cola formula.
“New Coke left a bitter taste in the mouths of the company’s loyal customers,” according to the History Channel’s Christopher Klein. “Within weeks of the announcement, the company was fielding 5,000 angry phone calls a day. By June, that number grew to 8,000 calls a day, a volume that forced the company to hire extra operators. ‘I don’t think I’d be more upset if you were to burn the flag in our front yard,’ one disgruntled drinker wrote to company headquarters.”
Prior to New Coke’s roll out, Coca-Cola did the taste-test research (which showed New Coke was favored over Pepsi), but they didn’t understand the psychology of Coca-Cola’s most loyal customers.
“The company had underestimated loyal drinkers’ emotional attachments to the brand. Never did its market research testers ask subjects how they would feel if the new formula replaced the old one,” according to Klein.
Is Hollywood Making the Same Mistake as Coca-Cola?
Another term for ‘loyal customer’ is ‘fan.’ In the entertainment industry, fans represent a franchise’s core audience. They are the first to line up at a movie premiere or stream a TV show when it becomes available. They’ll forgive an occasional plot convenience or questionable acting performance, as long as they can still recognize the characters, mood and narratives that make up the franchise they love.
Star Trek fans showed up in command and science officer-colored swarms for 1979’s Star Trek: The Motion Picture, an extremely boring, almost unwatchable film, according to many Trek fans. Yet, they still showed up for 1982’s Star Trek: The Wrath of Khan (a far better film) even when the casual Trek audience didn’t — helping make the Star Trek “trilogy” films (The Wrath of Khan,The Search for Spock, The Voyage Home) among the franchise’s most successful.
No superhero franchise has endured as many peaks and valleys in quality as Batman, a campy TV show in my youth, but a significant box office event with Tim Burton’s Batman (1989). Unfortunately, the franchise descended into numbing mediocrity after Burton, reaching a creative depth with 1997’s Batman & Robin, only to exceed the critical acclaim of the Burton-era films with Christopher Nolan’s Batman trilogy movies in the 2000s. Through all of this, Batman movies make money…most of the time.
This phenomenon is common to a lot of science fiction and superhero franchises: Star Wars, Superman, Spider-Man, Doctor Who, Alien, and The Terminator. among others. They are not consistently great, but they almost always bring out a faithful fan base.
That is, until they don’t.
Three major science fiction franchises have undergone significant re-branding efforts in the past five years, in the understandable hope of building a new, younger, and more diverse fan base for these long-time, successful franchises — not too dissimilar from what Coca-Cola was trying to do in the mid-1980s:
Star Wars
Now owned by Disney, Star Wars had its canon significantly altered in the three Disney trilogy movies from the original George Lucas-led Star Wars movies when the heroic stature of its two most iconic male characters — Luke Skywalker and Han Solo — was unceremoniously diminished in favor of new characters (Rey, Finn, and Poe Dameron). If Disney had a customer complaint line, it would have been overwhelmed after the first trilogy movie, The Force Awakens, and shutdown after The Last Jedi.
Result: Disney made billions in box office receipts from the trilogy movies, but it is hard to declare these movies an unqualified success. Yes, the movies made money, but Disney designs movies as devices for generating stable (and profitable) revenue streams across a variety of platforms (amusement park attendance, spin-off videos, toy sales, etc.). The Disney trilogy has generated little apparent interest in sequel films. At the Walt Disney Company’s most recent Investor Daylast December, whichfeatured announcements for future Star Wars TV and movie projects, not one of the new projects involved characters or story lines emanating from the trilogy movies. More telling, pre-pandemic attendance at the new Star Wars-themed Galaxy’s Edge parks at Disney World and Disneyland have seen smaller-than-expected crowds — and to make matters worse, Star Wars merchandise sales have been soft since the trilogy roll out. Be assured, these outcomes are not part of Disney’s Star Wars strategy.
Star Trek
The Star Trek franchise has launched two new TV shows through Paramount/CBS in the past three years: Star Trek: Discovery and Star Trek: Picard. Through three seasons of Discovery and one for Picard, the re-branded Star Trek has turned the inherent optimism of Gene Roddenberry’s original Star Trek vision into a depressing, dystopian future. Starfleet, once an intergalactic beacon for inclusiveness, integrity and justice, is now a bureaucratic leviathan filled with corruption and incompetence. To further distance the new Star Trek from the original Star Trek series (TOS), Discovery’s writers concocted an incomprehensible plot twist — the Seven Red Signals — in order to send the Discovery’s crew 900 years into the future, past the TOS and Star Trek: The Next Generation timelines, thereby freeing the new series from the shackles of previous Star Trek canon.
Result: As Picard has had only one season, I will focus on Discovery, which has hadthree seasons on CBS’s All Access streaming platform (though only one on the broadcast network). In its 2017 series premiere, Discovery reportedly attracted 9.6 million viewers on the CBS broadcast network before the show was transitioned to the streaming service. Parrot Analytics subsequently reportedDiscovery was the second most streamed TV show in Summer 2017 (after Netflix’ Ozark), with 12.6 million average demand expressions, and was first for the week of October 5 through 11, with over 53 million average demand expressions.
Not a bad start, but by moving Discovery to the broadcast side this past year, CBS apparently signaled the show wasn’t building enough audience interest on the streaming service to offset the ad revenue losses from not putting it on the broadcast network — or, at least, that is how some TV insiders are interpreting the move. But, given Discovery’s broadcast ratings for the first season, it is unlikely the show is inundating the network in increased ad revenues either. It’s “linear” premiere broadcast on September 24, 2020 attracted 1.7 million viewers, placing it 8th out of the 12 broadcast network shows on that night — a bad start which has not improved over the next 13 episodes. [The most recent episode, broadcast on January 28, 2021, brought in 1.8 million viewers.]
Nonetheless, perhaps Discovery is at least attracting a new, younger audience for Star Trek? Uh, nope. Consistently, the show has achieved around a 0.2 rating within the 18–49 demo, which translates to about 280,000 people out of the 139 million Americans in that age group. That means the remaining 1.4 million Discovery viewers are aged 50 or older — in other words, old Star Trek nerds like me. How ironic would it be if it were the franchise’s original series fans that saved Discovery from cancellation, despite the show’s apparent attempts to distance itself from those same fans?
Doctor Who
No re-branding effort has broken my heart more than the decline of the BBC’s Doctor Who under showrunner Chris Chibnall’s leadership. The oldest science fiction series still on television feels irreparably damaged with its underdeveloped companion characters, generally poor scripts, and grade school level political sermons. The net result? The last two seasons featuring the 13th Doctor, played gamely by Jodi Whittaker, are more often boring than entertaining or thought-provoking.
But most regrettably, to lifelong fans who have loved the show since its first Doctor (played by William Hartnell), the BBC and Chibnall have taken the show’s long established canon, stuffed it in a British Army duffel bag, and thrown it in the River Thames to drown. And how did they do that? By rewriting the Doctor’s origin story — a Time Lord exiled from his home world of Gallifrey — in the fifth (“Fugitive of the Judoon”) and twelfth (“The Timeless Children”) episodes in the 13th Doctor’s second season, to where now the first Doctor is actually a previously unknown woman named Ruth Clayton and the ability of Doctors (Time Lords) to regenerate is now initially derived from a sadistic experiment on a small child who was the first living being found to have regenerate powers. If this story wasn’t so stupid, it would be sick.
Chibnall’s re-telling of the Doctor’s origin story was a WTF! moment for a lot of Whovians (the name often given to Doctor Who fans). But not a WTF! moment in the entertaining sense (like when half of The Avengers dissolved at the end of Infinity War), but in the bad sense.
Chibnall would have inspired no more controversy if he had gone back and rewritten Genesis 1:1 to read: “In the beginning Hillary Clinton created the heaven and the earth.” Such rewrites have only one purpose: to piss off people emotionally attached to the original story.
And that is exactly what the BBC and Chibnall have done — and many Doctor Who fans (though, as yet, not me) have responded by abandoning the franchise.
Result: The TV ratings history for the 13th Doctor’s two seasons reveals the damage done, though there was hope at the beginning. The 13th Doctor’s first episode on October 7, 2018, pulled in 10.96 million viewers — a significant improvement over the previous Doctor’s final season ratings which never exceeded 7.3 million viewers for an individual episode. However, in a near monotonic decline, the 13th Doctor’s latest episode (and last of the 2020 season) could only generate 4.69 million viewers, an all-time low since the series reboot in 2005.
And why did Doctor Who lose 6.3 million viewers? Because the BBC (through Chibnall) wanted Doctor Who to be more tuned to the times. They wanted a younger, more diverse, more socially enlightened audience for their show. Doctor Who was never cool enough. In fact, the original Doctor Who series was always kind of silly and escapist — a condition completely unacceptable in today’s political climate, according to the big heads at the BBC. Doctor Who needed to be relevant, so it became the BBC’s version of New Coke.
Except the BBC’s new Doctor Who is New Coke only if New Coke had tasted like windshield wiper fluid. From Chibnall’s pointed pen, the show has aggressively (and I would add, vindictively) alienated fans by marginalizing its original story.
Perhaps the Chibnall narrative is a objectively a better one. Who am I to say it isn’t? But the answer to that question doesn’t matter to Whovians who are deeply connected to the pre-Chibnall series. Whovians have left the franchise in the millions and unless the BBC has already concocted a Coca-ColaClassic-like response, I don’t see why they will come back.
Have TV and Movie Studios Forgotten How to Do Market Research?
The lesson from Star Wars, Star Trek and Doctor Who is NOT that brands shouldn’t change over time or that canon is sacrosanct and any deviations are unacceptable. Brands must adapt to survive.
All three of these franchises need a more diverse fan base to stay relevant and that starts with attracting more women and minorities into the fold. But how these franchises tried to evolve has been a textbook example on how not to do it.
In my opinion, it starts with solid writing and good storytelling, which requires better developed characters and more compelling narratives. Harry Potter is the contemporary gold standard. My personal favorite, however, is Guardians of the Galaxy — a comic book series I ignored as a kid, but in cinema form I love. Director/Writer James Gunn has offered us a master class at creating memorable characters, such as Nebula, Gamora, Drax, Peter Quill, Mantis, Rocket, and Groot. So much so, that a few plot holes now and then are quickly forgiven — not so with the re-branded Star Wars, Star Trek and Doctor Who.
Along with better writing, these three franchises have been poorly managed at the business level — and that starts with market research. Disney, Paramount and the BBC have demonstrated through their actions that they do not know their existing customers, much less how to attract new ones.
“Any standout customer experience starts with figuring out the ‘what’ and working backwards to design, develop and deliver products and services that customers use and recommend to others. But how effective are marketing organizations at understanding “what” customers are looking for and ‘why’?”
The AMA’s answer to that last question was that most businesses — 80 percent by their estimate — do not understand the ‘what’ and ‘whys’ behind their current and potential customers’ motivations.
Does that mean these franchises would have been better off just engaging in slavish fan service? Absolutely not.
Fans are good at spending their money to watch their favorite movies and TV shows. They are not creative writers. Few people in contemporary marketing reference anymore the old trope of the “customer always being right,” as experience has taught companies and organizations that customers don’t always know what they want, much less know what they need. As Henry Ford is quoted as saying, “If I’d asked people what they wanted, they’d have asked for faster horses” [thoughit is not clear that he ever said that or would have believed it].
Instead, modern marketers tend to focus on understanding the customer experience and mindset in an effort to strategically differentiate their brands. Central to that process, the best organizations depend heavily on sound, objective research to answer key questions about their current and prospective customers.
There was a time when the entertainment industry was no different in its reliance on consumer data and feedback to shape product and distribution. The power of one particular market research firm, National Research Group (NRG), to determine movie release dates or whether a movie even gets released in theaters is legend in Hollywood. Though now a part of Nielsen Global Media (another research behemoth that has probably done as much to shape what we watch as NBC or CBS ever have), early in its existence the NRG was able to get the six major movie studios to sign exclusivity agreements granting NRG an effective monopoly on consumer-level information regarding upcoming movies. If you can control information, you can control people (including studio executives).
But something has happened in Hollywood in the past few years with respect to science fiction and superhero audiences (i.e., customers) who are perceived by many in Hollywood — wrongfully, I might add — as being predominately white males.
For certain, the research says science fiction moviegoers skew young and male, but that is a crude understanding of science fiction fandom. Go to a Comicon conference and one will see crowds almost evenly divided between men and women and drawn from most races, ethnicities and age groups — though my experience has been that African-Americans are noticeably underrepresented (see photo below).
Similarly, a 2018 online survey of U.S. adults found that, while roughly three-quarters of men like science fiction and fantasy movies (76% and 71%, respectively), roughly two-thirds of women also like those movie genres (62% and 70%, respectively). The same survey also found that white Americans are no more likely to prefer these movie genres than Hispanic, African-American or other race/ethnicities.
Methodological Note:
Total sample size for this survey of U.S. moviegoers was 2,200 and the favorite genre results are based on the percentage of respondents who had a ‘very’ or ‘somewhat favorable’ impression of the movie genre.
The ‘white-male’ stereotyping of science fiction fans, so common within entertainment news stories about ‘toxic’ fans, also permeates descriptions of the gaming community, an entertainment subculture that shares many of the same franchises (Star Wars, The Avengers, The Witcher, Halo, etc.) popular within the science fiction and fantasy communities. Despite knowing better, when I think of a ‘gamer,’ I, too, think of people like my teenage son and his male cohorts.
Yet, in a 2008 study, Pew Research found that self-described “gamers” were 65 percent male and 35 percent female, and in 2013 Nintendo reported that its game-system users were evenly divided between men and women.
Conflating “white male” stereotypes of science fiction fans with “toxic” fans serves a dark purpose within Hollywood: The industry believes it can’t re-brand some of its most successful franchises without first destroying the foundations upon which those franchises were built.
In the process of doing that, Hollywood has ignited a war with some of its most loyal customers who have been
labeled within the industry as “toxic fans.”
A Cold War between Science Fiction Fans and Hollywood Continues
The digital cesspool — otherwise known as social media — can’t stop filling my inbox with stories about how “woke” Hollywood is vandalizing our most cherished science fiction and superhero franchises (Star Wars, Star Trek, Batman and Doctor Who, etc.) or how supposedly malevolent slash racist/sexist/homophobic/transphobic fans are bullying those who enjoy the recent “re-imaginings” of these franchises. All sides are producing more noise than insight.
In the midst of these unproductive, online shouting matches, there is real data to suggest much of the criticism of Disney’s Star Wars trilogy (The Force Awakens, The Last Jedi, and The Rise of Skywalker), CBS’ new Star Trek shows and theBBC’s 13th iteration of Doctor Who isrooted in genuine popularity declines within those franchises.
I produced the following chart in a previous post about the impact of The Force Awakens on interest in the Star Wars franchise:
Figure 1: Worldwide Google searches on ‘Star Wars’ from January 2004 to May 2020
Source: Google Trends
The finding was that the The Force Awakens failed to maintain the interest in Star Wars it had initially generated, as evidence by the declining “trend in peaks” with subsequent Disney Star Wars films.
A similar story can be told for some of TV’s most prominent science fiction and superhero franchises.
Bottom line: Our most enshrined science fiction and superhero franchises are losing audiences fast.
‘The Mandalorian’ Offers Hope on How To Re-Brand a Franchise
Whether these audience problems are due to bad writing, bad marketing, negative publicity caused by a small core of “toxic” fans, or just unsatisfied fan bases are an open dispute. What can be said with some certitude is that these franchises have underwhelmed audiences in their latest incarnations, with one exception…Disney’s Star Wars streaming series: The Mandalorian.
Methodological Note:
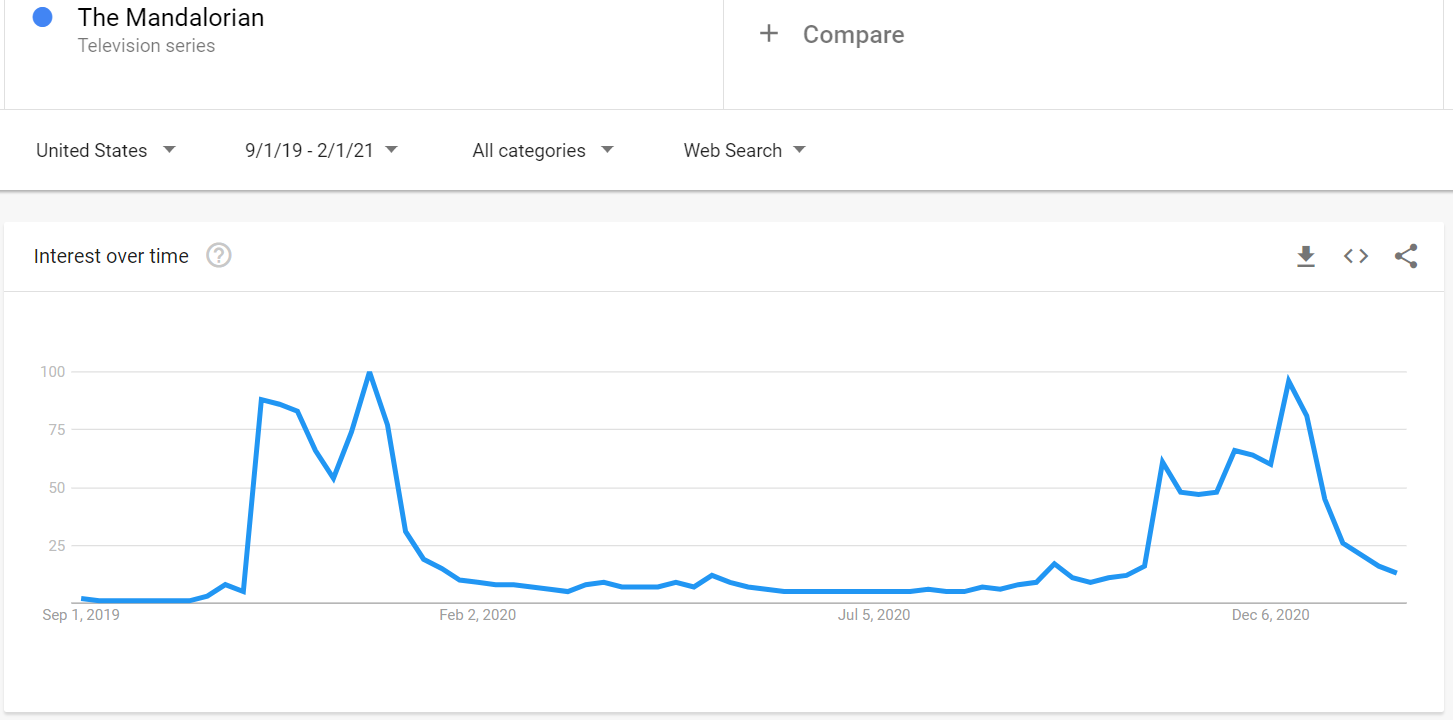
In a previous post I’ve shown that Google search trends strongly correlate with TV streaming viewership: TV shows that generate large numbers of Google searches tend to be TV shows people watch. A similar relationship has been shown to exist between movie box office figures and Google search trends.
Figure 2 shows the Google search trends since September 2019 for Disney’s The Mandalorian. Over the two seasons the show has been available on Disney+ (Season 1: Nov. 12 — Dec. 27, 2019; Season 2: Oct. 30 — Dec. 18, 2020), intraseasonal interest in the show has generally gone up with each successive episode, with the most interest occurring for the season’s final episode. This “rising peaks” phenomenon — indicative of a well-received and successful TV or movie series — was particularly evident in The Mandalorian’s second season where characters very popular among long-time fans periodically emerged over the course of the season: Boba Fett, Bo-Katan, Ashoka Tano, and (of course) Luke Skywalker.
Figure 2: Google search trends for Disney’s The Mandalorian (Sept. 2019 to Feb. 2021)
It has only been two seasons, but The Mandalorian’s creative leaders — Jon Favreau and Dave Filoni — have been able to maintain steady audience interest, though they run the risk of eating their seed corn with the frequent fan-favorite character roll outs. It will not take long for them to run out of cherished and widely-known Star Wars characters. [Jon/Dave, I love Shaak Ti, but what are the chances she will ever come back?]
Nonetheless, The Mandalorian stands in stark contrast to some other science fiction and superhero franchises who have struggled to build their audiences in the past five years.
Figure 3 shows four TV shows with declining intraseasonal and/or interseasonal peaks. We’ve discussed Discovery and Doctor Who’s audience problems above, but Supergirl deserves some particular attention as my son and I watched the show faithfully through the first four seasons.
Figure 3: Google search trends for Star Trek: Discovery, Doctor Who, Batwoman, and Supergirl (Feb. 2016 to Feb. 2021)
Supergirl, whose title character is played bya mostcharmingMelissa Benoist, debuted on October 26, 2015 on CBS and averaged 9.8 million viewers per episode in its freshman season, making it the 8th most watched TV show for the year — a solid start.
Regrettably, CBS moved the show to its sister network, The CW, where it experienced an immediate drop of 6.5 million viewers in its first season there and another 1.5 million viewers over the next three seasons. [Supergirl has since been cancelled.]
How did this happen?
Before blaming the show’s overt ‘wokeness’ — women were always competent, while white men were either evil (Jon Cryer’s Lex Luther was magnificent though) or lovesick puppies — the spotlight must be turned on the CBS executives who decided to anchor the show to The CW’s other superhero shows (The Flash and Arrow) in an effort to help the flagging sister network. Their attempt failed and Supergirl paid the price.
At the same time, Supergirl didn’t build on its smaller CW audience and that problem rests on the shoulders of the show’s creative minds, particularly Jessica Queller and Robert Rovner, who were the showrunners after the second season.
First, what happened to Superman? Supergirl’s cousin, Kal-El, was prominent in the second season, but then disappeared in Season 3 (apparently, he had a problem to solve in Madagascar caused by Reign, an existential threat to our planet who Supergirl happened to be fighting at the time). Superman couldn’t break away to help his cousin?
I watched the Supergirl TV show because I was a fan of her DC comics in childhood and few realize that Supergirl comics, at least among boys, were more popular than Wonder Woman’s in the 1960s, according to comics historianPeter Sanderson. And central to her story was always her cousin, Superman. But for reasons seemingly unrelated to the sentiments of the show’s fans, Superman’s appearances after Season 2 were largely limited to the annual Arrowverse crossover episodes.
Fine, Supergirl’s showrunners wanted the show to live or die based on the Supergirl character, not Superman’s. I get it. But a waste of one of the franchise’s greatest assets.
Second, the script writing on Supergirl changed noticeably after Season 2, with story lines mired in overly convenient plot twists (M’ymn, the Green Martian, gives up his life and merges with the earth to stop Reign’s terraforming the planet? How does that work? We’ll never know.), and clunky teaching moments on topics ranging from gun control to homosexuality. Instead of being a lighthearted diversion from the real world, as it mostly was in its first two seasons, the show’s writers thought it necessary to repurpose MSNBC content. Supergirl stopped being fun.
What Lessons are Learned?
The most important lesson from Coca-Cola’s New Coke blunder was that mistakes can be rectified, if dealt with promptly and earnestly. It is OK to make mistakes. You don’t even have to admit them. But you do have to address them.
In 1985, the year of New Coke’s introduction, Coca-Cola’s beverage lines owned 32.3 percent of the U.S. market to Pepsi’s 24.8 percent. Today, Coca-Cola owns 43.7 percent of the non-alcoholic beverage market in the U.S., compared to Pepsi’s 24.1 percent.
With The Mandalorian’s success, Hollywood may still realize that burning down decades of brand equity earned by franchises such as Star Wars, Star Trek and Doctor Who is not a sound business plan. The good news is, it is not too late to make amends with the millions of ardent fans who have supported these franchises through the good, the bad and the Jar Jar Binks. That Star Wars fans can now laugh about Jar Jar is proof of that.