Monthly Archives: October 2020

Now that the election is essentially over, let us stop blaming others for the spread of the coronavirus

[Headline photo by Photo by futureatlas.com; used under the the CCA 2.0 Generic license]

By Kent R. Kroeger (Source: NuQum.com; October 29, 2020)

“Come to terms with death. Thereafter anything is possible”— scribbled by Albert Camus in one of his notebooks.

The U.S. presidential election is essentially over. Can we stop being afraid and have a serious discussion about the coronavirus and the next steps to address it?

During this dreadful election, watching the world’s news organizations post a daily coronavirus death counts has been one of the most depressing aspects of this pandemic. And not simply because of the figure’s size — 1,176,000 people worldwide have died from this virus as of October 28th (or about 0.015 percent of the total world population)— but because the news media uses it, not just to inform us, but to force us to stew in its political ramifications. Conservative commentator Steve Deace aptly coined a term for the news media’s coronavirus coverage: panic porn. I may disagree with Deace’s contrarian view about the virus’ threat, but he’s take on the news media is spot on.

And its not just the news media failing us, its the politicians too.

“I hold Donald Trump responsible for every death in New York state from Covid, because Trump lied,” New York Governor Andrew Cuomo said in a recent conference call with reporters. “New York state had that big burst because it came from Europe and not China, and they never did a European travel ban because he was lying to the American people. He is the super-spreader that brought the virus to America.”

Never mind that Trump did impose a travel ban on European travelers entering the U.S. in early March at around the same time as other countries, or that U.S. governors have the executive authority to impose their own restrictions on international travelers into their state, blaming others is a time honored tradition among politicians. By doing so, unfortunately, politicians like Governor Cuomo and President Trump have been able to rationalize their own COVID-19 policy mistakes. And they’ve made many.

For his part, President Trump’s inability to take some responsibility for the federal government’s mistakes during the coronavirus pandemic has gravely hurt his chances at being re-elected, fair or not. The only consistent message he’s offered the American people is that he thinks China is to blame. Simply put, that political strategy hasn’t worked.

The blame game isn’t just an intellectual cop-out, it stunts the development and implementation of real solutions as the partisan fireworks devolve mostly into substance-free, unproductive exercises in moral posturing and bad public theater.

China is not to blame for these COVID-19 deaths. And neither is Donald Trump and his administration. And neither are the Democratic governors of New York, New Jersey, Rhode Island and Connecticut whose constituents so far have experienced some of the world’s worst coronavirus death counts per capita. [Though, it was probably a mistake early in the pandemic bythose governors to systematically move thousands of elderly COVID-19 patients from hospitals to nursing homes in an attempt to keep more hospital beds available. It was a policy disaster that will hopefully get more investigation once the elections are over.]

The reality is…the coronavirus has caused the COVID-19 deaths, which is not to say our medical experts, politicians, and inadequate health care system didn’t make some grave mistakes along the way — particularly early on— as they tried to limit its spread and lethality.

President Trump’s unfounded, dreamy optimism about how quickly the pandemic would end is no worse than the Democratic Party’s ignoring their own mistakes and, instead, opting for excessive moralizing and hyperbolic doomsday predictions.

The Spanish Flu of 1918–20 killed 50 million people (675,000 in the U.S.), which was about 2.7 percent of the world’s population. The Roaring Twenties followed closely on the heals of what had been one of the worst worldwide pandemics since the 1300’s bubonic plague.

There is little doubt that — regardless of who wins the upcoming election — the U.S. and world economies will recover from this pandemic.

Despite the current third wave of the coronavirus — which may exceed the other two in numbers of new cases —case fatality rates (see Figure 1 below) continue to fall or are stable in most countries (Iran being one tragic exception) and the prospects for a safe, effective vaccine by early next year have cautiously improved.

Figure 1: COVID-19 Cumulative Case Fatality Rates for Selected Countries

Image for post

Whether this drop in CFRs is a function of improved COVID-19 treatments, more testing, more healthy people catching the virus, a less lethal form of the virus or some combination of these and other causes, it is likely that getting COVID-19 today is less dangerous than it was just three or four months ago.

And there will be a vaccine in the foreseeable future — whether people are willing or able to get the vaccine will be the big questions.

In the meantime, we should rejoice at the good news when we get it, even as we continue to exercise extreme prudence in protecting ourselves and loved ones from the coronavirus.

Writing in the New York Timesscience writer John M. Barry, author of “The Great Influenza: The Story of the Deadliest Pandemic in History” echoed what many epidemiologists have been saying from the beginning on how to minimize the spread of the coronavirus while still allowing the world economy to be maintained at some level of normalcy:

To stop this virus without more general lockdowns, we need “social distancing, avoiding crowds, wearing masks, washing hands and a robust contact tracing system, with support for those who are asked to self-quarantine and for selected closures when and where necessary.”

In my opinion, if partisan politics hadn’t entered the public discussions at the pandemic’s outset, this excellent advice might have become habit for the vast majority of Americans much sooner. Instead, highly partisan Americans reflexively dove behind the stone walls of their respective political groups at the first sound of partisan sniping.

For that failure, I blame the news media and both American political parties. [And there I go, blaming people. What a hypocrite I am.]

  • K.R.K.

Send comments to: nuqum@protonmail.com

Dr. Michael Osterholm challenges the Great Barrington Declaration and the low herd immunity myth

[Headline Graphic: A Russian women wearing a mask during the 2020 Coronavirus Pandemic (Photo by https://www.vperemen.com; used under the CC BY-SA 4.0 license)]

By Kent R. Kroeger (Source: NuQum.com; October 24, 2020)

Today’s news that the U.S. reported a record number of new COVID-19 cases yesterday (83,000+) did not surprise anyone who has been listening to Dr. Michael T. Osterholm, Director of the Center for Infectious Disease Research and Policy (CIDRAP) at the University of Minnesota, since this coronavirus pandemic began.

When many politicians and news media celebrities in March and April were talking about the pandemic as a single surge as part of a one large wave, Dr. Osterholm and  his CIDRAP colleagues were warning that there would be multiple waves with the biggest likely occurring in the Fall.

Score one for Dr. Osterholm and CIDRAP.

When President Trump and more than a few media-selected experts were anticipating the fast development of a SARS-CoV-2 (COVID-19) vaccine, perhaps by summer’s end, Dr. Osterholm was on Joe Rogan’s podcast saying it would take many months, well into next year, before a vaccine could even conceivably be available for wide distribution.

Right again.

When Dr. Osterholm went on NBC’s “Meet the Press” last Sunday and said that the next few months with be the darkest of the pandemic and the country, I took it seriously, even as I am a skeptic about the utility of widespread or selective economic lockdowns and remain optimistic that falling case fatality rates are a sign that treatments are becoming more and more effective against this viral scourge.

Dr. Osterholm would probably classify my views as naive and potentially deadly.

So when Dr. Osterholm on his podcast last Thursday called out the public health and epidemiological professionals who signed the Great Barrington Declaration (GBD)—which, among other things, says that “current lockdown policies are producing devastating effects on short and long-term public health” and that “simple hygiene measures, such as hand washing and staying home when sick should be practiced by everyone to reduce the herd immunity threshold”—I listened.

Herd immunity is when so many people in a community become immune to an infectious disease that it stops the disease from spreading.

Where Dr. Osterholm takes greatest issue with the GBD is its suggestion that we can “reduce” the herd immunity threshold, which CIDRAP any many epidemiological experts estimate to be around 50 to 70 percent of the population.

Though no specific herd immunity threshold is cited in the GBD itself, some of its signers and a minority of epidemiological experts have suggested coronavirus herd immunity thresholds are much lower than 50 to 70 percent of the population, perhaps as lows as 20 to 30 percent.

What says Dr. Osterholm to those lower herd immunity estimates?

“That figure is the most amazing combination of pixie dust and pseudo-science I’ve ever seen,” says Dr. Osterholm. “Now matter how much information we supply, these myths still continue. If you look at the congregate living areas (e.g., prisons), you can see that once the virus gets into this tight space with enhanced capacity for transmission, it blows right through, well into the 60, 70 percent range.”

Unlike much of the questionable information being spread about the coronavirus, the GBD represents a genuine debate in the epidemiological community and is supported by a small, but highly credentialed group of public health experts—which is why Dr. Osterholm is so adamant in challenging some of the GBD’s ideas.

“I’ve seen studies come out that say, ‘Well, we had a house on fire and suddenly it got limited in terms of transmission and, so, herd immunity must be at 25 percent,” says Dr. Osterholm. “I’ve heard that for New York and Brazil’s Amazon region.”

Did they achieve herd immunity?

No, says Dr. Osterholm: “Enough suppressing activities were put into place and, in fact, transmission slowed down to the point that it was minimized. That didn’t mean you hit herd immunity. A place like New York City is just as ripe as ever for another outbreak.”

One of the central precepts of the GBD is that those people most vulnerable to the coronavirus can be isolated—“bubbled off” as some put it—from the general, healthier population.

Dr. Osterholm has an answer to that: “You can’t assume you can bubble off of people who are high risk. There are lot of people in our society who are of high risk. How do you bubble people who have increased BMIs (Body Mass Indexes) who are 35 years of age. How do you bubble if you live in a house where you are the essential worker and you come home to a multi-generational family of grandpa and grandma and your kids.”

And what is Dr. Osterholm’s view on the next best steps to combat the coronavirus?

“We want to keep everyone from getting infected until we have a vaccine available,” he says, noting that a safe and effective effective is still six to eight months away in his estimation.

But this herd immunity dispute isn’t just an exercise of the scientific method, it is a moral one in Dr. Osterholm’s opinion: “I think it is immoral, frankly, to think we should just let a lot of people get infected.”

Dr. Osterholm goes even further in his critique of the GDB and its signers: “The Barrington Declaration will go down as one of the worst moments that anyone who ever signed it will have in their public health career.”

Strong words by a man that has gotten far more right than wrong when it comes to making predictions about the coronavirus.

  • K.R.K.

Send comments to: nuqum@protonemail.com


There is substance in Trump’s distortions on mail-in voting

[Headline graphic: As long as I count the Votes, what are you going to do about it? A caricature of Boss Tweed by Thomas Nast in Harper’s Weekly, 1871. (This work is in the public domain in its country of origin.)]

By Kent R. Kroeger (Source: NuQum.com; October 20, 2020)

Over the past four years, the news media’s central, animating trope about Donald Trump has been accusations over his lying.

At least 66 more lies and misleading claims were uncovered over the weekend, according to a CNN report.

Admittedly, Trump’s willingness to spread unverified rumors does not help his reputation for honesty (Sorry, Mr. President, but there is, as yet, no irrefutable evidence that Hunter Biden pocketed a $3.5 million check from a Russian billionaire—though some genuinely inquisitive investigative reporting on that accusation and other Hunter Biden financial windfalls would be a refreshing chance of pace.)

However, scratch the surface of most of those 66 “lies” and we find that there is usually actual substance behind Trump’s words–even when the specific facts he cites are questionable.

The partisan dispute over the risks of mail-in voting is a prime example.

This weekend in Georgia, Trump told a crowd of supporters that mail-in voting was vulnerable to fraud, particularly in the nine states and District of Columbia where “unsolicited” ballots are allowed to be sent to all eligible voters. In Trump’s words, such ballot distribution methods are a “big con job” meant to encourage vote fraud.

CNN “fact-checkers” quickly slapped down Trump’s claim by noting that “fraud is exceedingly rare in U.S. elections — whether with in-person voting, mail voting in states where voters have to request ballots or mail voting in states where all eligible registered voters are sent ballots without having to make requests.”

But CNN’s fact-check claim is fraught with its own accuracy problem. Proven mail-in vote fraud, while rare, is hardly non-existent and one of its most egregious examples from a 2018 North Carolina congressional election stands as testament to how mail-in voting’s weaknesses can be exploited, even when limited “ballot harvesting” is allowed by state law.

“Ballot harvesting” is a process in which third parties with a potential stake in the election outcome gain unsupervised access to voters and their absentee ballots.

Yes, the accused in that North Carolina case, L. McCrae Dowless Jr., was a Republican operative whose stunningly reckless absentee vote tampering activities were well-documented by North Carolina state elections investigators and by The New York Times. But 18 other absentee voting fraud convictions have also occurred in the U.S. since the 2016 election, according to The Heritage Foundation’s Voter Fraud Database, which contains 1.298 proven cases of voter fraud occurring between 1979 and 2020. Relative to the total number of votes in those elections, the number of fraud cases is tiny. But the Heritage database nonetheless disproves any suggestion that mail-in vote fraud is non-existent or impossible.

However, it is not overt vote fraud that Trump and the Republicans are most afraid of in 2020—it is mail-in voting’s legal forms of vote-biasing that scares them. For example, systematically mailing multiple absentee ballots to some household types as opposed to others could significantly alter the composition of the voting electorate, which affects election outcomes. [I’ve already received two absentee ballots from the State of New Jersey. What could possibly go wrong with this approach to boosting voter turnout?]

Perhaps it takes a career survey researcher sensitive to response bias to recognize this feature of mail-in voting, but that is why this vote method most likely helps the Democrats in the current context. Mail-in voting disproportionately increases the chances of voting by previously low-turnout constituencies as it significantly reduces the effort required to vote.

What is wrong with that? Nothing, in my opinion, unless the vote choices made by mail-in voters are disproportionately influenced by those seeking and collecting those votes.

Historically, some of the Democrats’ most loyal constituencies generally register and turnout for elections at much lower rates than the typical Republican constituency (see Figure 1 below). Regrettably, but not surprisingly, the Republicans have done everything in their legal power to encourage these low turnouts (e.g., voter roll purges, increased barriers for voter registration, gerrymandering). Equally unsurprising, the Obama presidential campaigns most notably seized upon the potential for absentee (early) voting to lift those low response rates. Their belief that Democrats would be in a far superior electoral position than Republicans if Blacks and Hispanics voted at rates similar to whites is supported by the numbers.

Figure 1: Reported Voting Rates by Race and Hispanic Origin: 1980-2016 (Source: U.S. Census Bureau)

Prior to the current century, absentee voting was largely the domain of military members, the elderly and white, affluent Americans (i.e., people who are home-bound, live overseas or travel frequently), but with the John Kerry and Barack Obama  campaigns, the Democrats increasingly pursued a Get-Out-The-Vote (GOTV) strategy that placed more emphasis on absentee (early) voting over traditional in-person voting. To do that, they dramatically increased voter registration efforts and aggressively encouraged likely Democratic voters to apply for absentee ballots (in states where that was necessary). Every vote already counted as an absentee vote meant more money could be targeted late in a general election campaign on undecided and independent voters. The strategy worked in Obama’s two presidential elections (see the Black vote turnout in Figure 1)—though it failed to help down-ballot Democrats as much as expected.

Relevant to the current debate on mail-in voting, the Democrats’ increased preference for absentee voting does not require “vote-buying” or other types of ballot fraud to be effective, even if that voting method has fraud vulnerabilities not inherent to in-person voting. But going hand-in-hand with mail-in voting, unfortunately, is “ballot harvesting” where the potential increases for election outcomes to be determined by the organizational skills (and funding) of party apparatuses rather than by the genuine will of the people.

The 2020 election is all but lost for Trump and the Republicans, but we should prepare for a mail-in voting arms race in future elections. And if what’s past  is prologue (such as the election use of TV advertising, direct mail, micro-targeting, “Big Data” analytics), expect the Republican Party machine to become every bit as effective as the Democrats in exploiting mail-in voting and “ballot harvesting.”

It is a competition that I fear will do little to make our elected representatives more responsive to constituents’ interests but do a lot to ensure that the large donors who fund these mail-in and vote harvesting operations will maintain their stranglehold over U.S. public policy.

  • K.R.K.

Send comments to: nuqum@protonmail.com

The trade-off between economic growth and coronavirus containment

[Headline graphic: Components of the coronavirus: The Spike S protein, HE protein, viral envelope, and helical RNA; Graphic by https://www.scientificanimations.com; Used under the CCA-Share Alike 4.0 International license.]

By Kent R. Kroeger (Source:  NuQum.com; October 19, 2020)

Our World In Data (OWID), a non-profit organization that provides open-source access to worldwide economic and development data, recently asked a simple question on its website: Have the countries experiencing the largest economic decline performed better in protecting the nation’s health, as we would expect if there was a trade-off?

Using cross-sectional data for 38 countries on 2020-Q2 GDP growth and the number of COVID-19 deaths per capita (through June 30th), their answer was as straightforward as their question:

“Contrary to the idea of a trade-off, we see that countries which suffered the most severe economic downturns – like Peru, Spain and the UK – are generally among the countries with the highest COVID-19 death rate.

And the reverse is also true: countries where the economic impact has been modest – like Taiwan, South Korea, and Lithuania – have also managed to keep the death rate low. 

As well as saving lives, countries controlling the outbreak effectively may have adopted the best economic strategy too.”

OWID’s finding is consistent with other expert findings on the economic trade-offs associated with controlling the coronavirus:

“The coronavirus trade-off was always an illusion. Lockdown or not, there is no alternative to conquering the disease if economies are to recover,” Bloomberg economics writer John Authers concluded in June after comparing Denmark, a country that implemented a strict lockdown early in the pandemic, and Sweden, a country that eschewed stringent lockdown measures and instead sought to achieve ‘herd immunity’ as quickly as possible. According to Oxford University’s Coronavirus Government Response Tracker (OxCGRT), Denmark’s average stringency index score through June 30th was 41 (on a 0 – 100 scale where 0 = “No policy response” and 100 = “Maximum policy response.”). In contrast, Sweden’s average score was 25.

The current data for Denmark and Sweden bolsters Authers’ conclusion. As of October 18th, according to John Hopkins University’s coronavirus tracking website, Denmark has experienced 119 COVID-19 deaths (per 1 million people), compared to 581 for Sweden. In turn, their two economies shrank by similar amounts in this year’s second quarter (-8.5% for Denmark and -8.3% for Sweden). By any objective measure, Denmark has done better than Sweden in combating the coronavirus while protecting its economy.

Statistical simulation studies on the coronavirus-economic trade-off also support the general conclusion that strict containment policies (e.g., large-scale testing and quarantines) are superior to a “no policy” approach. Using simulation models combining economic and epidemiological behaviors, economists Martin Eichenbaum, Sérgio Rebelo, Mathias Trabandt recently summarized this trade-off:

“The results suggest that testing and quarantine policies should play a central role in minimising the social costs of the COVID-19 crisis.”

The authors further noted that “the optimal simple-containment policy makes the recession worse than the no-intervention equilibrium. But the policy improves welfare because it saves an enormous number of lives.”

However, the political pressure to abandon strict containment policies because of their economic costs has proven too powerful for many public officials. The authors specifically cite the U.S. experience where many states prematurely abandoned initial containment measures which led to “short-lived economic revival followed by a surge in infections, epidemic-related deaths and a subsequent second recession.”

Donald Trump is probably not going to be re-elected president largely because of that strategic error in judgment.

Are strict containment policies (e.g., lockdowns) the key to containing the coronavirus and saving the economy?

In the U.S. case, how long did those strict lockdown measures need to be maintained during the first wave in order to minimize the second wave? Until ‘zero new infections’ were recorded for a specific amount of time? Until hospital ICU utilization rates fell below a certain threshold? Until there was a vaccine?

One problem with making definitive statements in any direction regarding coronavirus containment policies is that the pandemic is ongoing (the world reported a daily record of 411 thousand new coronavirus cases on October 16th, according to Johns Hopkins University). Everything is a moving target right now. Furthermore, the economic costs of strict coronavirus policies are often felt immediately, while their benefits can be delayed for weeks, even months. In such a dynamic environment, relating specific policies to specific outcomes (e.g., economic growth, COVID-19 deaths) is not easy.

But despite these methodological problems, researchers do have the benefit of hundreds of test subjects (i.e., countries) employing different coronavirus containment strategies at different points in time; and though they cannot randomly assign countries to specific containment strategies, there are quasi-experimental controls to mitigate the downside of that problem.

In the midst of these challenges, evidence is emerging that suggests strict lockdown policies are not the only (or even the best) approach to coronavirus containment. This becomes apparent when we compare countries based on the strictness of their coronavirus policies (as measured by Oxford’s Stringency Index), their cumulative number of COVID-19 deaths (per 1 million people), and their economic health (as measured by changes in GDP).

An Analysis of Economic Growth and Coronavirus Containment in 38 Countries

Figure 1 lists the 38 countries OWID used in the following trade-off analysis of coronavirus containment policies and economic growth for the period from January 1st to June 30th, 2020. Each country was placed into one of four quadrants based upon their relationship to the sample average for COVID-19 cumulative death rates and the strictness of coronavirus containment policies. For example, Japan and Latvia have (so far) experienced below average COVID-19 death rates while implementing some of the least stringent coronavirus policies. In contrast, Belgium and Portugal have seen above average COVID-19 death rates while pursuing some of the strictest coronavirus policies.

Figure 1: The 38 countries in this study sorted by coronavirus policy strictness and COVID-19 cumulative death rates (from January 1 – June 30).

Recall the conclusion from OWID: There is a positive relationship between low COVID-19 death rates and GDP growth rates—the presumption being that effectively fighting the coronavirus is a necessary condition for a nation’s economic health.

You’ll get little argument from me on that conclusion, but the question remains, how does a country “effectively” fight the coronavirus?

Oxford’s Stringency Index (SI) is a semi-weekly index measuring the strictness of a country’s coronavirus policies (e.g., economic lockdowns, school closings, mandatory contact tracing, etc.). From January to June, using a daily average, the Stringency Index rated the policies in the Philippines (SI = 61.3) as the strictest in the world, followed by countries such as Peru (56.2) and Italy (54.9). This conforms with news media accounts in those countries (Philippines, Peru, Italy).

On the other side of the coin, the SI rated the coronavirus policies in Taiwan (23.0), Sweden (25.4) and Japan (29.8) among the least strict from January to June. This too conforms with media accounts (Taiwan, Sweden, Japan).

With this information, I calculated the average GDP growth rate (Q2) in each of the four quadrants in Figure 1 (Note: the average was not weighted by population). Figure 2 shows the Q2 GDP growth averages for the four country groups.

Figure 2: Average GDP Growth (2020-Q2) by Policy Stringency Index and COVID-19 Deaths (per capita) Categories (n = 38 countries; numbers on vertical bar represent upper and lower estimates)

Only the difference in GDP growth rates between the first quadrant (Least Stringent/Low Death Rate) and the fourth quadrant (Most Stringent/High Death Rate) is statistically significant (t-statistic = -2.45, p = 0.028). However, within the two High Death Rate quadrants (i.e., the two plots on the right in Figure 2), there is an indication of a negative relationship between strict coronavirus policies and GDP growth: In countries hard hit by the coronavirus, it is those countries with the strictest policies that have had lower economic growth.

For a further look at these relationships, I estimated a linear model of GDP growth rates for the 38 countries, with policy strictness (average Stringency Index over the period) and the cumulative COVID-19 death rate (per 1 million people) as independent variables (see Appendix, Figure A.1). Both independent variables are statistically significant (negative) correlates with GDP growth, and with similar strength. High coronavirus death rates are associated with lower economic growth. But so are strict coronavirus policies. It leaves policymakers with an apparent ‘Damned if I do, and damned if I don’t’ choice to make when combating the coronavirus. [Though, somehow, countries such as Japan and South Korea were able to keep their death rates low while simultaneously keeping their economies relatively open.]

Final Thoughts

Sweden may have opted for the wrong strategy in controlling the coronavirus, but the net result, economically, has been similar to other European countries that adopted much stricter policies.

It is not an accident that Germany Chancellor Angela Merkel has already indicated Germany will not implement strict lockdown policies during the current, second wave of the coronavirus in Europe. Germany will find alternative, presumably more economically friendly, policies to combat the coronavirus.

“We all want to avoid a second national shutdown and we can do that,” Merkel told a session of the German Bundestag.

If you want to find economic success stories during the 2020 coronavirus pandemic up to now, don’t look to Denmark or Germany, look in East Asia.

I have my theory as to why this may be true: Culture. Culture. Culture.

Viruses do not spread as fast in cultures where people self-isolate when they feel sick, and where masks in public out of habit and kindness. Any threat to their personal freedom and privacy from aggressive contact tracing is perceived as minor compared to the potential benefit to the societal collective. And it is not top-down, state-dictated collectivism at work in countries like South Korea and Japan, but the bottom-up variety: people didn’t need to be told wearing masks and keeping their social distance was the right thing to do, they already knew.

Personal liberty helped forge the great economies of Europe and North America in the 19th and 20th centuries, but the idea that collective (bottom-up) rationality may be the engine behind future economic growth is hard to swallow for many of us raised on the moral certitude of the Founding Fathers and American exceptionalism.

The coronavirus might be making that economic philosophical battle even more palpable.

  • K.R.K.

Send comments to: nuqum@protonmail.com
or DM me on Twitter at: @KRobertKroeger1


Research Postscript:

Along with estimating a linear model for GDP growth among the 38 selected countries, I also estimated a similar model for the 50 U.S. states (plus District of Columbia). That regression model is shown in the Appendix (Figure A.2). Compared to the world model and its two predictors of GDP growth (Figure A.2), the U.S. model was not a particularly good fit of the data, despite having five predictors. Surprisingly, the strictness of state coronavirus policies (as measured by Oxford’s Coronavirus Government Response Tracker [OxCGRT]) did not come close to statistical significance. Instead, three significant correlates with state-level GDP growth in 2020-Q2 were (in order of relative effect): (1) The state’s number of COVID-19 cases (per 1 million people), (2) the state’s number of COVID-19 deaths (per 1 million people), and (3) the average annual number of flu deaths in the state (per 1 million people).

The relationship between COVID-19 cases and GDP growth in 2020-Q2 was positive. That is, states with higher relative numbers of COVID-19 cases had higher GDP growth. Conversely, the relationship with COVID-19 deaths was negative. That is, states with higher relative numbers of COVID-19 deaths had lower GDP growth. Finally, annual flu deaths had a negative relationship to GDP growth: states with a relatively high number of annual flu deaths tended to have lower GDP growth rates, all else equal. My interpretation of this last relationship is that flu deaths represent a proxy measure of a state’s health care system quality (and health of its citizens). States with a high percentage of uninsured residents or unhealthy citizens may be experiencing significantly lower economic growth due to the coronavirus as a result.

APPENDIX: Regression Output

Figure A.1: Linear Model of Q2 GDP Growth % (n = 38 countries)


Figure A.2: Linear Model of Q2 GDP Growth % (n = 50 U.S. states + D.C.)


Catholics and the Coronavirus

[Headline graphic: St. Gertrude Catholic Church (Chicago, Illinois), April 2020 (Photo by: Paul R. Burley; Used under the CCA-Share Alike 4.0 International license.)

Data used in this article can be found on GITHUB

By Kent R. Kroeger (Source: NuQum.com, October 14, 2020)

In August I posted an article discussing the importance of culture in modeling cross-national variation in coronavirus case and fatality rates. Its basic premise was that some cultures are more amenable to the individual-level behavioral changes (e.g., wearing masks and social distancing) needed to stunt the spread of the virus (i.e., East Asian collectivist cultures), while other cultures are more prone to spreading the virus (i.e., American individualism).

One reader suggested another culturally-based explanation for some of the cross-national variation in coronavirus cases, particularly among European nations: Catholicism.

My initial reaction was that the suggestion was plausible given that Belgium, France, Italy, Spain, and Mexico are majority-Catholic countries (see Figure 1) and were among the countries with the highest infection and deaths rates at that time.

Figure 1: Percentage of Catholics in European and other selected countries

Writing in early August, researchers at Georgetown University’s Center for Applied Research in the Apostolate (CARA) noted in their research blog:
“Looking globally at the most recent COVID-19 death rates per 100,000 population in countries with available data, it becomes apparent that some Catholic countries have been hit harder than others. As of yesterday, 17 countries had more than 30 deaths per 100,000 people. More than three in four of these countries have Catholic majority populations (as measured by the Annuarium Statisticum Ecclesiae and Pew Research Center estimates).
The only countries that are not majority Catholic in the 17 hardest hit are the United States (47.93 deaths per 100,000), the United Kingdom, Sweden, and the Netherlands. The latter two countries have not embraced masks and lockdowns as other countries have.”

But why would Catholic countries be more susceptible to the coronavirus? Catholicism is being confounded with more logical causal factors, I surmised. For example, Catholic-majority countries in Southern Europe are generally poorer than Northern European countries. It is also true that practicing Catholics tend to be older (a subgroup more vulnerable to the coronavirus) and have slightly larger household sizes; but, when I included country-level measures for GDP per capita, median age and average size of household in my statistical models, none came close to statistical significance.

I subsequently dismissed Catholicism as a likely factor in explaining the spread of the coronavirus, despite the prima facie evidence in its favor. [If 30 years of statistical modeling has taught me anything, don’t get too attached to seemingly plausible explanations and theories.]

However, a few days ago a former colleague sent of me a link to a 2016 study published by the Public Religion Research Institute (PRRI): Race, Religion, and Political Affiliation of Americans’ Core Social Networks, by Daniel Cox, Juhem Navarro-Rivera, and Robert P. Jones, Ph.D.

The study took an in-depth look at Americans’ closest personal relationships and found that the average American (n = 2,317) has 3.4 people in their close social network (see Figure 2), with Black protestants (n = 166) having the most (3.7 people) and the religiously unaffiliated having the least (3.2 people). Catholics (n = 502) reported 3.6 people in their close social network.

Figure 2: Social Network Sizes by Religious Affiliation (Source: PRRI)

More discriminating is the percentage of respondents with more than seven people in their close social network. Twenty-four percent of Catholics reported seven or more people in their social network, more than any other religious affiliation.

Coincidently, as I began to search for cross-national data on social network sizes (I found little), the Centers for Disease Control and Prevention (CDC) posted in its Morbidity and Mortality Weekly Report a case study about a family reunion in June-July 2020 where 20 family members from five households, including one teen exposed to SARS-CoV-2 prior to the reunion, spent three weeks at a vacation retreat.

Subsequently, 11 family members contracted the coronavirus.

“There is increasing evidence that children and adolescents can efficiently transmit SARS-CoV-2, the virus that causes coronavirus disease 2019 (COVID-19),” says the CDC report. “This investigation provides evidence of the benefit of physical distancing as a mitigation strategy to prevent SARS-CoV-2 transmission. None of the six family members who maintained outdoor physical distance without face masks during two visits to the family gathering developed symptoms.”

While these findings aren’t surprising, it highlights a possible causal mechanism for linking cultural characteristics prevalent among Catholic families with the spread of the coronavirus.

The Data

In studying the relationship of Catholic-majority countries to the spread of the coronavirus, I controlled for other factors that should correlate with cross-national differences:

I obtained data on the percentage of Catholics in 40 highly-developed countries from Catholic-Hierarchy.org (see Figure 1). For the summary measure of health care system quality I created an additive index based on three health care system components relevant to the treatment of COVID-19: (1) the number of nurses per 1,000 people, (2) the number of hospital bed per 1,000 people), and the percentage of the country’s population with medical insurance (public or private). All three health care sub-measures were converted to z-scores before creating the index score. The health care system quality index scores for each country can be seen in the Appendix (see Figure A.1).

Finally, the national-level suppression and mitigation policy daily index scores (Oxford’s Stringency Index) were averaged within each country over a period from January 20 to April 30, 2020. The intent was to assess whether stringent S&M policies early in the pandemic were effective in reducing the cumulative number of COVID-19 cases (as of October 11, 2020). The Stringency Index scores for each country can be seen in the Appendix (see Figure A.2).

The Linear Model

Figure 3 shows the linear model output for this four-variable model. All four variables were statistically significant and in the expected direction. National testing levels appear most strongly associated with the relative number of COVID-19 cases (i.e., more testing = more positive cases) with a standardized Beta coefficient (β) of 0.643, followed by stringency measures (β = -0.365), percentage Catholic (β = 0.312), and the health care system quality index (β = -0.273). [Given the small sample sample size (n = 40), take these differences in parameter estimates with a grain of salt.]

Overall, this simple, four-variable model explains almost two-thirds of the variance in COVID-19 cases per capita for the 40 countries in the sample.

Figure 3: Linear Model Predicting Number of COVID-19 Cases per 1M People for 40 Selected Countries (Regression model was weighted by population; Data sources: Johns Hopkins University – CSSE, Oxford University, OECD, Catholic-Hierarchy.org; Analytics by Kent R. Kroeger)

When we plot the 40 countries in our sample by their model prediction and actual values, some interesting outliers appear. Among those countries with relatively fewer COVID-19 cases per capita than predicted by the model, New Zealand, Hong Kong (not a country!), Iceland, Australia, Latvia, Lithuania, Denmark and Luxembourg stand out. Apparently, in controlling the coronavirus, it helps to either be a highly-controlled border (particularly an island) or a Baltic state.

On the not-so-good list–that is, more COVID-19 cases per capita than otherwise predicted by the model–are countries like Ukraine, Czechia, Israel and the U.S.

Figure 4: Predicted versus Actual Number of COVID-19 Cases per 1M People (Data sources: Johns Hopkins University – CSSE, Oxford University, OECD, Catholic-Hierarchy.org; Analytics by Kent R. Kroeger)

I admit that this model is too simple and static. In the real world, parameter estimates are themselves variable over time, not to mention that data quality (e.g., measurement error by a country’s statistical office) limits our ability to explain much of the nation-level variation.

Variables that once had a strong relationship in my early models of the coronavirus (namely, population density), have ceased to show statistical significance. Likewise, S&M policies that were once insignificant or significant in an unexpected direction (e.g., lockdown policies), now appear significant in the expected direction. According to this latest model, stringent suppression and mitigation measures work when they are adopted early in a pandemic.

Still, there are countries like Japan that have not enforced draconian S&M measures, yet have effectively controlled the spread of the coronavirus.

Culture matters, such that, in the cases of Japan and South Korea, whose histories include significant periods of authoritarian rule, citizens appear much more compliant with strict coronavirus measures regarding the wearing of masks and social distancing. In contrast is the United States where a significant percentage of the population puts a high premium on individualism and personal freedom.

There is no simple policy solution for this virus, but there is concrete evidence that culture is a significant factor in explaining how well nations are handling the pandemic. Culture can either work with for or against national efforts to control this virus.

In the above model, countries with a higher percentage of Catholics have, all else equal, a relatively higher level of coronavirus cases. I suspect this statistical relationship is driven by Catholicism’s generally larger, closer family networks. But I’m using aggregate data to explain nation-level outcomes. To understand what is really going within Catholic populations and the coronavirus, individual-level data is needed.

Furthermore, there is anecdotal evidence that religion affiliations other than Catholicism are significant factors in other countries with respect to the coronavirus. In Israel, a significant number of COVID-19 cases can be linked to the ultra-Orthodox Hasidic community’s participation in large-group religious activities. Similar religious activities in the U.S. have also been linked to cluster outbreaks of COVID-19, including a Houston, Texas Catholic Church which experienced a major cluster outbreak of COVID-19.

Is it large, tightly-knit social networks or large-group gatherings driving a seemingly a high incidence rate of coronavirus cases in countries with large Catholic populations?

Or perhaps singling out Catholicism altogether, as I’ve done here, is a mistake? Maybe it is something about groups of people congregating for any reason that is the true causal factor at play? [Who in the hell in Texas thought filling up Kyle Field stadium with 24,700 fans at the Texas A&M-Florida game last weekend was a good idea?]

What is irrefutable in my view is that there is no threat to humans more addressable at the individual-level than a viral pandemic.

Wash your hands. Wear a mask. And keep your distance.

How hard is that? It shouldn’t take a president (or any leader) setting a good example to inspire such simple and effective behavior by a country’s citizens. The end of this pandemic is in our own hands.

  • K.R.K.

Send comments to: nuqum@protonmail.com
or DM me on Twitter at: @KRobertKroeger1


APPENDIX:

Figure A.1: Health Care System Quality Index


Figure A.2: Stringency Index (Daily Avg. from January 20 to April 30, 2020)


The Democrats and GOP ignore America’s massive political center at their own risk

(Headline graphic by Sagearbor; used under the CCA-Share Alike 4.0 International license.)

By Kent R. Kroeger (Source: NuQum.com; October 9, 2020)

Why is it that the two major U.S. political parties (but particularly the Democrats) make little effort to attract voters who are, for various reasons, detached from the two-party system?

Loosely called the ‘political center,’ when they do get attention it is mostly from academics who divide them up into “independents,” “undecideds,” and ideological “centrists,” and generally dismiss them as less-informed and prone to emotional  appeals from politicians.

Occasionally, a political campaign will spend some of its finite campaign funds on attracting “centrist” voters; but, for the most part, the modern U.S. political campaign today spends the vast majority of its money on rallying their partisans and getting them to vote.

But why so little attention to a political center that is presumably capable of changing the outcome in a tight election?

According to many in the political and media establishment, the reason is simple: There is no political center in the U.S. anymore. Eligible voters are either Democrats or Republicans, even if they don’t categorize themselves as such. And those who don’t fit neatly into the GOP vs. Democrat box are essentially irrelevant.

In October 2015, The New Yorker‘s Ryan Lizza  offered this analysis: “The center is dead in American politics.”

Two years later, New York Magazine’s Eric Levitz shared a similar epiphany with readers: “The Democrats can abandon the center—because the center doesn’t exist.”

If two New York-based writers can’t convince you that the political center is irrelevant, let New York-based data guru Lee Drutman take a stab:

“Stop me if you’ve heard this one before: Independent voters will decide the election. Or better yet: Moderate voters will decide the election. Or, wait for it … If Democrats can move to the middle, they will win in 2020.

These tropes conjure up a particular image: a pivotal bloc of reasonable “independent” voters sick of the two major parties, just waiting for a centrist candidate to embrace a “moderate” policy vision. And there’s a reason this perception exits: You see just that if you look only at topline polling numbers, which show 40-plus percent of voters refusing to identify with a party, or close to 40 percent of voters calling themselves moderates.1 But topline polling numbers mask an underlying diversity of political thought that is far more complicated.

Moderate, independent and undecided voters are not the same, and none of these groups are reliably centrist. They are ideologically diverse, so there is no simple policy solution that will appeal to all of them.”

Drutman’s data-driven argument is thick with condescension and contempt for segments of U.S. society (moderates, independents and undecided voters) for which he offers one insightful observation: “None of these groups are reliably centrist.”

Drutman’s observations, however, are not novel. Political scientists have been marginalizing the political center for over 60 years, starting with the seminal work, The American Voter, and reinforced more recently by Christopher Achen and Larry Bartels in their 2016 book,  Democracy for Realists: Why Elections Do Not Produce Responsive Government, in which they concluded the electorate neither understands nor particularly cares about policy, but instead are motivated by their group identities when making political choices.

“Most democratic citizens are uninterested in politics, poorly informed, and unwilling or unable to convey coherent policy preferences through ‘issue voting,'” write Achen and Bartels. “Voters, even the most informed voters, typically make choices not on the basis of policy preferences or ideology, but on the basis of who they are—their social identities.”

In summarizing  Achen and Bartel’s work, journalist Noah Berlatsky  concluded, “Voters’ policy choices typically demonstrate not thoughtful centrism, but galumphing ignorance and indifference.”

What is clear from the work of Drutman, Achen, Bartels and other political scientists, they have never worked in a competitive consumer environment. If a data analyst ever came to me and said, “We can’t build our customer base because our non-customers are too diverse and unpredictable,” that person would be re-assigned to accounting.

What political scientists are basically saying is that there is no policy solution to attract disengaged voters that fit their notion of what defines the political left and right.

As I will show below—and as Drutman actually finds but does not acknowledge in his own analysis–there is a large segment of the U.S. vote-eligible population with policy preferences out of alignment with elite assumptions on how someone’s policy views should relate to their self-ascribed ideology and partisanship.

For example, there are registered Democrats who are pro-gun control yet support strictly limiting immigration into the U.S; just as there are registered Republicans who are skeptical about the importance of climate change, but support increasing taxes on the wealthy. There is no stone tablet that says someone on the political left (or right) cannot be pro-life and also a strong supporter of Medicare-for-All.

Not only do people with hard to categorize opinions exist, there are a lot of them. And many of them vote—though not to the degree as strong partisans. Therefore, they may be an expensive vote to capture, but given their numbers, they may well be worth the effort.

When Drutman and his Manhattan happy hour companions dismiss the ideological inconsistencies of the political center, they are in fact describing and enforcing the artifice of a political system designed to marginalize a significant percentage of Americans.

Through their personal, day-to-day interactions with friends and family, as well as their regular diet of mainstream news, Americans have come to believe some issue positions are inherently incompatible with correct-thinking liberals or conservatives.

It’s a self-reinforcing feedback loop that serves the two major political parties and their corporate patrons very well. What better way to guarantee the American voter will only support one of the two establishment parties than to make the average American think there are only two rational choices on Election Day.

In reality, there is a significant percentage of Americans largely disconnected from the dominant narrative driving today’s political discussion about political ideology, partisanship and policy.

So why are so many in the national media so determined to convince Americans that the U.S. no longer has a political center?

Perhaps the Chinese philosopher Lao Tzu offers a clue:

“If you search everywhere, yet cannot find what you are seeking, it is because what you seek is already in your possession.”

I prefer the axiom’s complement, first articulated in my recollection by Sherlock Holmes:

“You can’t find what you aren’t looking for.”

An apparent consensus of political and media elites conclude that the political center doesn’t exist in the U.S. because they simply aren’t looking for it.

When one actually looks at the data, however, a large and politically relevant political center is impossible to miss.

The Data

For the following charts, I analyzed the American National Election Studies (ANES) 2019 Pilot Study, an internet-based survey of 3.000 U.S. adults conducted by YouGov.com from December 20-31, 2018. The data for the charts below are weighted to match national characteristics on gender, age, race/ethnicity, education, geographic region, and presidential candidate choice.

This survey, now over one year old, was chosen for its public availability and the wide range of policy questions it asked respondents in the month after our last nationwide election.

The Results

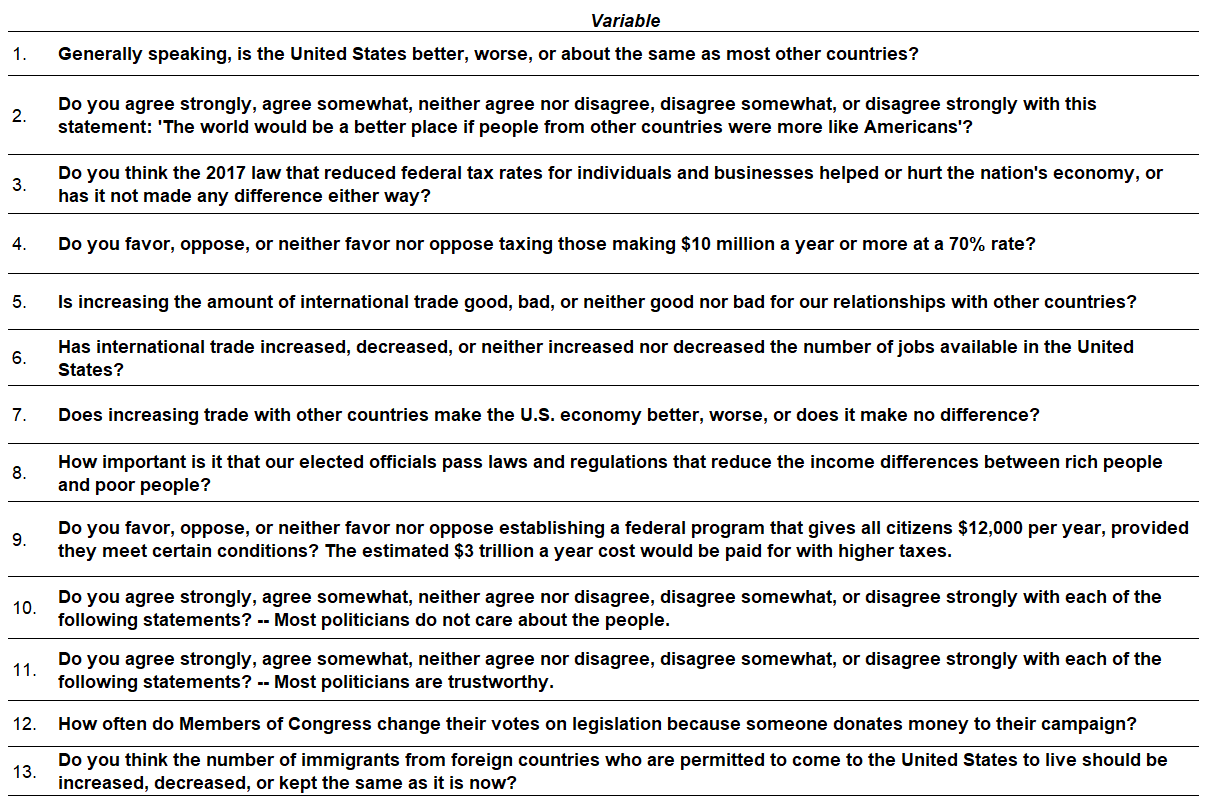
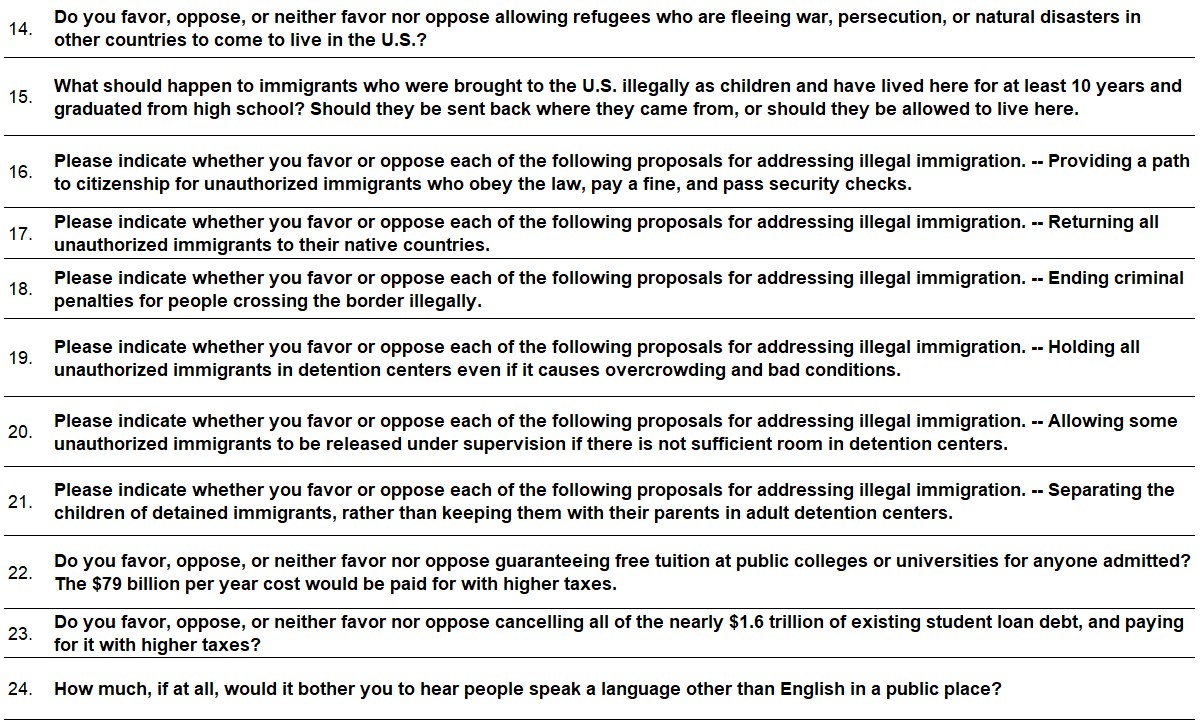
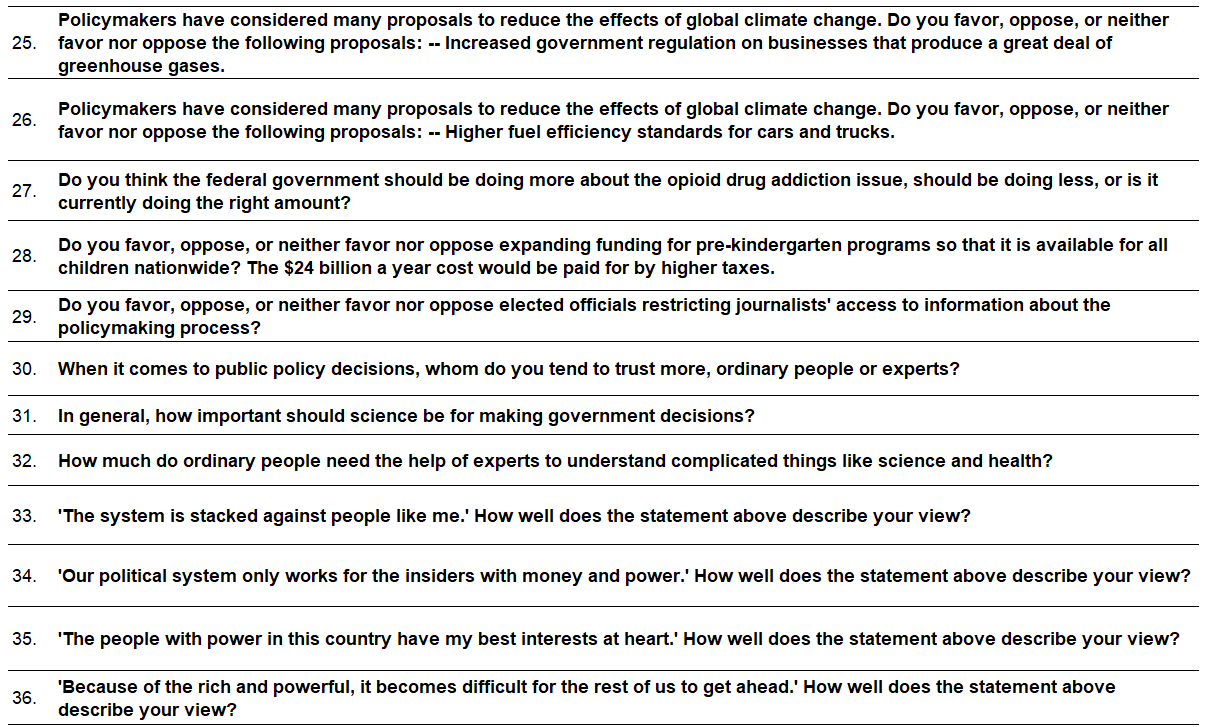
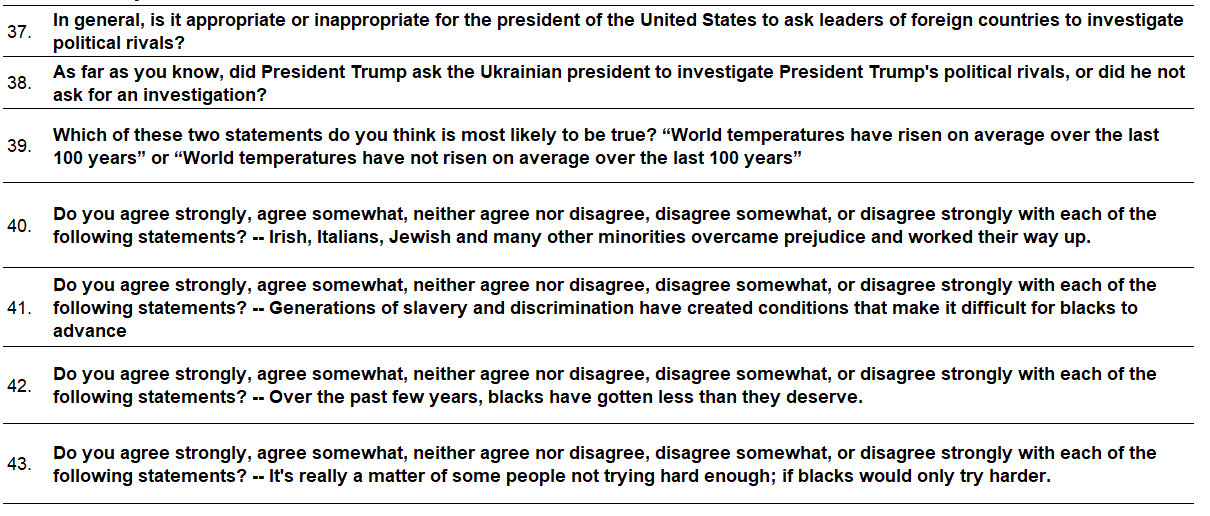
To facilitate this data presentation, I segmented the U.S. adult population into six policy clusters based on 43 attitudinal and policy-related questions in the ANES 2019 Pilot study and sorted these segments based on their relationship to respondents’ self-described ideology (see Figures 1a and 1b below). The policy clusters are as follows (from most supportive of Trump to least): Strong Conservative, Moderate Conservative, Center-Right, Center-Left, Moderate Liberal, and Strong Liberal.

The attitudinal and policy items used for the cluster analysis are listed in Appendix A below.

While my naming convention confounds the two distinct concepts of partisanship (Republican-Democrat) and ideology (Conservative-Liberal), it is important to emphasize that this attitudinal segmentation is based solely on policy attitudes and opinions.

Figure 1a: The Six Policy Clusters

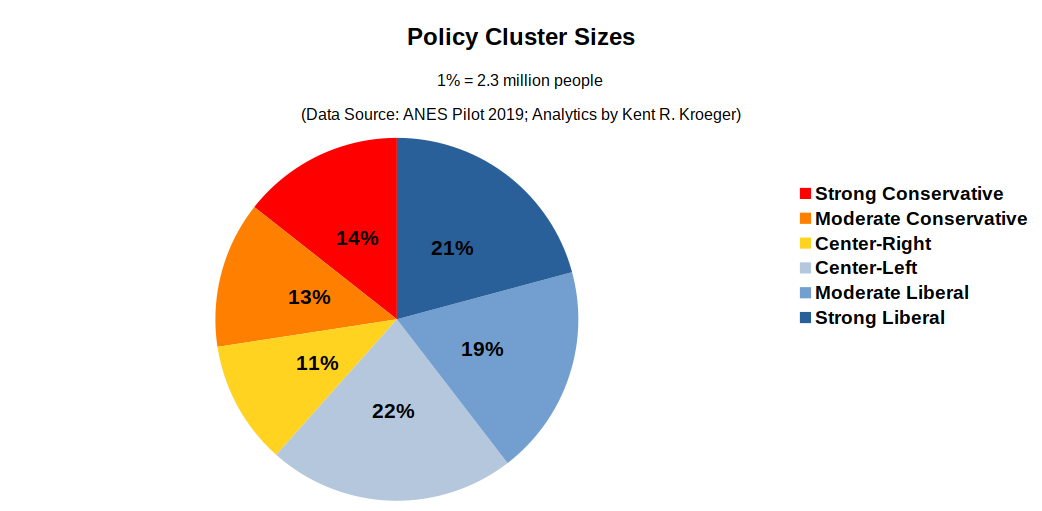
Figure 1b: The Six Policy Clusters by Self-described Ideology

In December 2018, a month after the Democrats regained the U.S. House in the midterm elections, strong and moderate liberals far outnumbered strong and moderate conservatives (40 percent to 27 percent, respectively). The largest policy clusters were the Center-Left (22%, 50.6 million people) and Strong Liberal (21%. 48.3 million people) segments, and the smallest were the Strong Conservative (14%, 32.2 million people), Moderate Conservative (13%, 29.9 million people), and the Center-Right (11%, 25.3 million people).

The center of American politics may contain 76 million Americans. Even if only 40 percent vote (as in 2016), that represents about 30 million people.

Figure 2: The Six Policy Clusters by 2016 Presidential Vote Choice

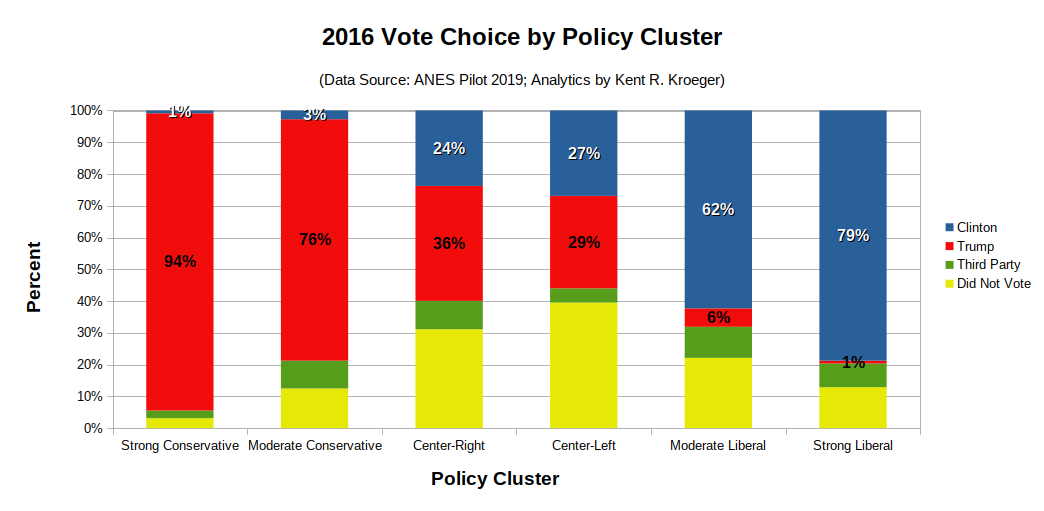
Figure 2 (above) vividly shows why Hillary Clinton lost to Donald Trump. Though her policy-related base was probably larger than Trump’s at the time, she was unable to keep their loyalty. Only 79 percent of Strong Liberals voted for Clinton compared to the 94 percent of Strong Conservatives who voted for Trump. A similar picture emerges with Moderate Liberals and Moderate Conservatives.

More interesting, perhaps, is what happened with those Americans with hard to categorize policy views (i.e., Center-Right and Center-Left).  The majority of both segments voted, but while the Center-Left was evenly divided between Trump and Clinton, the Center-Right decisively preferred Trump over Clinton (36% to 24%, respectively).

If we account for the different sizes of these six policy clusters, we can infer from Figure 3 that there were enough Trump voters among the Center-Left that had Clinton persuaded one-sixth of them to vote for her instead of Trump, she would have gained around 2 million additional votes.

Remember she lost the Electoral College by around 70,000 votes in a handful of key states (MI, PA, WI).

Figure 3: The Size of the Six Policy Clusters and their 2016 Presidential Vote Choice

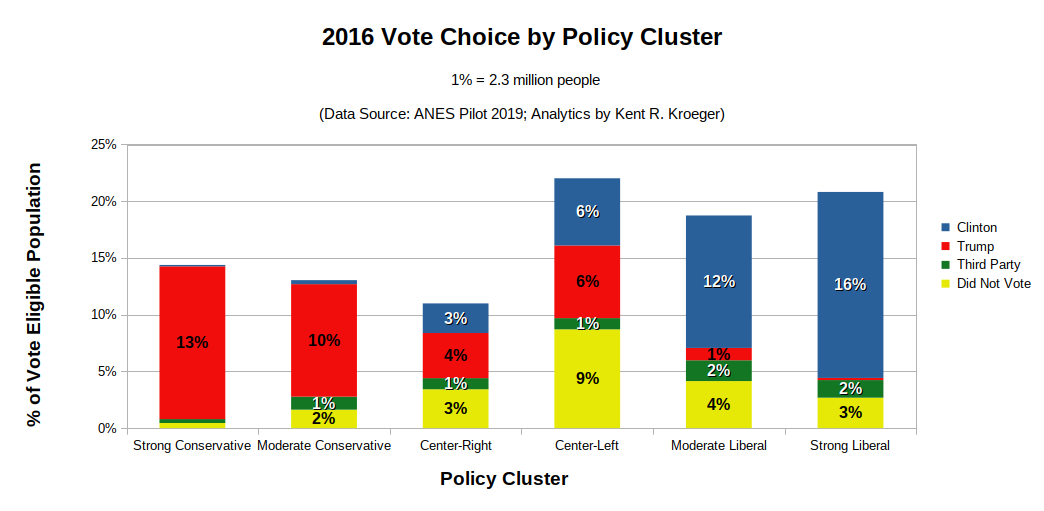
While many factors in 2016 assembled to create the perfect anti-Clinton storm, a contributing ingredient was her inability, in contrast to Trump, to attract voters in the political center.

Clinton’s failure is evident in the volumes implied in Figure 3:

  • Around 2 million Moderate Liberals voted for Trump.
  • Around 14 million Center-Left voters voted for Trump.
  • Around 4 million Moderate Liberals voted Third Party.
  • Around 4 million Strong Liberals voted Third Party.

Who is in the political center?

As Drutman found, categorizing the political center is not easy. They are a motley blend of various social backgrounds and attitudes. The center is far from homogeneous. But, according to data from the ANES 2019 Pilot Study, centrists do stand out from the other policy clusters across a number of key demographic measures.

Compared to the other policy segments, the two center clusters are younger, more female, less educated, and living in lower-income households (see Appendix B below for the detailed demographic charts).

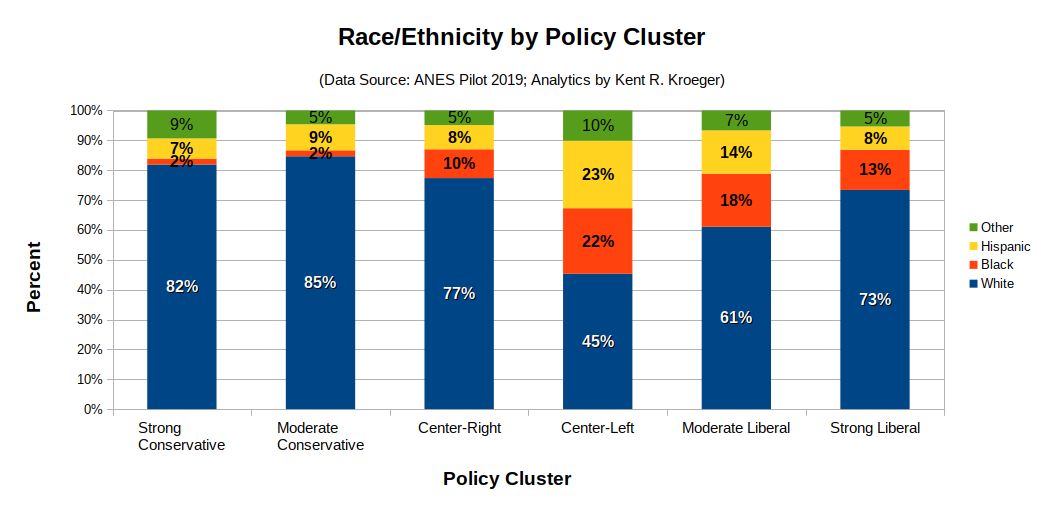
The two center clusters do, however, differ substantially from each other on race/ethnic composition (see Figure 4). Fifty-five percent of Center-Left members are non-white, compared to only 23 percent of the Center-Right.

Figure 4: The Six Policy Clusters by Race/Ethnicity

The Center-Left is racially and ethnically diverse, and the Center-Right much less so (though the Center-Right is the most diverse of the three right-of-center clusters).

Notable also is that the three left-of-center clusters are substantially more diverse in terms of race/ethnicity than the three right-of-center clusters. There should be no doubt among political operatives that the growing racial/ethnic diversity of the American population currently works in the favor of the Democratic Party. But, as I will show next, that conclusion must include a recognition that there are policy issues—should they become election drivers—that could driver Center-Right voters to the left and, vice versa, drive Center-Left voters to the right.

The Democrats have been ceding the Center to the GOP

Arguably, at least since the 1990s, establishment leaders for both the Democrats and Republicans have eschewed compromise on their party’s core issues. For the Democrats, no issue is as central to the party’s ideology as abortion rights.

Prior to the 2016 campaign, Democratic Party platforms and presidential candidates had generally argued for making abortions “safe, legal, and rare.” With the 2016 and 2020 campaigns, however, the Democratic Party platform dropped that rhetorical pretense and opted, instead, for an uncompromising view of abortion rights:

Democrats believe that every woman should be able to access high-quality reproductive health care services, including safe and legal abortion…

…Democrats oppose and will fight to overturn federal and state laws that create barriers to women’s reproductive health and rights. We will repeal the Hyde Amendment, and protect and codify Roe v. Wade.

In practical terms, the national Democrats believe an abortion should face restrictions no greater than that for getting a tooth pulled. The national Republicans, for their part, have been consistently anti-abortion since the Supreme Court’s 1973 Roe v Wade ruling.

As for the Republicans, among their ideological blind spots, no issue activates their lizard brain faster than the concept of universal, single-payer health care.

‘Socialized medicine!’ the GOP cries anytime even modest health care reform measures–such as Obamacare–are considered in Congress. Obamacare–a reform whose core idea is to unleash the IRS on Americans who refuse to buy health insurance–is to ‘socialized medicine’ what former New Jersey Governor Chris Christie is to Olympic pole vaulting.

Given how polarized party leaders are on these two issues–abortion and universal health care–it is surprising the Democrats are choosing to ignore a large number of people they may be losing at election time because they are not consistently marketing their candidates to the political center.

For example, the 2016 Clinton campaign may have lost two million potential votes for failing to appeal more aggressively to Center-Right voters on abortion rights. According to data from the ANES 2019 Pilot Study, 33 percent of Center-Right say they would be at least “moderately upset” if abortion restrictions were increased (see Figure 5). That translates to 8.3 million people in a segment where only 6.1 million voted for Clinton in 2016.

Figure 5: The Six Policy Clusters by Attitudes Towards Abortion Restrictions

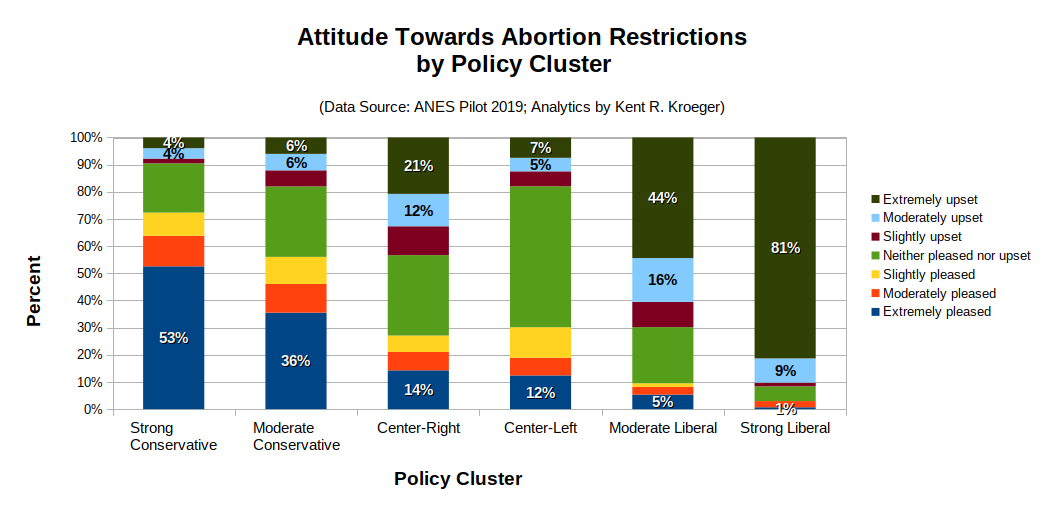
The Democrats make a similar mistake with the political center on universal health care (e.g., Bernie Sanders’ Medicare-for-All proposal). Thirty-two percent (i.e., over 8 million) Center-Right Americans at least moderately support Medicare-for-All (see Figure 5). That’s a higher level of support than among Center-Left Americans.

Figure 6: The Six Policy Clusters by Attitudes Towards Medicare-for-All

But wouldn’t a Medicare-for-All appeal by the Democrats turn off some of their core supporters? Of course that is the risk–which is why  persuasion still matters in American campaigns. Sometimes, to win elections, candidates need to lead their base as they try to expand their electoral coalition beyond their base.

It’s called strategic adjustment.

Given that health care is perennially among the most important issues to voters at election time, consider the vote potential squandered by the Democrats when they spend more time defending private health insurers and pharmaceutical companies than advocating for guaranteed, affordable universal health care. According to the ANES 2019 Pilot Study data, 48 percent of Center-Right Americans are at least “very” concerned about future medical expenses–the highest level of any of the six policy clusters (see Figure 7).

Figure 7: The Six Policy Clusters by Fear of Medical Expenses

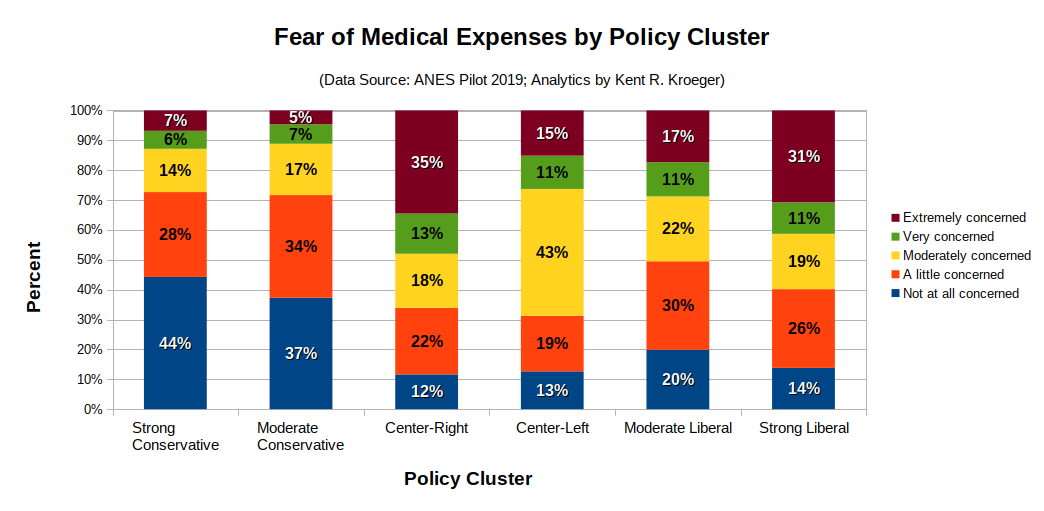
And, conversely, the Republicans jeopardize their own electoral competitiveness when the continue to oppose universal health care proposals favored by almost half of Center-Right Americans.

Final Thoughts

Let me preface my last comments on the American political center by emphasizing what is NOT meant by “making appeals to the political center.”

Centrist voters are not necessarily attracted to centrist candidates or ideas. Quite the opposite, the research suggests they are more motivated by emotional appeals than specific policy ideas; such that, namby-pamby, wishy-washy “middle-of-the-road” rhetoric is not the optimal path for gaining centrist support.

That psychological reality, however, has not produced policy outcomes in the best interests of most voters, according to Achen and Bartels.

But their conclusion is just a sophisticated, data-driven form of  ‘victim-blaming.’

Ideologically hard-to-classify Americans (“centrists”) aren’t intellectually lazy, they just have more important things to worry about than partisan politics—things like affordable health care, housing, and education, etc.

It is not surprising to me that political strategists and pundits find centrists frustrating. They don’t fit it neat little boxes, which is why Get-Out-The-Vote (GOTV) tactics are far more appealing to them than any meaningful efforts at persuasion.

Unfortunately, the fundamental mistake political strategists make when they advocate for GOTV strategies at the expense of appeals to the political center is the assumption that voters can be owned by a political party more easily than they can be persuaded.

It is a recipe for disaster, for it also assumes political parties and campaigns are static, non-strategic actors.

If the 2016 presidential campaign taught us anything, it is that parties and candidates can make substantive and abrupt strategic adjustments for a net political gain (Trump’s call in the 2016 election for renegotiating international trade agreements, closing down tax loopholes for hedge fund managers and ending America’s forever-wars are prime examples of this type of ideological flexibility). [Yes, I know Trump failed spectacularly on two of those promises, and it may cost him dearly in the 2020 election.]

The Democrats may not own the African-American or Hispanic vote going forward. Its a dangerous assumption that, while not likely to backfire in 2020, could easily do so in subsequent elections, especially if the GOP can demonstrate the level of ideological flexibility our current president did in 2016.

Ignoring the America’s political center is always a bad idea.

  • K.R.K.

Send comments to: nuqum@protonmail.com
or DM me on Twitter at: @KRobertKroeger1

APPENDIX A:

Attitudinal and Policy Items used for Cluster Analysis

APPENDIX B:

Demographic Characteristics of Policy Segments

It should be noted that probability-based margin of error calculations with the ANES 2019 Pilot Study are not applicable given the non-probability sampling methods used to recruit the YouGov national online panel. If YouGov’s online panel had been selected on a probability basis, the effective sample size in the ANES 2019 Pilot Study (n = 2,453) would have a margin of error of ±2 percentage points at the total sample level.

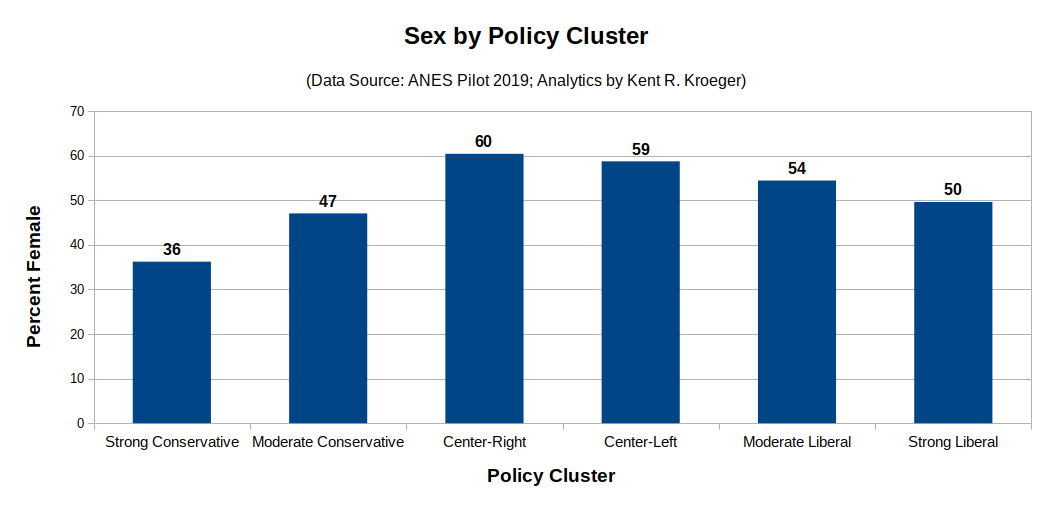
The two center policy clusters skew more female than the other policy clusters. Sixty percent of U.S. adults in the Center-Right are female, compared to just 36 percent within the Strong Conservative cluster and 47 percent within the Moderate Conservative cluster (see Figure B.1).

Figure B.1: The Six Policy Clusters by Sex

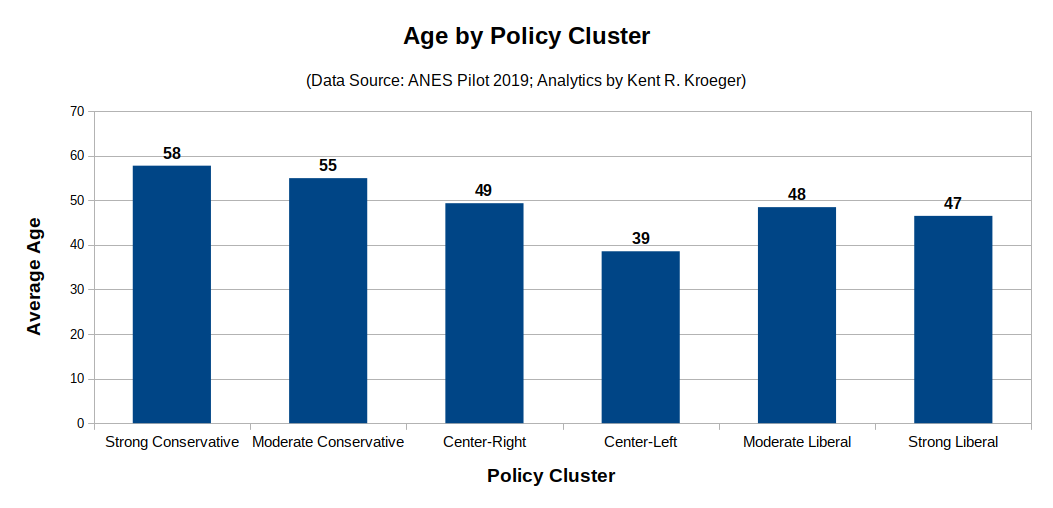
The two center clusters are more similar to the Strong and Moderate Liberal clusters in terms of average age, with members of the Center-Left being particularly young at an average age of 39 years old (see Figure B.2). Not surprisingly, the two most conservative clusters are also the oldest.

Figure B.2: The Six Policy Clusters by Age Groups

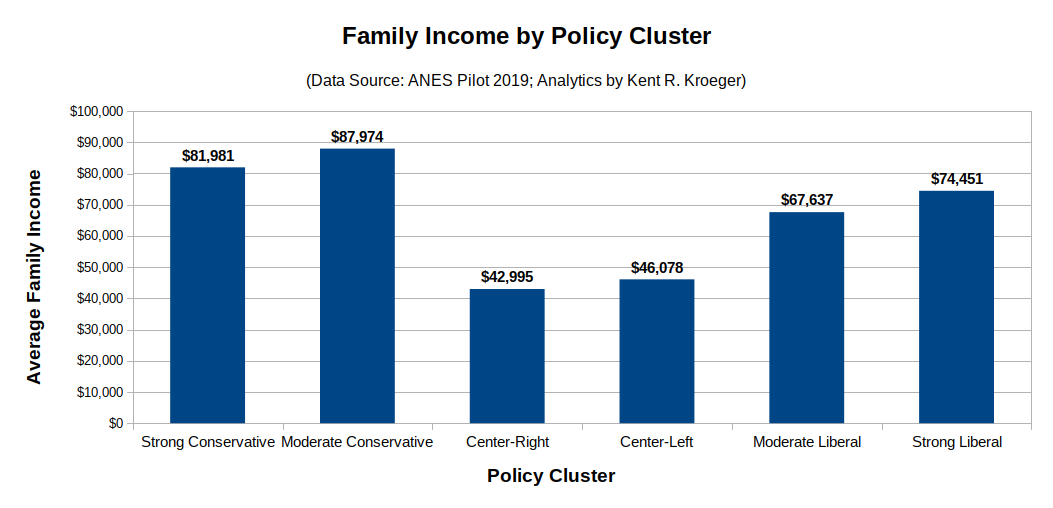
The wealthiest clusters are the Strong and Moderate Conservative clusters, both averaging over $80,000 annually for family incomes (see Figure B.3). Conversely, Center-Right and Center-Left clusters have the lowest annual family incomes ($42,995 and $46,078, respectively).

Figure B.3: The Six Policy Clusters by Annual Family Income

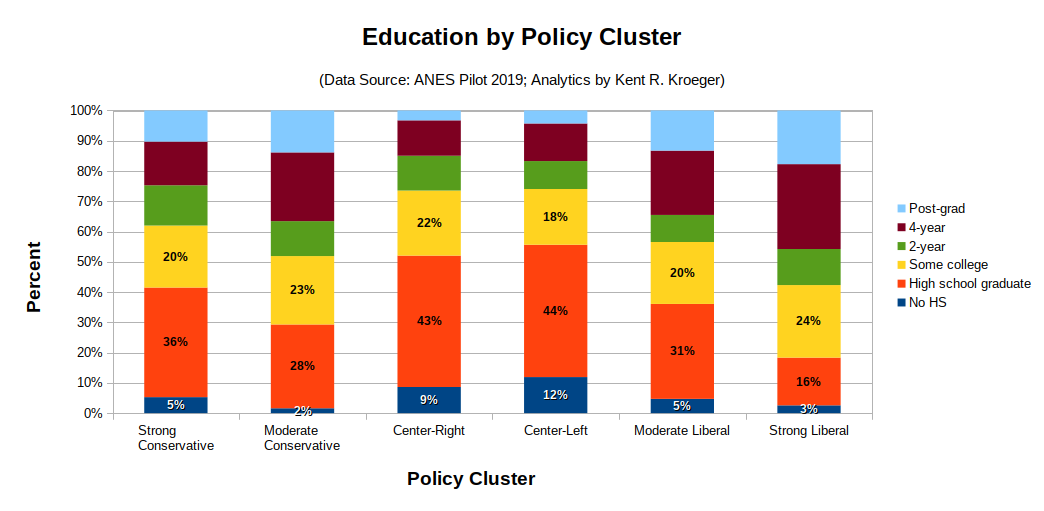
As seen in Figure B.4, the Strong Liberal cluster is more educated (45% with at least a 4-year college degree), followed by Moderate Conservatives (35%), Moderate Liberals (33%) and Strong Conservatives (24%). Less than 20 percent of members in the two center clusters have at least a 4-year college degree.

Figure B.4: The Six Policy Clusters by Education

While the two center clusters are similar in age, gender, education and income, they differ in their race/ethnicity composition (see Figure B.5). Over 50 percent of Center-Left members are non-white, compared to only 22 percent of Center-Right members. The least diverse clusters are the Strong Conservatives and Moderate Conservatives (17% and 15% non-white, respectively).

Figure B.5: The Six Policy Clusters by Race/Ethnicity Categories