[Headline graphic: Components of the coronavirus: The Spike S protein, HE protein, viral envelope, and helical RNA; Graphic by https://www.scientificanimations.com; Used under the CCA-Share Alike 4.0 International license.]
By Kent R. Kroeger (Source: NuQum.com; October 19, 2020)
Our World In Data (OWID), a non-profit organization that provides open-source access to worldwide economic and development data, recently asked a simple question on its website: Have the countries experiencing the largest economic decline performed better in protecting the nation’s health, as we would expect if there was a trade-off?
Using cross-sectional data for 38 countries on 2020-Q2 GDP growth and the number of COVID-19 deaths per capita (through June 30th), their answer was as straightforward as their question:
“Contrary to the idea of a trade-off, we see that countries which suffered the most severe economic downturns – like Peru, Spain and the UK – are generally among the countries with the highest COVID-19 death rate.
And the reverse is also true: countries where the economic impact has been modest – like Taiwan, South Korea, and Lithuania – have also managed to keep the death rate low.
As well as saving lives, countries controlling the outbreak effectively may have adopted the best economic strategy too.”
OWID’s finding is consistent with other expert findings on the economic trade-offs associated with controlling the coronavirus:
“The coronavirus trade-off was always an illusion. Lockdown or not, there is no alternative to conquering the disease if economies are to recover,” Bloomberg economics writer John Authers concluded in June after comparing Denmark, a country that implemented a strict lockdown early in the pandemic, and Sweden, a country that eschewed stringent lockdown measures and instead sought to achieve ‘herd immunity’ as quickly as possible. According to Oxford University’s Coronavirus Government Response Tracker (OxCGRT), Denmark’s average stringency index score through June 30th was 41 (on a 0 – 100 scale where 0 = “No policy response” and 100 = “Maximum policy response.”). In contrast, Sweden’s average score was 25.
The current data for Denmark and Sweden bolsters Authers’ conclusion. As of October 18th, according to John Hopkins University’s coronavirus tracking website, Denmark has experienced 119 COVID-19 deaths (per 1 million people), compared to 581 for Sweden. In turn, their two economies shrank by similar amounts in this year’s second quarter (-8.5% for Denmark and -8.3% for Sweden). By any objective measure, Denmark has done better than Sweden in combating the coronavirus while protecting its economy.
Statistical simulation studies on the coronavirus-economic trade-off also support the general conclusion that strict containment policies (e.g., large-scale testing and quarantines) are superior to a “no policy” approach. Using simulation models combining economic and epidemiological behaviors, economists Martin Eichenbaum, Sérgio Rebelo, Mathias Trabandt recently summarized this trade-off:
“The results suggest that testing and quarantine policies should play a central role in minimising the social costs of the COVID-19 crisis.”
The authors further noted that “the optimal simple-containment policy makes the recession worse than the no-intervention equilibrium. But the policy improves welfare because it saves an enormous number of lives.”
However, the political pressure to abandon strict containment policies because of their economic costs has proven too powerful for many public officials. The authors specifically cite the U.S. experience where many states prematurely abandoned initial containment measures which led to “short-lived economic revival followed by a surge in infections, epidemic-related deaths and a subsequent second recession.”
Donald Trump is probably not going to be re-elected president largely because of that strategic error in judgment.
Are strict containment policies (e.g., lockdowns) the key to containing the coronavirus and saving the economy?
In the U.S. case, how long did those strict lockdown measures need to be maintained during the first wave in order to minimize the second wave? Until ‘zero new infections’ were recorded for a specific amount of time? Until hospital ICU utilization rates fell below a certain threshold? Until there was a vaccine?
One problem with making definitive statements in any direction regarding coronavirus containment policies is that the pandemic is ongoing (the world reported a daily record of 411 thousand new coronavirus cases on October 16th, according to Johns Hopkins University). Everything is a moving target right now. Furthermore, the economic costs of strict coronavirus policies are often felt immediately, while their benefits can be delayed for weeks, even months. In such a dynamic environment, relating specific policies to specific outcomes (e.g., economic growth, COVID-19 deaths) is not easy.
But despite these methodological problems, researchers do have the benefit of hundreds of test subjects (i.e., countries) employing different coronavirus containment strategies at different points in time; and though they cannot randomly assign countries to specific containment strategies, there are quasi-experimental controls to mitigate the downside of that problem.
In the midst of these challenges, evidence is emerging that suggests strict lockdown policies are not the only (or even the best) approach to coronavirus containment. This becomes apparent when we compare countries based on the strictness of their coronavirus policies (as measured by Oxford’s Stringency Index), their cumulative number of COVID-19 deaths (per 1 million people), and their economic health (as measured by changes in GDP).
An Analysis of Economic Growth and Coronavirus Containment in 38 Countries
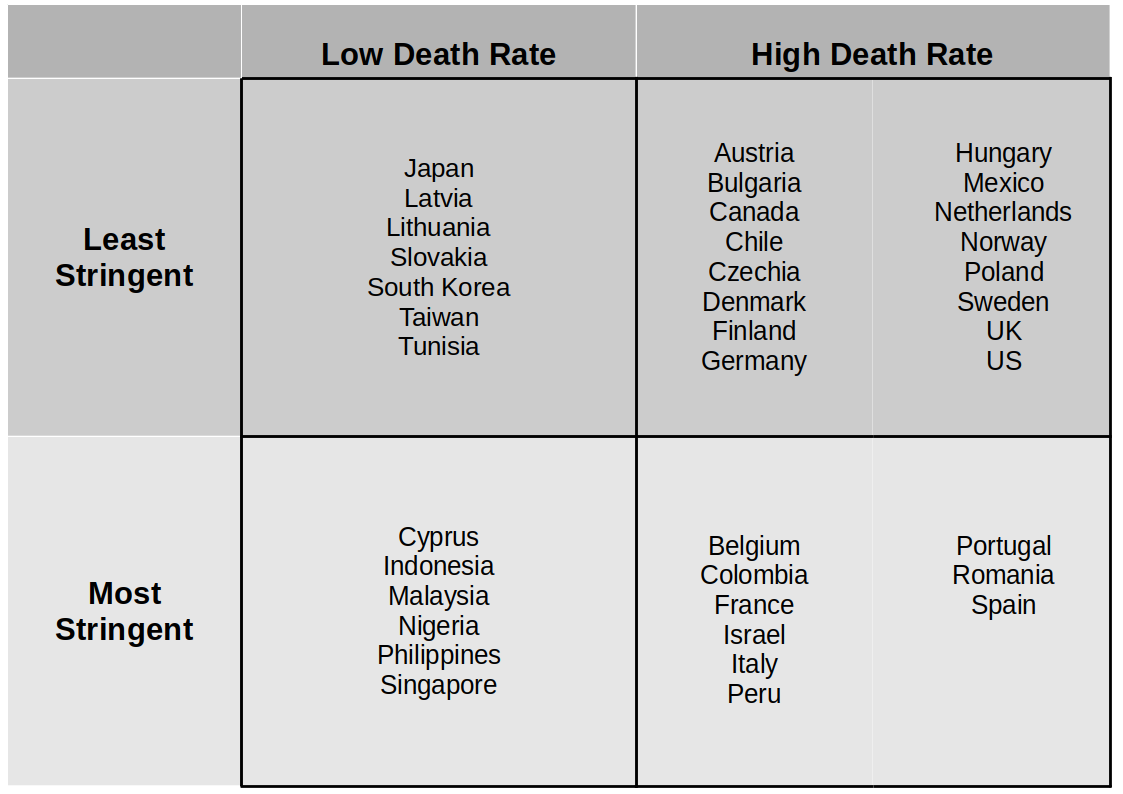
Figure 1 lists the 38 countries OWID used in the following trade-off analysis of coronavirus containment policies and economic growth for the period from January 1st to June 30th, 2020. Each country was placed into one of four quadrants based upon their relationship to the sample average for COVID-19 cumulative death rates and the strictness of coronavirus containment policies. For example, Japan and Latvia have (so far) experienced below average COVID-19 death rates while implementing some of the least stringent coronavirus policies. In contrast, Belgium and Portugal have seen above average COVID-19 death rates while pursuing some of the strictest coronavirus policies.
Figure 1: The 38 countries in this study sorted by coronavirus policy strictness and COVID-19 cumulative death rates (from January 1 – June 30).
Recall the conclusion from OWID: There is a positive relationship between low COVID-19 death rates and GDP growth rates—the presumption being that effectively fighting the coronavirus is a necessary condition for a nation’s economic health.
You’ll get little argument from me on that conclusion, but the question remains, how does a country “effectively” fight the coronavirus?
Oxford’s Stringency Index (SI) is a semi-weekly index measuring the strictness of a country’s coronavirus policies (e.g., economic lockdowns, school closings, mandatory contact tracing, etc.). From January to June, using a daily average, the Stringency Index rated the policies in the Philippines (SI = 61.3) as the strictest in the world, followed by countries such as Peru (56.2) and Italy (54.9). This conforms with news media accounts in those countries (Philippines, Peru, Italy).
On the other side of the coin, the SI rated the coronavirus policies in Taiwan (23.0), Sweden (25.4) and Japan (29.8) among the least strict from January to June. This too conforms with media accounts (Taiwan, Sweden, Japan).
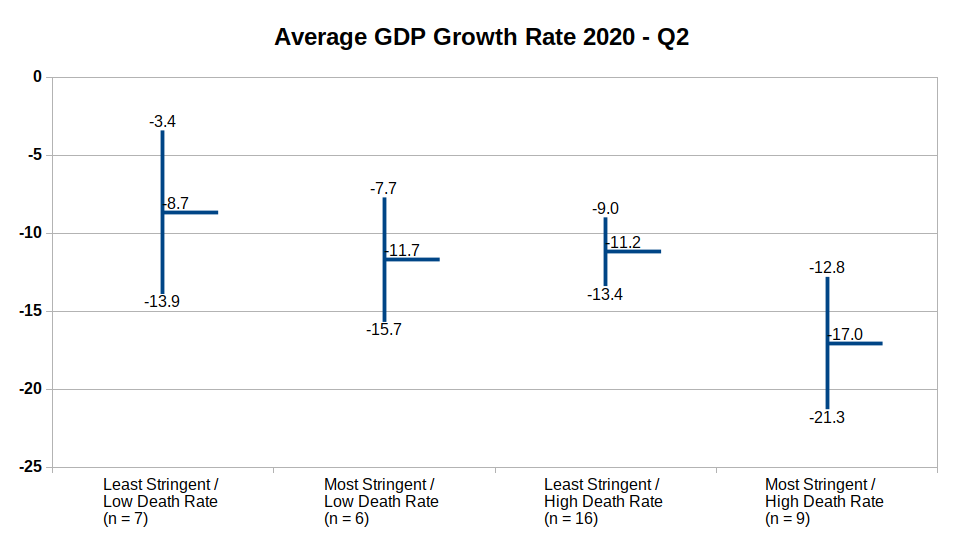
With this information, I calculated the average GDP growth rate (Q2) in each of the four quadrants in Figure 1 (Note: the average was not weighted by population). Figure 2 shows the Q2 GDP growth averages for the four country groups.
Figure 2: Average GDP Growth (2020-Q2) by Policy Stringency Index and COVID-19 Deaths (per capita) Categories (n = 38 countries; numbers on vertical bar represent upper and lower estimates)
Only the difference in GDP growth rates between the first quadrant (Least Stringent/Low Death Rate) and the fourth quadrant (Most Stringent/High Death Rate) is statistically significant (t-statistic = -2.45, p = 0.028). However, within the two High Death Rate quadrants (i.e., the two plots on the right in Figure 2), there is an indication of a negative relationship between strict coronavirus policies and GDP growth: In countries hard hit by the coronavirus, it is those countries with the strictest policies that have had lower economic growth.
For a further look at these relationships, I estimated a linear model of GDP growth rates for the 38 countries, with policy strictness (average Stringency Index over the period) and the cumulative COVID-19 death rate (per 1 million people) as independent variables (see Appendix, Figure A.1). Both independent variables are statistically significant (negative) correlates with GDP growth, and with similar strength. High coronavirus death rates are associated with lower economic growth. But so are strict coronavirus policies. It leaves policymakers with an apparent ‘Damned if I do, and damned if I don’t’ choice to make when combating the coronavirus. [Though, somehow, countries such as Japan and South Korea were able to keep their death rates low while simultaneously keeping their economies relatively open.]
Final Thoughts
Sweden may have opted for the wrong strategy in controlling the coronavirus, but the net result, economically, has been similar to other European countries that adopted much stricter policies.
It is not an accident that Germany Chancellor Angela Merkel has already indicated Germany will not implement strict lockdown policies during the current, second wave of the coronavirus in Europe. Germany will find alternative, presumably more economically friendly, policies to combat the coronavirus.
“We all want to avoid a second national shutdown and we can do that,” Merkel told a session of the German Bundestag.
If you want to find economic success stories during the 2020 coronavirus pandemic up to now, don’t look to Denmark or Germany, look in East Asia.
I have my theory as to why this may be true: Culture. Culture. Culture.
Viruses do not spread as fast in cultures where people self-isolate when they feel sick, and where masks in public out of habit and kindness. Any threat to their personal freedom and privacy from aggressive contact tracing is perceived as minor compared to the potential benefit to the societal collective. And it is not top-down, state-dictated collectivism at work in countries like South Korea and Japan, but the bottom-up variety: people didn’t need to be told wearing masks and keeping their social distance was the right thing to do, they already knew.
Personal liberty helped forge the great economies of Europe and North America in the 19th and 20th centuries, but the idea that collective (bottom-up) rationality may be the engine behind future economic growth is hard to swallow for many of us raised on the moral certitude of the Founding Fathers and American exceptionalism.
The coronavirus might be making that economic philosophical battle even more palpable.
- K.R.K.
Send comments to: nuqum@protonmail.com
or DM me on Twitter at: @KRobertKroeger1
Research Postscript:
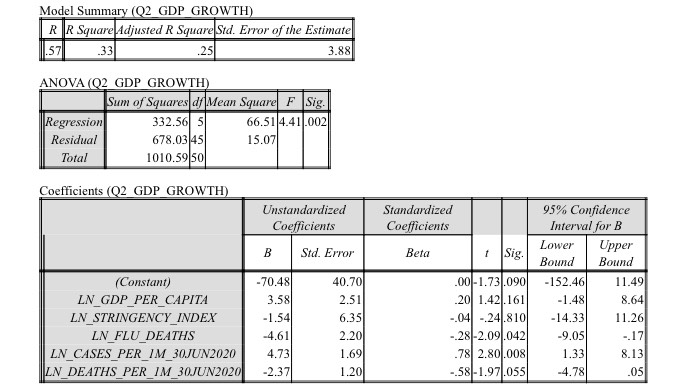
Along with estimating a linear model for GDP growth among the 38 selected countries, I also estimated a similar model for the 50 U.S. states (plus District of Columbia). That regression model is shown in the Appendix (Figure A.2). Compared to the world model and its two predictors of GDP growth (Figure A.2), the U.S. model was not a particularly good fit of the data, despite having five predictors. Surprisingly, the strictness of state coronavirus policies (as measured by Oxford’s Coronavirus Government Response Tracker [OxCGRT]) did not come close to statistical significance. Instead, three significant correlates with state-level GDP growth in 2020-Q2 were (in order of relative effect): (1) The state’s number of COVID-19 cases (per 1 million people), (2) the state’s number of COVID-19 deaths (per 1 million people), and (3) the average annual number of flu deaths in the state (per 1 million people).
The relationship between COVID-19 cases and GDP growth in 2020-Q2 was positive. That is, states with higher relative numbers of COVID-19 cases had higher GDP growth. Conversely, the relationship with COVID-19 deaths was negative. That is, states with higher relative numbers of COVID-19 deaths had lower GDP growth. Finally, annual flu deaths had a negative relationship to GDP growth: states with a relatively high number of annual flu deaths tended to have lower GDP growth rates, all else equal. My interpretation of this last relationship is that flu deaths represent a proxy measure of a state’s health care system quality (and health of its citizens). States with a high percentage of uninsured residents or unhealthy citizens may be experiencing significantly lower economic growth due to the coronavirus as a result.
APPENDIX: Regression Output
Figure A.1: Linear Model of Q2 GDP Growth % (n = 38 countries)
Figure A.2: Linear Model of Q2 GDP Growth % (n = 50 U.S. states + D.C.)


