
By Kent R. Kroeger (NuQum.com, February 8, 2020)
“Those who have knowledge, don’t predict. Those who predict, don’t have knowledge. “
— Lao Tzu, 6th Century BC Chinese Poet
In reality, Lao Tzu is quite wrong — knowledge and prediction are inseparable. Those with the most knowledge are, in fact, the best at prediction. But his admonition of overly confident forecasters (like myself) is duly noted.
A week ago, I predicted the growth of the Wuhan virus (2019-nCoV) would peak at around 17,000 confirmed cases based on a simple application of the Ratkowsky Sigmoidal Growth Model (RSGM) which has been used to model the 2013 Severe Acute Respiratory Syndrome (SARS) outbreak.
It took the Wuhan virus about two days to blow past my prediction and its spread has continued seemingly unabated. As of today (7 February), over 34,800 people have contracted the Wuhan virus and 723 have died.
What went wrong with my forecast?
Pretty much everything.
First, the RSGM may be too simplistic to generate forecasts in real-time (i.e., during a crisis). The RSGM is good for retrospectively modeling the cumulative distribution of virus cases; however, using it for forecasting a pathogen like the Wuhan virus while it is still dynamic within a population is problematic.
The RSGM estimates three parameters: (1) maximum number of cases, (2) position of the S-curve along the time axis (i.e., inflection point), and (3) the steepness of the S-curve. Forecasting becomes difficult as these parameters are not necessarily constant during an outbreak and any or all of them can vary with the occurrence of a secondary outbreak, multiple outbreak waves (as occurred in Canada with SARS), or when the virus mutates and becomes more contagious and/or lethal.
The net result is that forecasts generated early in an outbreak can be far off the final mark. As an example, Figure 1 shows how the RSGM forecasts for the total number of cases in the 2013 SARS outbreak varied systematically depending on the time of the forecast. The RSGM forecast generated for SARS at the 30-day point predicated only 40 percent of the final number of cases. Not until about 45 days into the SARS outbreak — about the halfway point — did the forecasts start to converge towards the final number. That is probably not a coincidence.
Figure 1: Ratkowsky Sigmoidal Growth Model forecasts for the total number of cases during the 2013 SARS outbreak

Second, my original forecast for 2019-nCoV occurred only eight days into the outbreak, and as I noted at the time, that was probably not enough data to generate a reliable forecast. As seen in Figure 2, at the time of my first forecast, there was a dip in the number of new daily cases (from 1,795 down to 1,472). This one-day decline heavily influenced the RSGM forecast. Had the number of new cases on the eighth day continued the prior upward trend, my forecast for the final number of 2019-nCoV cases would have been around 35,000 cases (not 17,000 as in the original of forecast).
Figure 2: Daily number of new 2019-nCov cases

Finally, I did not incorporate all available information at the time of my first forecast. While I only had eight days of data for 2019-nCoV, I could have incorporated prior information from other coronavirus outbreaks to help estimate the parameters for the 2019-nCoV forecast model. In fact, it was the RSGM parameter that places the S-curve along the time-axis that is most responsible for my first forecast’s poor performance. My first forecast predicted new 2019-nCoV would end at 21 days into the outbreak (see Figure 3 below).
We are 19 days into the 2019-nCoV outbreak (as measured from the point the WHO started tracking the outbreak on its public website) and there is no sign that this crisis is abating soon. The financial news service, Caixin Global, has reported that investment banks and economic forecasters are operating on the assumption this crisis will not end until late March. Even that is starting to feel optimistic.
Figure 3: Daily percent change in cumulative number of 2019-nCoV cases
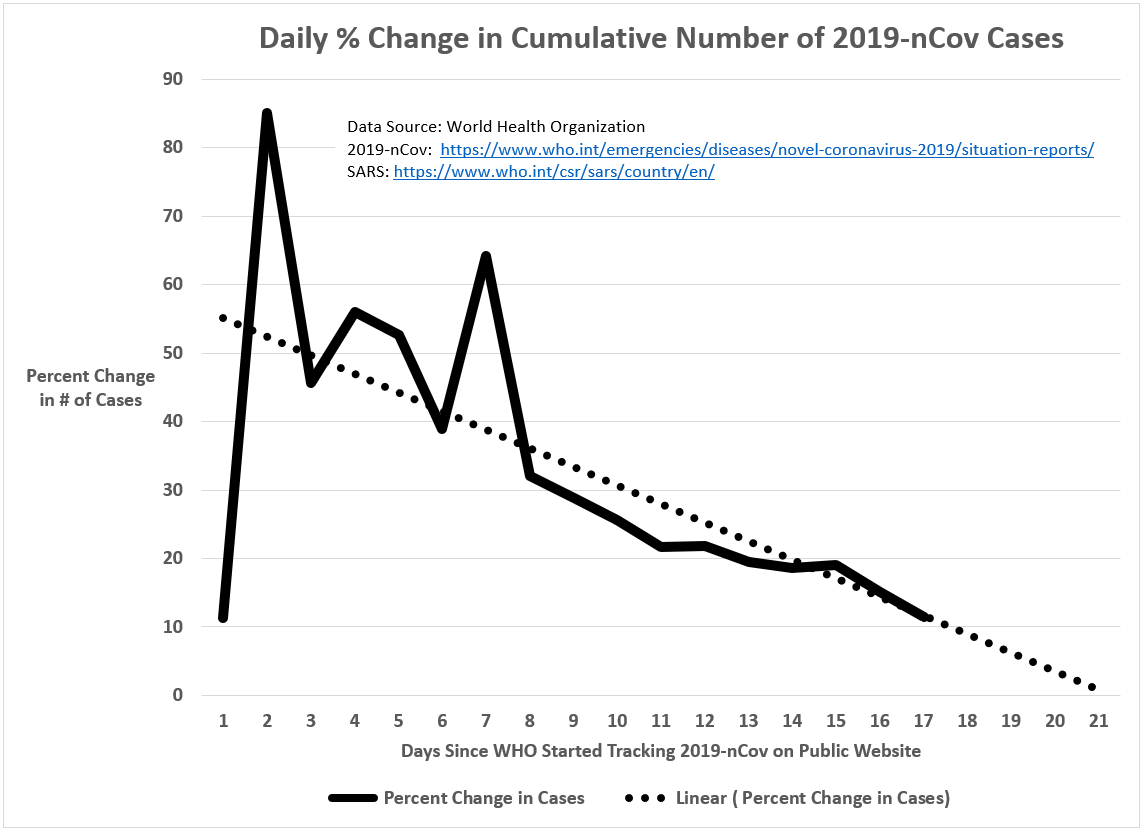
Had I built into my first RSGM forecast the assumption that the time frame for the 2019-nCoV outbreak would be similar to SARS (i.e, about 90 days), the forecast would have approached 80,000 cases (and 1,760 deaths) before this crisis is over.
An new forecast and some final thoughts
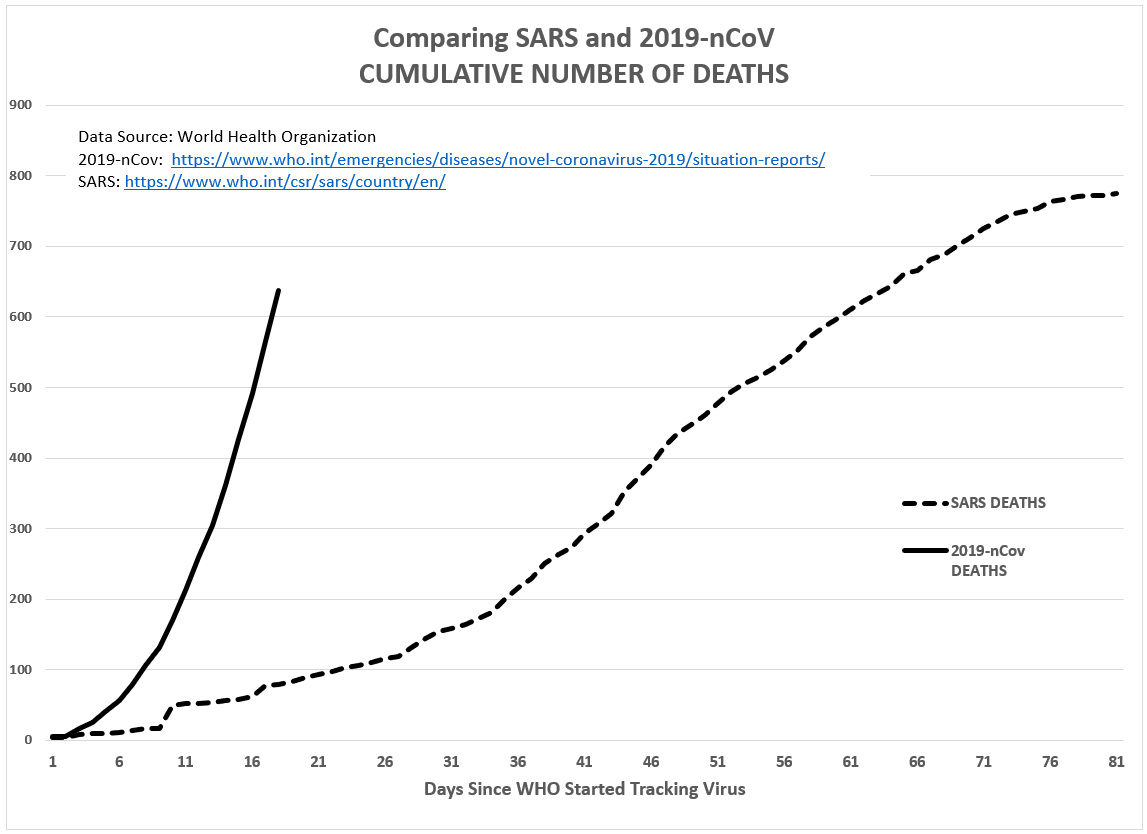
Ten more days worth of WHO data on 2019-nCoV have been added since my first forecast (see Figures 4 and 5 below) and it is clear 2019-nCoV is on a far different trajectory than SARS, a virus with a much higher mortality rate (10%) than 2019-nCoV (2%), but much less contagious.
Figure 4: Comparing cumulative number of confirmed cases (SARS v 2019-nCoV)
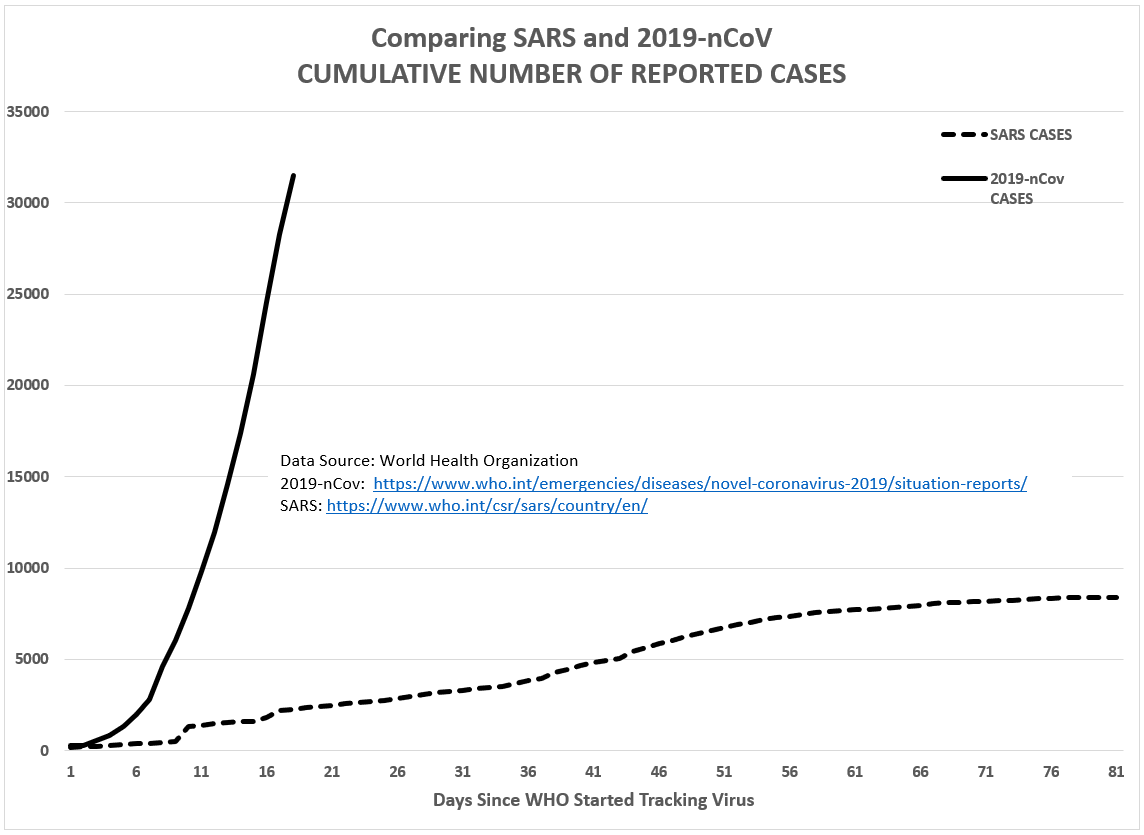
Figure 5: Comparing cumulative number of deaths (SARS v 2019-nCoV)
Using the same RSGM forecasting method as my first forecast, the model predicts this 2019-nCoV outbreak will end with 48,300 confirmed cases and 1,060 deaths. Both figures are a significant increase over the SARS outbreak.
But given that we stand at 34,963 cases and 725 deaths as of 4:00pm EST, according to the Johns Hopkins CSSE 2019-nCoV tracking website, and we’ve added 3,200 per day over the past seven days, my original forecasting method appears to produce another significant under-prediction.
However, if I build into the model the assumption that the 2019-nCoV outbreak will persist for 90 days (like SARS), the revised model’s predictions increase substantially: 161,000 confirmed cases and 3,540 deaths.
If reality comes closer to the revised RSGM forecast, 2019-nCoV is not only going to be the largest and deadliest coronavirus outbreak in modern history, it will register death totals nearer the 2018–19 Kivu Ebola outbreak in the Democratic Republic of the Congo and Uganda (2,251 deaths).
As grim as this sounds, some perspective is necessary. The World Health Organizations (WHO) reports that 400,000 Chinese die each year from communicable diseases (e.g., influenza viruses). The Wuhan virus will add no more than a minor blip to that annual statistic. But comparing the Wuhan virus to a seasonal influenza virus is not a fair comparison. The seasonal flu is predictable. We know, generally, how many people will get the flu each year and how many will die from it.
Since 2010 in the U.S., the Center for Disease Control (CDC) estimates that influenza has resulted in between 9 million and 45 million illnesses, between 140,000 and 810,000 hospitalizations and between 12,000 and 61,000 deaths annually. That computes to a mortality rate of approximately 0.14 percent. The Wuhan virus is 15 times more fatal.
“Despite the morbidity and mortality with influenza, there’s a certainty of seasonal flu,” Dr. Anthony Fauci, director of the National Institute of Allergy and Infectious Diseases, said in a recent White House briefing on 2019-nCoV. “I can tell you all, guaranteed, that as we get into March and April, the flu cases are going to go down. You could predict pretty accurately what the range of the mortality is and what the number of hospitalizations will be,” Fauci said. “The issue now with 2019-nCoV is that there’s a lot of unknowns.”
What makes a new virus like 2019-nCoV so scary is that if it infected as many Americans as the the swine flu did in 2009 and 2010 (approximately 60 million Americans), with a mortality rate of 2 percent it would kill over 1 million Americans.
That is why there is so much global attention focused on 2019-nCoV.
- K.R.K.
Please send comments and suggestions to: kroeger98@yahoo.com