By Kent R. Kroeger (Source: NuQum.com, May 5, 2020)
Note: In this article I use the terms ‘lockdown’ and ‘stay-at-home’ orders interchangeably.
There is a lot of partisan noise in the news coverage of the coronavirus (COVID-19) pandemic.
“This isn’t about science, this is about control,” Fox News host Laura Ingraham recently told her audience as she questioned the motives of those who believe the U.S. must continue to lockdown until the COVID-19 pandemic is more under control.
Meanwhile, on MSNBC, Chris Hayes was calling the hosts at Fox News “coronavirus truthers” for giving airtime to two California urgent care doctors who believe we no longer need statewide lockdowns, suggesting the cable new network’s coordinated push to “get Americans back to work” was not based on science but on ideology and blind greed.
The “lockdown” is the ideological pivot point for the current U.S. political discourse on the COVID-19 pandemic.
In dispute are three fundamental issues:
(1) What is the actual morbidity (infection) rate of the coronavirus (SARS-CoV-2)?
(2) What is the actual mortality rate of the COVID-19?
(3) How effective have the statewide locksdowns been in containing and suppressing COVID-19?
Multiple large-scale studies based on probability samples will be needed to answer these questions definitively. Suggestions that the science is already established is absurd.
Only four days ago, New York Governor Andrew Cuomo announced results from a Staten Island, New York SARS-CoV-2 antibody study that found 20 percent of residents had been exposed to the virus. For the State of New York, overall, Cuomo said 12 percent had tested positive for the coronavirus.
If the New York results can be extrapolated to the entire U.S. population (it can’t, but for arguments sake), that would mean between 39 and 65 million Americans have had the virus. As of 3 May, around 70,000 Americans have died from COVID-19, meaning a rough estimate of the mortality rate of COVID-19 is somewhere between 0.1 and 0.2 percent — a range that covers the mortality rate for an average flu season and a really, really bad flu season.
Fox News and those two California doctors should have received an apology from Chris Hayes by now.
But the reality is, this New York State and Staten Island studies are just the beginning of the research that needs to be conducted over the next year or two before we know the actual morbidity and mortality rates of COVID-19.
As we are still in the middle of this health crisis, any definitive proclamations one way or the other are generally dubious…including mine.
Have Statewide Lockdowns Helped?
It is not too early to start assessing the effectiveness of statewide “stay-at-home” orders and economic lockdowns, as whether will end them in a same and timely fashion will depend on some quantitative level of knowledge about their utility.
A superficial look at the data suggests the lockdowns are not helping much (Note: This is not my opinion on lockdowns. I am doing this data walk in order to move towards a more evidence-based opinion)
While the states hit the hardest by the COVID-19 pandemic (on a per capita basis) are mostly Democrat-dominated states that decided relatively early in the crisis to issue statewide lockdown (“Stay-at-Home”) orders, states that adopted less stringent lockdown policies (Arkansas, Iowa, South Dakota, Nebraska, North Dakota, Utah and Wyoming) appear to be doing better (see Figure 1).
Figure 1. The relative number of COVID-19 cases and deaths by U.S. State (through 3 May)
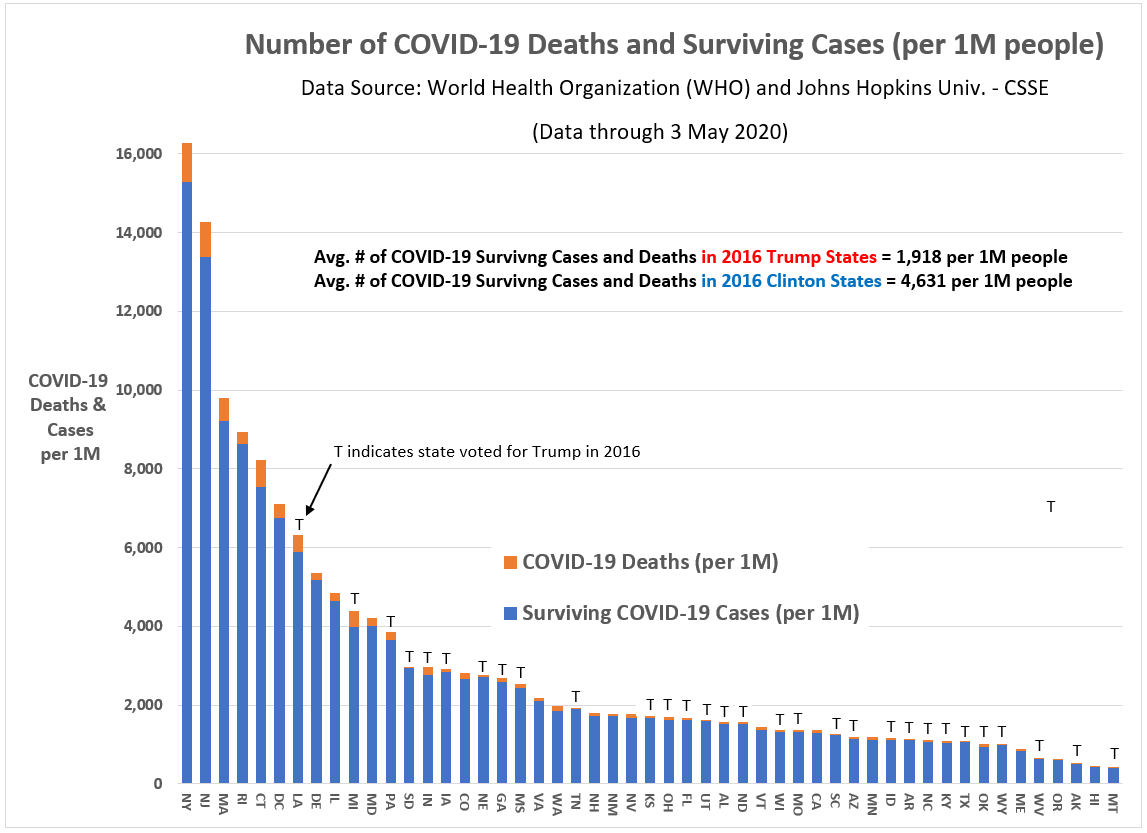
Of the 10 states (plus District of Columbia) with the highest relative number of COVID-19 cases, only two were won by Donald Trump in 2016 (Louisiana and Michigan). Conversely, among the 10 states with the lowest relative number of cases, seven were won by Trump (Montana, Alaska, West Virginia, Wyoming, Oklahoma, Texas and Kentucky).
States won by Trump in 2016 average 1,885 COVID-19 cases per 1 million people, whereas states won by Hillary Clinton average 4,818 per 1 million people. Though this difference is significant using a two-sample difference of means t-test (t-statistic = 3.47, p = .001, std. error = 846), in no way can we conclude that Trump (“red”) states are doing better than Clinton (“blue”) states.
Furthermore, the real analytic question is about the effectiveness of “Stay-at-Home” orders, which some red states did implement. In fact, the difference in the relative number of cases between lockdown (“Stay-at-Home”) states and non-lockdown states is not statistically significant; in part, because we have so few instances of non-lockdown states (n = 7).
Also complicating our ability to discern the effectiveness of lockdowns is the variation in lockdown policies across states. Indeed, even a few non-lockdown states (such as Iowa) have implemented elements of a lockdown (such as social distancing recommendations, closing bars and restaurants and forbidding large group gatherings). Perhaps those policies, not a full lockdown, are sufficient to contain the spread of COVID-19?
We must also consider that the state-level differences in Figure 1 could be driven by factors unrelated to lockdowns or other strict suppression policies (e.g., travel restrictions within and between states). For example, previously I’ve argued population density is the dominant variable in explaining state-level differences in the relative number of COVID-19 cases, not mitigation and suppression policies. Trump states are doing better in containing the COVID-19 spread in part due to those states being sparsely populated. At a minimum, we need to control for that before declaring which states are doing a better job than others.
If we further divide lockdown states into two categories — those that locked down within 20 days of their first confirmed COVID-19 case and those that took more than 20 days — we might get a clearer picture of the impact of lockdowns.
Figure 2 shows the three lockdown categories across key measures of the coronavirus. With the exception of testing, there is a linear relationship between the three lockdown categories: Early lockdown states are the highest, late lockdown states are in the middle, and non-lockdown states are lowest on key measures such as population density, relative number of cases and deaths, and changes in cases and deaths since 1 April.
Figure 2: Lockdown Categories by Key Measures (as of 3 May)

Early lockdown states are much more densely populated (690 people per sq. mile), have done more testing (25,290 per 1 million people), have more confirmed cases (4,012 per 1 million people), have more COVID-19-related fatalities (230 per 1 million people), and have experienced larger changes in cases (3,306 per 1 million) and fatalities (212 per 1 million) since 1 April.
If Figures 1 and 2 were all you knew about state lockdowns, it would be hard to declare them successful. In fact, similar “topline” data is repeatedly used in the conservative media to reinforce the narrative that the U.S. should return to work sooner rather than later.
Are they wrong?
I believe as a blanket statement — Lockdowns are not working or necessary any more— they are partially wrong. However, to support my opinion, we need to make sure our state comparisons are made on a level playing field.
Can we compare COVID-19 case and death numbers between states?
The definitional comparability problem between states in measuring COVID-19 cases and deaths is highlighted by the Centers for Disease Control (CDC) in its own tabulations and research on the virus (SARS-CoV-2) and its associated disease (COVID-19). In the CDC’s latest report on COVID-19, here is the language they use to explain why their numbers may be different from state-reported numbers:
Provisional death counts in this (CDC) report will not match counts in other sources, such as media reports or numbers from county health departments. Death data, once received and processed by National Center for Health Statistics (NCHS), are tabulated by the state or jurisdiction in which the death occurred. Death counts are not tabulated by the decedent’s state of residence. COVID-19 deaths may also be classified or defined differently in various reporting and surveillance systems. Death counts in this report include laboratory confirmed COVID-19 deaths and clinically confirmed COVID-19 deaths. This includes deaths where COVID-19 is listed as a “presumed” or “probable” cause. Some local and state health departments only report laboratory-confirmed COVID-19 deaths. This may partly account for differences between NCHS reported death counts and death counts reported in other sources.
My state of New Jersey, for example, only reports COVID-19 deaths that are test-confirmed, except in the case of nursing home deaths where “probable” cases can also be classified as a COVID-19 related death. This may account for why nursing home deaths account for nearly half of New Jersey COVID-19 deaths. Unfortunately, the New Jersey fatality numbers in nursing homes must therefore be considered problematic even if, in the words of Jon Dolan, president of the Health Care Association of New Jersey, the data are “directionally accurate.”
Yowza! Directionally accurate?!
Worse yet, these case and fatality definitions can vary depending on the state where the victim died, according to the CDC.
This is a serious problem if the goal is to compare state-level mitigation and suppression policies. Without detailed case-level data on COVID-19, researchers are at a distinct disadvantage.
Adding to this problem is an even bigger problem, in my opinion. There is significant variation in how diligently states are trying to measure the spread of the coronavirus within their state. As of 3 May, Rhode Island has conducted 67,896 per 1 million people, and New York 50,680 per 1 million. Contrast those numbers to Arizona and South Carolina where, respectively, only 11,144 and 12,467 tests per 1 million have been conducted so far.
Does this mean New York or Rhode Island’s estimate of the morbidity rates (percent of residents that have had the virus) in their respective states are more accurate than Arizona and South Carolina? Not necessarily. It will depend on a number of factors related to the quality of a state’s effort to assess the spread of the coronavirus (see Figure 3), including: (1) COVID-19 test availability, (2) training in using the test, (3) test accuracy, and (4) and selection bias (perhaps the most serious problem if the goal is to generate an unbiased estimate of a state’s morbidity rate). We must also recognize that all of these factors are moving together in time. What was true on Tuesday may not be as true on Friday.
Figure 3: A Model for Assessing the Quality of a State’s COVID-19 Measurement Effort
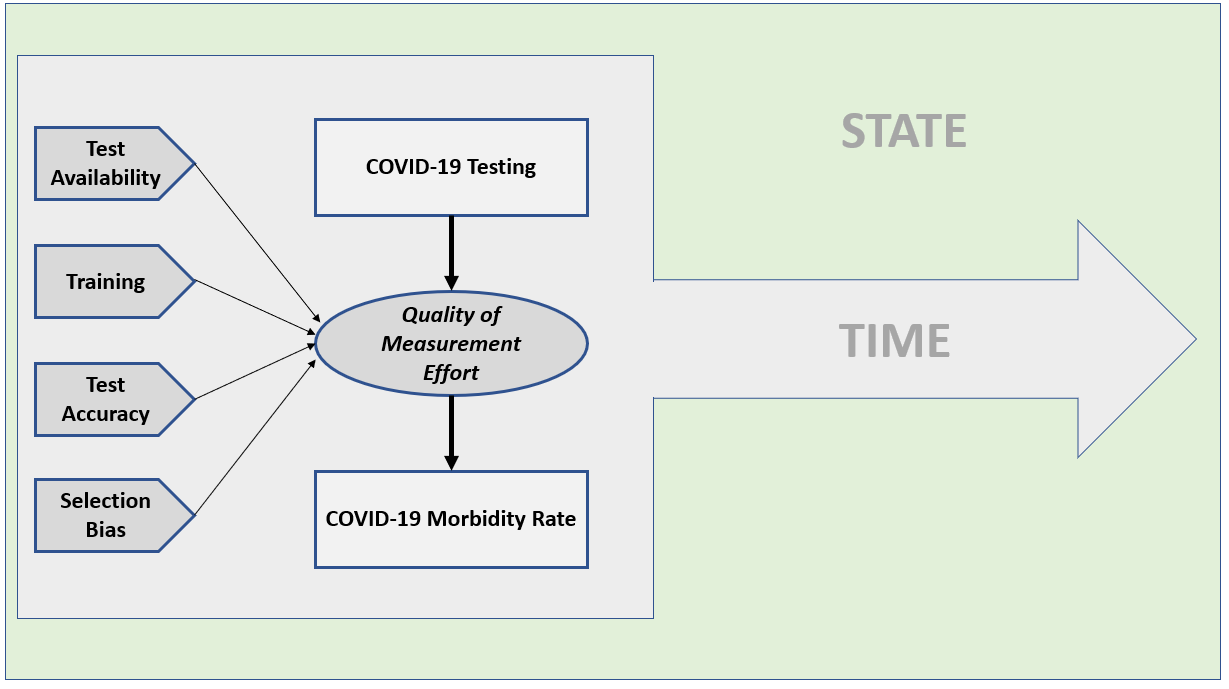
If a state is only testing health care workers and citizens with severe symptoms (as New Jersey was doing initially), their testing will miss a significant percentage of people who are asymptomatic but still contagious. That is textbook selection bias. Only some form of probability sampling will reliably measure the prevalence of this group or the overall morbidity rate in a geographic location. Some states (hopefully most) are doing that already (New York is, for example). And I am certainly not the first person to call for more random sampling in measuring the COVID-19 pandemic (others doing the same are here, here and here).
Ironically, its the supposedly anti-science Republicans in North Carolina that have pushed for probability sample testing, not the Democrats. Why? The Democrats fear random testing will reveal their fundamental rational for imposing state-level lockdowns — a high COVID-19 mortality rate relative to the common flu — likely won’t be substantiated by the science.
The problem too is that we have a lazy, politically-biased national journalism corps in this country that would rather rely on the deceptive case numbers and case fatality rates pumped out by Johns Hopkins University (JHU-CSSE) and the WHO than insist on scientifically accurate numbers, such as the estimates recently released by a Stanford University study in Santa Clara County, California, showing a significantly higher COVID-19 prevalence rate than the official numbers released by the county and state governments.
“After adjusting for population and test performance characteristics, we estimate that the seroprevalence of antibodies to SARS-CoV-2 in Santa Clara County is between 2.49% and 4.16%, with uncertainty bounds ranging from 1.80% (lower uncertainty bound of the lowest estimate), up to 5.70% (upper uncertainty bound of the highest estimate),” the study said. Those estimates translate to between 48,000 and 81,000 Santa Clara County residents having had the coronavirus (SARS-CoV-2).
At the time of the study’s field closure, April 1st, the State of California and Santa Clara County were reporting a case prevalence of just 956 in the county. The implication of this difference from the Stanford results is profound: If the Stanford study is correct, the mortality rate for COVID-19 is not nearly as high as being implied when the news media reports the Johns Hopkins University case and fatality numbers. If one of the fundamental arguments behind imposing statewide lockdowns is the purportedly high mortality rate for COVID-19 — as high as six percent if using only confirmed cases (as reported by JHU-CSSE) in the denominator — any evidence that pushes that number closer to 0.1 percent (the estimated mortality rate for the common flu) is heresy.
When two urgent care doctors in California suggested as much, YouTube attempted to remove their televised news conference from its social media platform. Facebook and Twitter, at least so far, have resisted the same action.
We don’t need to use the numbers offered by the two California doctors to argue the media-reported COVID-19 mortality rates may be seriously inflated — we have the Stanford study. But is the Stanford University necessarily right? Of course not, but at least that study’s team documented their methodology, giving readers (and the news media) something to critique.
An even larger scientific study in China found a higher fatality rate for COVID-19 than the Stanford study —2.3 percent overall and as high as 14.8 percent for people aged 80 and older. Across other age groups, the fatality rate was found to be as follows:
- Aged 70 to 79 = 8.0%
- Aged 60 to 69 = 3.6%
- Aged 50 to 59 = 1.3%
- Aged 40 to 49 = 0.4%
- Aged 0 to 39 = 0.2%
Let me now reveal my bias regarding statewide lockdown policies: If the Stanford study is correct and the COVID-19 fatality rate is similar to the common flu, it is time to end the statewide lockdowns (while maintaining strict social distancing recommendations). However, if the Chinese study is more accurate, as a man in his mid-50s, a 1.3 percent chance of dying from COVID-19 is too hot for my oatmeal — I’m staying home until there is a vaccine or reliable treatment (and anyone my age or older should do the same).
Which is why the national news media’s attempt to suppress the important scientific debate going on right now about the mortality rate of COVID-19 is reckless and counterproductive.
We may be huddling in our basements for no reason and to little effect? Is the damage being done to the world economy worth being so overly cautious? I would say, ‘No,’ particularly if people are losing their health care coverage or being saddled with large medical bills due to the pandemic.
Do you want to know a way to kill millions of Americans even faster than COVID-19? Take away their health care coverage.
Enough news media bashing. It has become too easy.
The point of this article is to make a preliminary assessment of the effectiveness of statewide lockdowns in controlling the spread and lethality of COVID-19.
Here is my take on the data (as of 3 May 2020)…
After controlling for population density (and other factors), what can we say about statewide lockdowns to control COVID-19?
My answer is not a satisfying one: it is not clear the states with lockdowns are doing better containing the effects of the coronavirus than states without full lockdowns.
One caveat to this finding is important: the COVID-19 pandemic is not over. Many non-lockdown states like Iowa and Nebraska still have not experienced a decisive peak in new daily cases. But also, keep in mind, these state-reported cases and deaths numbers are of dubious quality (see discussion above). The fact that Iowa Governor Kim Reynolds found the Utah-based company to handle Iowa’s COVID-19 testing program through D-list Hollywood celebrity and Iowa-native Ashton Kutcher should tell you all you need to know about how seriously I take Iowa’s measurement program.
[Sidebar: You would think Iowans would have learned their lessons from the Iowa Caucuses vote counting disaster last February when the Iowa Democratic Party chose another Utah-based tech company to count the votes. Are these people morons? What happened to Iowa’s once premiere public education system? That’s a debate for another article — and a heads-up, my conclusions are not kind to Iowa’s political leadership.]
Another caveat is that this is an aggregate (state-level) data analysis. It does not inform us directly about individual-level relationships. So, when you read below that the relative number of tests, indirectly, has a positive relationship to the relative number of COVID-19 deaths, this does not mean states should stop testing to reduce the number of deaths! The result means in the aggregate that states with the most relative testing are also experiencing higher relative fatality rates for COVID-19, all else equal. Correlation is not causation.
A Path Model for COVID-19 Cases and Deaths for U.S. States & D.C.
Using the JHU-CSSE data at the state-level through 3 May (see, I’m no better than those lazy journalists), I estimated a linear path model for explaining state-level COVID-19 confirmed cases and deaths.
To mitigate the noise and bias inherent in the JHU-CSSE fatality numbers, I calculate the fatality incidence as a function of the state’s total population (i.e., deaths per 1 million people). That is not the mortality rate, but its denominator is a more reliable government statistic than the confirmed number of cases.
The variables tested for their relationship to the relative number of COVID-19 deaths (natural log transformed) included:
- A state’s population density (log transformed) (Variable name: LN_P)
- The cumulative number of tests conducted by the state per 1 million people (natural log transformed) (Variable name: LN_T)
- The number of confirmed COVID-19 cases per 1M people (natural log transformed) (Variable name: LN_C)
- Whether a state imposed travel restrictions between and/or within their state (1 = Yes, 0 = No) (Variable name: TRA)
- Whether a state imposed a statewide (“stay-at-home”) lockdown policy (1 = Yes, 0 = No) (Variable name: STA)
- Governor’s political party (1 = Democrat, 0 = Republican…not a value judgment on my part) (Variable name: PAR)
I also tested variables such as the state’s percentage of vote for Trump in 2016 (sorry, but this confirms to me that the state differences seen in Figure 1 above are not substantively meaningful), GDP per capita, number of staffed beds per 1 million people, percent of state’s economy related to China, and percent of population aged 65 and older. None proved statistically significant.
And here are the results…
First, with only seven states not imposing a full statewide lockdown, it will require sizable predicted differences in relative confirmed case and death rates for the lockdown variable’s two levels to be statistically significant, regardless of whether the model is estimated in a Bayesian or Frequentist context.
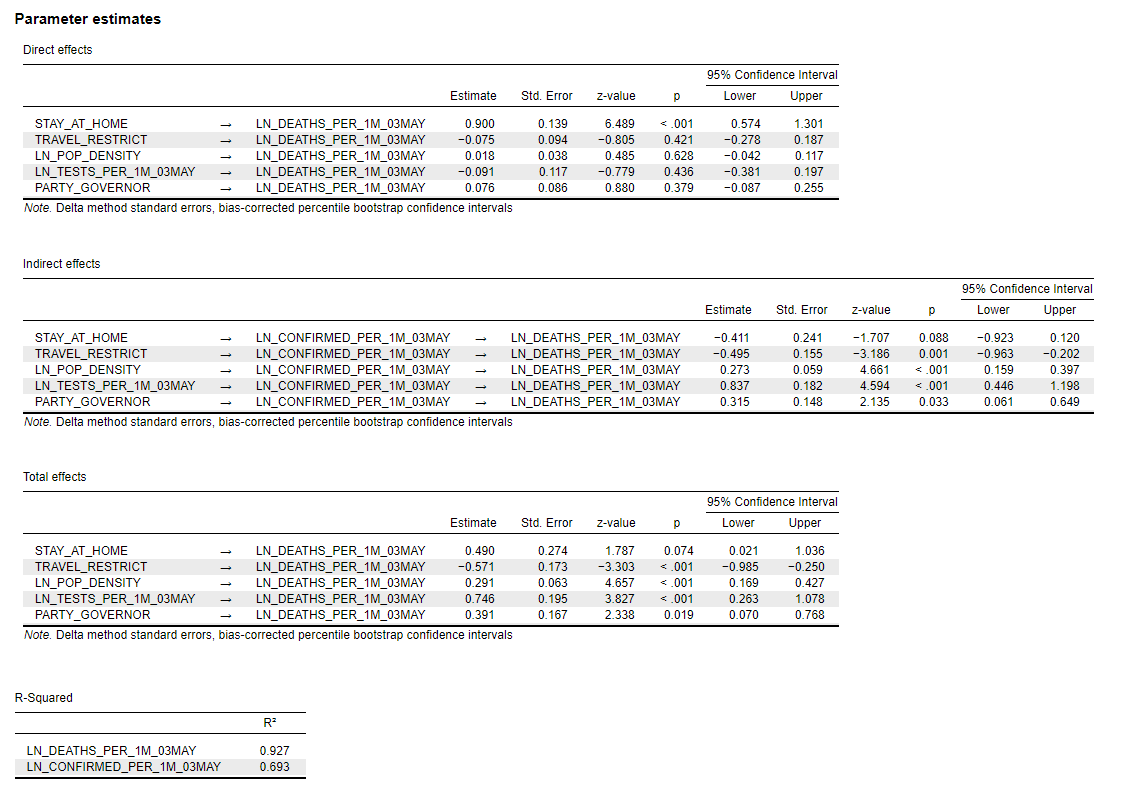
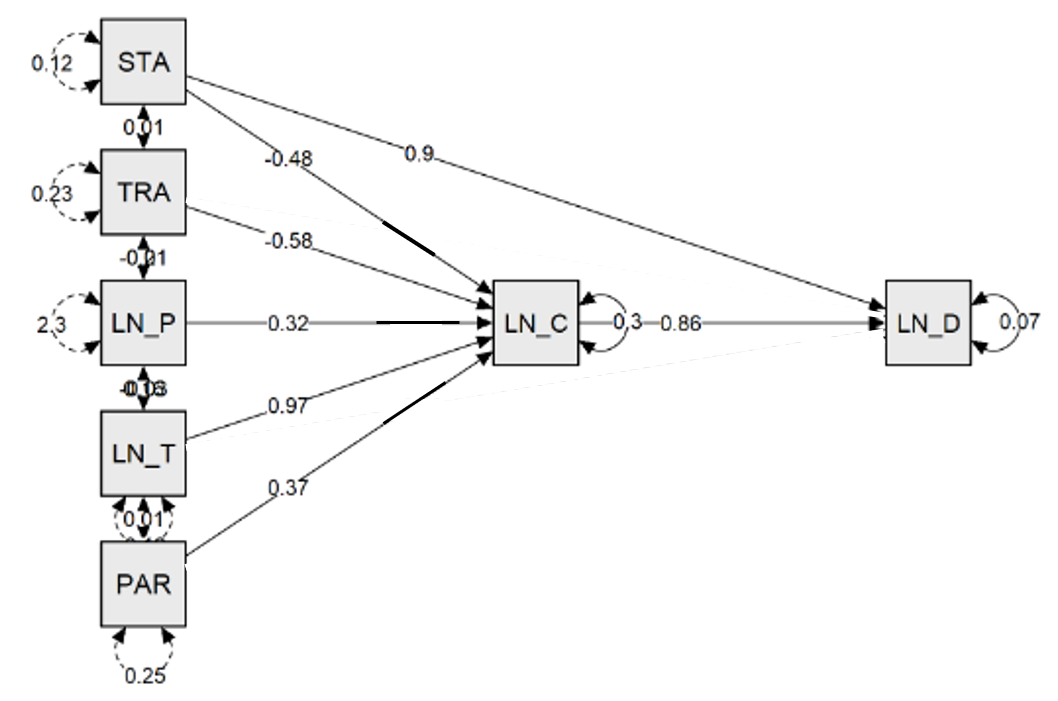
The linear path model in Figure 4 was estimated using JASP, a free statistical analysis package (with Bayesian estimation for most analytic options) made available by the University of Amsterdam. The model’s diagnostic output, including standard errors, is in the Appendix below.
Figure 4: Path model standardized parameter estimates and residual covariances (data through 3 May 2020)
Interpretation of Results
Lockdowns versus No Lockdowns
Let us plunge right into the variable of most interest: statewide lockdowns (variable: STA). Its direct relationship to the relative number of COVID-19 deaths is positive and significant (β = 0.90, p < .001), while its direct relationship to the relative number of confirmed cases is negative and significant at an α < .10 level (β = -0.48, p = 0.088).
Have statewide lockdowns led to more COVID-19 deaths? No, not likely. There are anecdotal cases where some victims were isolated in their homes and did not get the urgent care needed to save the lives. One of inquiry in this regard is an increased number of younger and middle-aged victims who died from strokes related to COVID-19, some dying in their homes before they could get needed care. In theory, a statewide lockdown could increase those types of fatalities, but not on the level implied by the model here. But, again, this is an aggregate analysis and we cannot make individual-level inferences.
Instead, my interpretation is that unmeasured factors related to both lockdowns and COVID-19 deaths are at play. Although it is possible that states with lockdowns are inflating their COVID-19 numbers and/or non-lockdown states are under-reporting, I think it is far more likely that some unmeasured variable (my guess is ‘time’) is leading to much higher relative fatality rates in lockdown states compared to non-lockdown states. As all of the non-lockdown states are in the interior of the country, they have been among the last to experience their first cases and deaths compared to the coastal lockdown states.
Still, we cannot rule out the possibility that some states are systematically over-reporting or under-reporting their COVID-19 numbers. I offer the previous discussion about New Jersey including “probable” COVID-19 cases in their nursing home fatality counts as a possible avenue for this type of systemic measurement bias (fraud?). I also have anecdotal evidence from talking to friends back in Midwest about some of their family, friends, and neighbors “toughing it out” and not getting tested despite showing COVID-19-type symptoms. That is a Northern European cultural trait with which I have personal experience.
The more interesting result in our path model is that lockdown states, all else equal, are experiencing lower confirmed case rates per 1 million people than non-lockdown states. While lockdown variable is only marginally significant, that could be for a number of issues unrelated to the actual importance of lockdown policies suppressing COVID-19 morbidity rates.
The confirmed COVID-19 cases model certainly has specification error, though the model residuals cases appear random and the model fit at 69 percent is not too bad (see Appendix).
Over time, the observed differences in relative COVID-19 cases have narrowed between lockdown versus non-lockdown states. When this pandemic is over, we may in fact see much higher relative numbers in the non-lockdown states than we see now. That may, in turn, lead to a stronger (negative) statistical relationship between the lockdown variable and COVID-19 case rates.
Other Factors
When looking at total effects (direct + indirect effects), a state’s population density (+ relationship), relative number of administered tests (+), the presence of travel restriction policies at some point during the pandemic (-), and the presence of a Democratic governor are stronger correlates with the relative number of COVID-19 fatalities (+) than is a state’s lockdown policy. As I’ve said, that could change over time as the pandemic progresses into later stages — the question is: How much?
Residual Analysis
One of the benefits of estimating a linear path model is that we can look at the residuals for each state to see which ones are doing better than expected on COVID-19 case and fatality rates and, of course, which ones are doing worse.
According to my analysis, these states highlighted in green in Figure 5 are experiencing a lower rate of COVID-19 cases (per 1 million people) than expected (the presumption is that whatever these states have done, it is working better than other states). The states highlighted in red are experiencing a higher rate of COVID-19 cases (per 1 million) than expected:
Figure 5: Actual versus Expected COVID-19 Confirmed Case Rates (as of 3 May 2020)

Note in Figure 5 that Arkansas is a non-lockdown state, while Florida implemented its lockdown relatively late in their outbreak (29 days after the first confirmed case). The average lockdown state implemented their policy 21 days after the first confirmed case.
Figure 6 shows a similar table for actual versus predicted COVID-19 fatalities per 1 million people.
Figure 6: Actual versus Expected COVID-19 Fatality Rates (as of 3 May 2020)
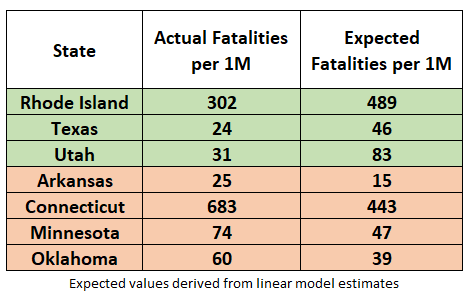
Non-lockdown state Arkansas now finds itself on the under-performing (red highlight) list with 25 actual COVID-19 fatalities per 1 million people versus an expected 15 fatalities per 1 million people. On the other hand, non-lockdown state Utah is on good side of the ledger with 31 expected COVID-19 fatalities per 1 million people versus an expected fatality rate of 83 per 1 million people.
Final Thoughts
As of now, the quantitative evidence is mixed in support of full, statewide lockdown policies as being effective in mitigating and suppressing the spread of the coronavirus. To the extent lockdowns matter in controlling the spread of the virus, the analysis presented here cannot distinguish what elements of a lockdown policy are most effective. It could be that merely enforcing safe personal behaviors and social distancing — such as face masks, preventing large group activities, and pressuring people to keep at safe personal distances — are having the most impact. ‘Staying-at-Home’ may be unnecessary.
More importantly, the actual mortality rate of COVID-19 (along with the number of new daily cases) is critical information needed to make a wise decision on statewide lockdowns. Some extremely vulnerable populations — the elderly and those with certain preexisting medical conditions — may need to continue to stay at home; but, for the vast majority of Americans, it may not be a wise policy to continue, particularly in light of the economic damage the lockdowns are having across the globe.
South Korea didn’t lockdown. Japan didn’t. Taiwan didn’t. Singapore didn’t. Hong Kong didn’t. Yet, they are all doing better than the U.S. in COVID-19 fatality rates and they didn’t shut down their economies in the process.
The news media and Democrats may continue to dismiss or censor this type of information and cherry-pick evidence that supports full lockdowns, but doing so stunts what should be an open and constructive debate. [Remember those?]
And, frankly, I have provided some tentative evidence to support statewide lockdowns, though I draw no absolute conclusions on the importance of continuing statewide lockdowns.
The empirical question has not been definitively answered on lockdowns and may not be known until this pandemic is over and epidemiologists and public policy researchers can apply more sophisticated modeling to the final numbers. We will eventually find out the true mortality rate for COVID-19 — not unlike what epidemiologists at The University of Puerto Rico at Mayagüez recently did when they concluded the U.S. news media-promoted claims that up to 4,000 Puerto Ricans died in 2017’s Hurricane Maria were substantially inflated. They determined between between 1,069 and 1,568 Puerto Ricans died directly and indirectly from Hurricane Maria. Some will rightfully claim that number is still too big to be acceptable, but it is substantively different from the misinformation promulgated by the U.S. national media not long after Hurricane Maria hit Puerto Rico’s shores.
Similarly, if we want to avoid learning the truth years from now, instead of now, any suggestion that the debate on lockdowns is settled must be treated as nonsense — and potentially harmful to the country.
- K.R.K.
As always, comments can be sent to: kroeger98@yahoo.com
To my readers that have sent constructive comments and not received a reply from me, I apologize. The volume has increased to the point where I am not able to answer all of them. But I do try.
APPENDIX: The Path Model Estimation Output
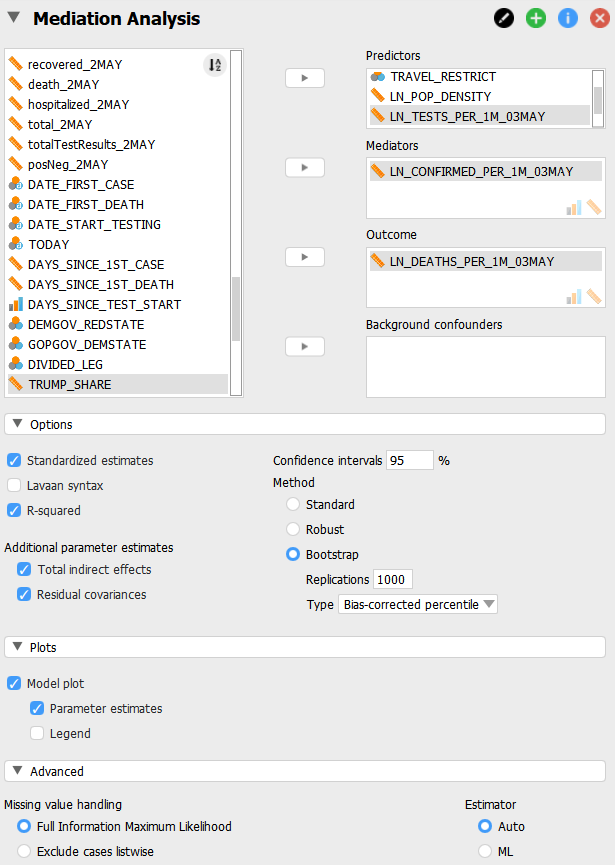
Model Set-up in JASP
Model Estimation Output
