By Kent R. Kroeger (Source: NuQum.com, January 31, 2018)
One trade trick economic forecasters employ in their analytic arsenal is updating their forecasts on a frequent basis.
That is why, without apologies, NuQum.com is revising its 2018 midterm election forecasts regarding the partisan control of the U.S. House and Senate:
The Forecasts
Under current conditions — presidential approval at 41% and our forecast of a 2 percent average quarter-to-quarter change in real disposable personal income (RDPI) in the first half of 2018 — we predict the following:
- U.S. House: Democrats gain 39 seats (+/- 27 seats).
- U.S. Senate: Democrats gain 4 seats (+/- 6 seats).
As of now, the Democrats are likely to regain control of both chambers. Of course, these predictions have large margins of error and are subject to modification as presidential approval and RDPI change.
As for the statistical models used to generate these predictions, the U.S. House forecast model employs four variables:
- Presidential approval (Gallup) — % approve
- Quarter-to-Quarter Change in Real Disposable Personal Income (RDPI)
- Seats held in U.S. House by President’s Party
- Net change in U.S. House seats for President’s Party in previous election (2 yrs. prior)
Our U.S. Senate forecast model employs three variables:
- Presidential approval (Gallup) — % approve
- Quarter-to-Quarter Change in Real Disposable Personal Income (RDPI)
- Indicator variable for a ‘lame duck’ president
Details on how we estimated our forecast model can be found at the bottom of this article. You can also access our online midterm prediction calculator here.
The Implications
The good news for the Republicans is that as presidential approval and the economy change, these forecasts can change. There is still time.
The bad news for the Republicans is that we lied about the good news. There really isn’t time to change presidential approval (or the economy) enough to save control of the House or Senate. Not for this president.
But the fundamental dilemma for the GOP is not low presidential approval, it is the nature of midterm elections themselves. Coming only two years after a presidential election, they almost inevitably result in the president’s party losing a significant number of seats. Since 1950, the president’s party has lost an average of 24 seats in the House and four seats in the Senate in midterm elections.
Dwight Eisenhower in 1954 saw his party lose 18 seats in the House even though he had a Gallup job approval rating of 62 percent heading into the election. More recently, Barack Obama had 45 percent job approval in October 2010, slightly more popular than Trump now, and watched his party lose 63 seats in the House and six in the Senate.
There are two recent midterm elections — 1998 and 2002 — where the president’s party did gain House and Senate seats. In the case of 2002, the nation was barely a year removed from the 9-11 attacks and poised for a land war in Iraq. That is an easy case to explain.
The 1998 midterms are more interesting, however, in that Bill Clinton had just been impeached by the House under the shadow of the Monica Lewinsky scandal. Yet, in October 1998, Clinton enjoyed 68 percent job approval — arguably, a function of a congressional Republicans over-reaching on the Lewinsky scandal and eliciting sympathy for the president among many voters. If that doesn’t give today’s Democrats pause about the 2018 midterms, I don’t know what will. The American voters will turn on a party they perceive as doing an injustice to a president — even one they don’t otherwise like or agree with.
That was then, this is now
Back to the present, yes, the tax cuts will help the Republicans in 2018 by increasing voters’ disposable incomes. Our prediction model quantifies the electoral impact of changes to RDPI: For every 1 percent increase in RDPI, the Republicans will save 3 House seats and 0.4 Senate seats.
Likewise, for every 1 percent increase in presidential job approval, the Republicans save 1 House seat and 0.2 Senate seats.
To be frank, it will not be easy for the Republicans to keep control in either chamber. But if they did, how might it happen?
The easy answer is starting a war or getting attacked by a foreign entity. For this discussion, we assume those events are off the table.
Instead, our model focuses on two components: presidential approval and the economy. While the latter factor is affected by public policy over the long-run, the former is more variable in the short-term and is under more direct influence from political actors.
Political scientists have identified the major influences on presidential approval as:
- Economic Events: Strikes, labor unrest, commodity price shocks, income growth, stock market movements
- Administration Scandals: Congressional hearings, indictments, special prosecutors
- Domestic Policy Accomplishments: Major tax legislation, civil rights protections.
- Domestic civil unrest: Riots, protests, marches, crime
- Foreign Policy Accomplishments: Peace treaties, trade agreements.
- US-initiated Foreign Conflicts: First Gulf War, Iraq War, air strikes.
- Enemy-initiated Foreign Conflicts: Soviet invasion of Afghanistan, Iran hostage seizure, 9-11 attacks.
- Escalation of Foreign Conflicts: Subsequent expansion of U.S. military involvement in an on-going foreign conflict (Syria, Afghanistan, Yemen).
Any one of these factors (or some combination) could change the dynamics of the 2018 midterms in a short period of time. In reality, however, large shifts in presidential approval on a scale the Republicans need by November 2018 are relatively infrequent and are, in many cases, short-lived.
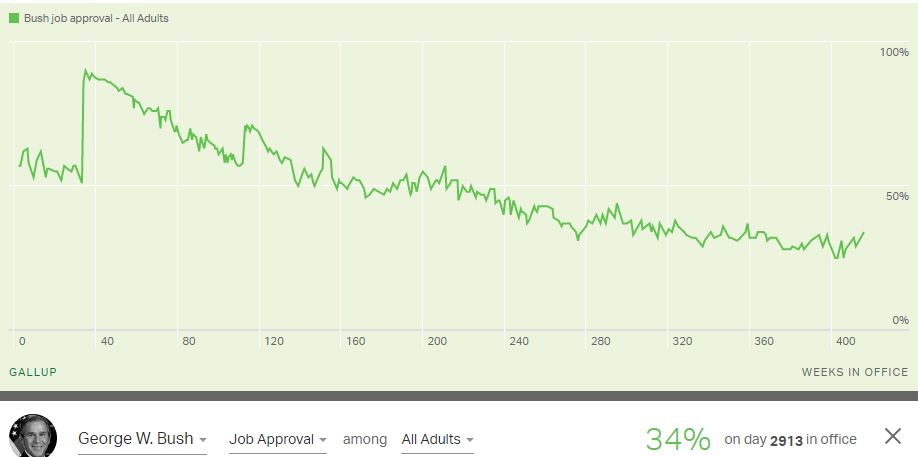
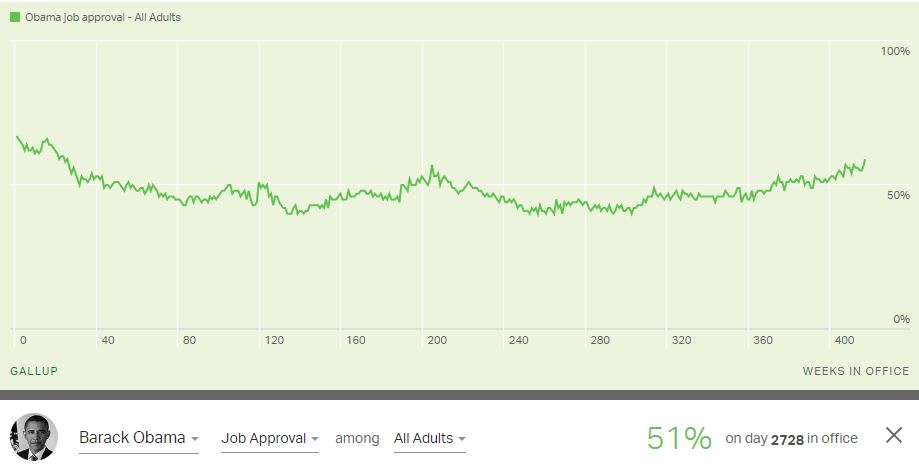
For the past two presidents, George W. Bush’s approval had three significant spikes upward (9-11, the start of the Iraq War until “Mission Accomplished,” and Saddam Hussein’s capture). Obama experienced more gradual but sustained periods in approval growth (Osama bin Laden’s death in 2011, 2012, 2015 and 2016).
As yet, Donald Trump has not demonstrated he can sustain approval growth for more than a month (see chart below). More problematic for the midterm elections, Trump’s Gallup approval numbers have never exceeded 46 percent.

To keep control of the House, our forecast model indicates President Trump needs a presidential approval rating near 49 percent, along with a quarter-to-quarter change in RDPI around 4 percent [the current economic expansion average is 2.1 percent]. Short of a hot war with North Korea, that increase in presidential approval between now and Election Day would be exceptional — though not unheard of.
More favorable for Trump is the economy. The Trump tax cut will increase RDPI, but to what extent? In the current 32-quarter economic expansion, 28 percent of quarter-to-quarter RDPI changes have exceeded 4 percent. With help of the Trump tax cut, averaging 4 percent RDPI growth in the first half of 2018 is within the realm of the possible, but far from certain.
As for keeping the Senate, presidential approval will need reach close to 50 percent with a quarter-to-quarter change in RDPI at a 5 percent rate. At Trump’s current 41 percent approval rating, RDPI quarter-to-quarter growth needs to be close to 9 percent for the GOP to keep the Senate.
The data looks very gloomy for the Republicans right now. An eight- to nine-point rise in presidential approval would require no more setbacks for the president between now and Election Day, and would benefit from at least one large-scale ‘rally-around-the-flag’ event.
Given the Robert Mueller investigation will wrapping up between now and November 2018, short of a complete exoneration of Trump and associates, it is doubtful the Mueller investigation will result in a net positive for Trump’s approval levels. But, again, not impossible. Recall Kenneth Starr’s investigation of Bill Clinton and how the American people actually rallied around their president when the House voted to impeach and the Senate failed to convict.
Foreign events are a more likely source for positive movements in presidential approval and Trump, in his short time in office, has already stoked a few fires worldwide that may yield positive results (Israel/Palestine? A new Iranian revolution? A further decline of radical Islamic forces?). Or it could all go horribly wrong…
Short of events of that magnitude, it is not likely President Trump can increase his approval or juice up the economy enough to save either chamber for the Republicans by Election Day.
K.R.K.
{Send comments to: kkroeger@nuqum.com}
About the author: Kent Kroeger is a writer and statistical consultant with over 30 -years experience measuring and analyzing public opinion for public and private sector clients. He also spent ten years working for the U.S. Department of Defense’s Office of the Under Secretary of Defense for Personnel and Readiness and the Defense Intelligence Agency. He holds a B.S. degree in Journalism/Political Science from The University of Iowa, and an M.A. in Quantitative Methods from Columbia University (New York, NY). He lives in Ewing, New Jersey with his wife and son.
For those readers that want the forecast model details
Our prediction from last fall was that the Republicans would lose 25 House seats and narrowly lose control of the chamber to the Democrats. [We did not make a Senate prediction.]
Since then we have revised our U.S. House forecast model by explicitly modeling the tendency of large House majorities to be trimmed back by voters and for large partisan shifts in previous elections to be countered with shifts in the opposite direction in subsequent elections.
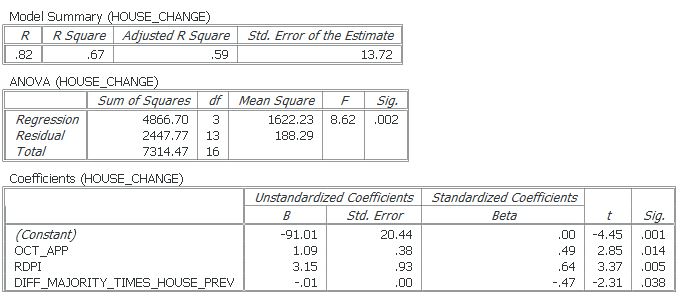
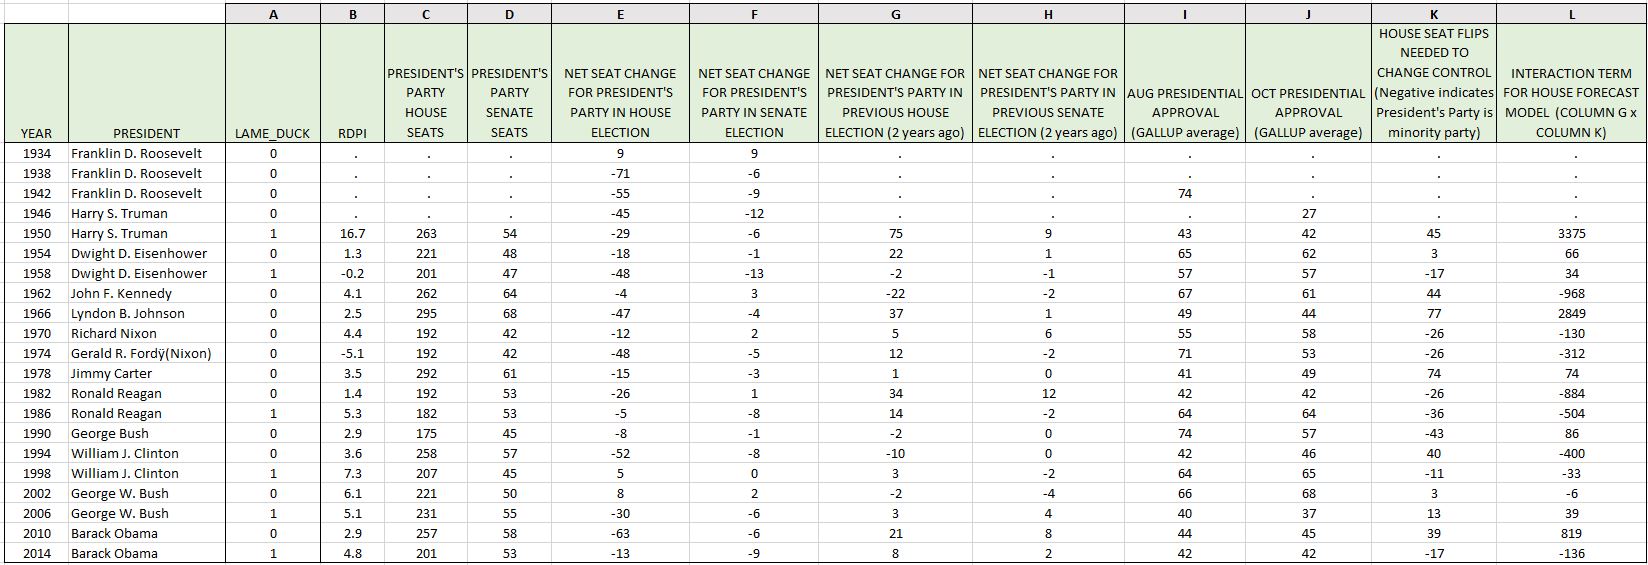
Our U.S. House linear model has only three variables: (1) Average presidential approval in October of the midterm election year, (2) the average quarter-to-quarter percentage change in real disposable personal income (seasonally adjusted) in the first two quarters of the election year, and (3) an interaction term for the relative size of the president’s party in the House and the number of House seats gained or lost for the president’s party in the previous House election.
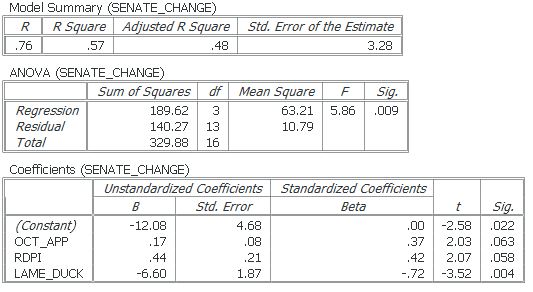
Our U.S. Senate linear model also has three variables: (1) Average presidential approval in October of the midterm election year, (2) whether or not the president is a lame duck (i.e., not running for re-election), and (3) the average percentage change in real disposable personal income (seasonally adjusted) in the first two quarters of the election year.
We modeled seat changes for the president’s party since 1950 in the U.S. House and Senate (n = 17).
The model estimation equations and fit statistics are as follows:
U.S. HOUSE FORECAST MODEL OUTPUT:
U.S. SENATE FORECAST MODEL OUTPUT:
Other model diagnostics available upon request to: kkroeger@nuqum.com
For those interested in our data, here is the dataset:
