
By Kent R. Kroeger (Source: NuQum.com, August 28, 2017)
{ Feel free to send any comments about this essay to: kkroeger@nuqum.com or kentkroeger3@gmail.com}
An economist, when asked why he makes economic forecasts even though his predictions are often inaccurate, replied, “I make forecasts, not because I can, but because they ask me to.”
Forecasters with real-world experience over a long period of time usually show the psychological scars. Like great athletes, they tend to remember the failures and missed opportunities more than the victories.
Even the best get clocked on the jaw every now and then. Any pretense that Nate Silver owns the secret formula for election predictions evaporated on November 8, 2016.
The election forecasting community understandably is still feeling the pain from the 2016 presidential election debacle; though, to be fair, many of their predictions, particularly those forecasters using econometric and aggregate polling data, came close to predicting Hillary Clinton’s 2.1 percentage-point advantage in the two-party popular vote.
Truth be told, it wasn’t the statistics that failed, it was the analysts. But there were some forecasters that were on target and worth noting.
Political scientists Michael Lewis-Beck and Charles Tien, using in their model only GNP growth in the first two quarters of the election year and presidential job approval in July of the election year, missed the final popular vote outcome by just 0.1 percent. Furthermore, out-of-sampling testing of their model shows it is accurate 83 percent of the time, missing only the 1960, 1968 and 1976 elections.
Jim Campbell’s “Convention Bump” model also proved accurate, missing the 2016 popular vote by just 0.3 percentage-points.
As for two of the popularly reported aggregate-poll forecasts, RealClearPolitics.com and fivethirtyeight,com’s popular vote forecasts were not that bad (1.1 and 1.7 percentage-point errors, respectively).
Nonetheless, close only counts in horseshoes and hand grenades.
PICK YOURSELF UP, DUST YOURSELF OFF
Like a scene from The Walking Dead, forecasters once again are slumping out of the forest to predict the 2018 midterm elections, with specific emphasis on the U.S. House races where the Democrats have a decent chance of regaining control.
With just a 24-seat gain required for the Democrats to re-take control of the House (which is well within historical averages), the GOP should be very concerned about 2018.
But how concerned?
Before looking at some of the more elaborate model predictions, these simple statistics should be enough to keep House Republicans glued to their donor list:
- In the past 20 U.S. House midterm elections, the president’s party has lost seats in 18 of those elections by an average of 33 seats in each of those 18 elections.
- Since Gallup began collecting presidential job approval data in 1946, a job approval rating above 50 percent translates into an average loss of 14 seats for the president’s party; however, when the POTUS is underwater (below 50 percent), they lose 36 seats.
Categorizing each House race as either “safe,” “leaning,” or “toss-up,” while fun and even enlightening, isn’t required to make a simple back-of-the-envelope prediction: The Republicans are going to lose seats in 2018, perhaps enough to give House control back to the Democrats.
Here are just two of the latest predictions for the 2018 U. S. House midterm elections:
- Roll Call’s Nathan Gonzales says 39 Republican seats are in play compared to only 14 Democratic seats — that’a 25-seat advantage.
- The Huffington Post is predicting a 30-seat turnaround in favor of the Democrats
While not a specific prediction, Charlie Cook (of the Cook Political Report) says, “Analysts who have watched congressional elections for a long time are seeing signs that 2018 could be a wave election that flips control of the House to Democrats.”
Nate Silver similarly predicted in mid-April that the 2018 House elections looked “cloudy, with a chance of a landslide (in favor of the Democrats).”
Lifezette’s Kathryn Blackhurst couldn’t help but note the irony — the same people who predicted Clinton’s historic victory last year were already spreading bad vibes about the GOP’s 2018 election prospects.
The Republicans can’t be blamed if they are a bit blase and not taking these newest predictions seriously. They can also take solace in the knowledge that many forecasters still think the Democrats are a statistical long-shot for taking back the House.
Here are a few of the more GOP-friendly forecasts:
- Fairvote.org predicts a 14-member loss for the Republicans (assuming a 50-50 partisanship split in the voting population).
- The prediction market, PredictIt, currently shows the Republicans as having a 54 percent chance of keeping control of the U.S. House.
- Using a Bayesian methodology, G. Elliot Morris predicts the Democrats will have a 7.2 percentage-point edge in U.S. House votes but will only net 9 additional seats.
One key attribute of these forecasts, whether they predict a Democratic landslide or the GOP keeping House control, is that they are as perdurable as sand castles. All of the major variables in these models are going to change between now and Election Day 2018.
Ergo, nobody should be making bets on where Trump’s job approval will be in November of next year. Trump still hasn’t reached Nixon, Carter or George W. Bush job approval lows (24, 28 and 25 percent, respectively) but we know he’s capable of sinking lower; and, while there are reasons to conclude his upside isn’t likely to break 50 percent job approval in the next year (though a bump from a new war or major terrorist attack is always a possibility), the Democrats have yet to prove they can capitalize on the softness of Trump’s support base.
Furthermore, the structural disadvantages against the Democrats regaining control are substantial.
“Gerrymandering, campaign spending and incumbency advantage play a role,” says FairVote‘s Theodore Landsman in explaining why FairVote‘s prediction model shows the GOP keeping control of the U.S., even if the Democrats should win the majority of votes nationally. “But the biggest cause is well understood: Republicans are distributed in a more geographically advantageous way than Democrats for single-winner geographic districts.”
Tom Perez and the Democratic National Committee aren’t asking for our advice, but here is some anyway: Either move a few million loyal Democrats from the coasts into America’s heartland, or, find a way to appeal to more of the voters already living there. Sorry, Democrats, but your problem in U.S. House races isn’t a turnout problem — its a problem of having a narrow geographic appeal. Your dominance in California and New York is doing nothing for you in Michigan, Ohio, Missouri, and Wisconsin.
NUQUM.COM PREDICTS THE GOP WILL LOSE 27 HOUSE SEATS IN 2018
Here at NuQum.com, we don’t just criticize, we also submit our own predictions for target practice. Unlike most other prediction models, our model directly predicts the net gain/loss for the incumbent party for midterm elections since 1950 (the first midterm election with consistent polling data on presidential job approval). That gives us just 17 cases to analyze — not a lot, but enough for the biggest drivers (independent variables) to emerge significant. In the age of big data, we are one of the few analytic shops that refuses to apologize for small sample studies.
The data for our midterm election model comes from the University of California at Santa Barbara’s American Presidency Project (see table below) and The Federal Reserve of St. Louis’ FRED database.

Our model variables were:
- Dependent variable: House seats net gain/loss for president’s party
- Independent variables:
- Gallup’s presidential job approval average from August to October in the election year,
- real disposable personal income growth (average for 1st two quarters of the election year, seasonally-adjusted),
- an indicator variable for post-Watergate Republican administrations, and
- the incumbent party’s net gain/loss from the previous midterm election.
The last two independent variables are notable in that they are proxies for two phenomena we believe play crucial roles in U.S. House aggregate election outcomes, particularly during midterm elections when a presidential race doesn’t play a role.
The prior midterm election net gain or loss captures the ‘Yo-Yo’ dynamic at play between midterm elections, independent of the effects of a presidential campaign (which is why we don’t use the prior net gain or loss from the previous presidential election). The ‘Yo-Yo’ dynamic describes the tendency of voters (and we believe also the media), particularly in the age of stagnant wages and incomes, to punish any political party that does well in recent prior elections.
The indicator for post-Watergate Republican administrations measures what we believe to be one of the effects of the Republican Party’s strong, post-Watergate brand equity. While presidential elections are susceptible to the idiosyncratic features of the two major party candidates, U.S. House races are much more dependent on party “branding.” In a country where only 37 percent of adults can name their U.S. House representative, the value of a party’s brand cannot be over-estimated.
WHAT ELSE DOES OUR MIDTERM MODEL TELL US?
Using the parameter estimates from our linear regression model, the following GOP gain/loss forecasts were derived for a reasonable range of presidential job approval values (34 to 49 percent) and five levels of real disposable personal income growth (1st two quarters of the election year, seasonally-adjusted) — see chart below. We used the most recent Federal Reserve estimates for real disposable personal income growth (3.2 percent) to compute the gain/less forecast for 2018.
Our resulting prediction of a net loss of 27 GOP House seats under current conditions has a margin of error of ±20.3 seats (95% confidence level). That is a large confidence band (one of the downsides of small samples), but it does tell us something important. As of now, the GOP is probably not looking at a 2010 election-scale meltdown (where the Democrats lost 63 seats). However, at current job approval and economic levels, the GOP is going to lose some House seats. The question is, “How many?”
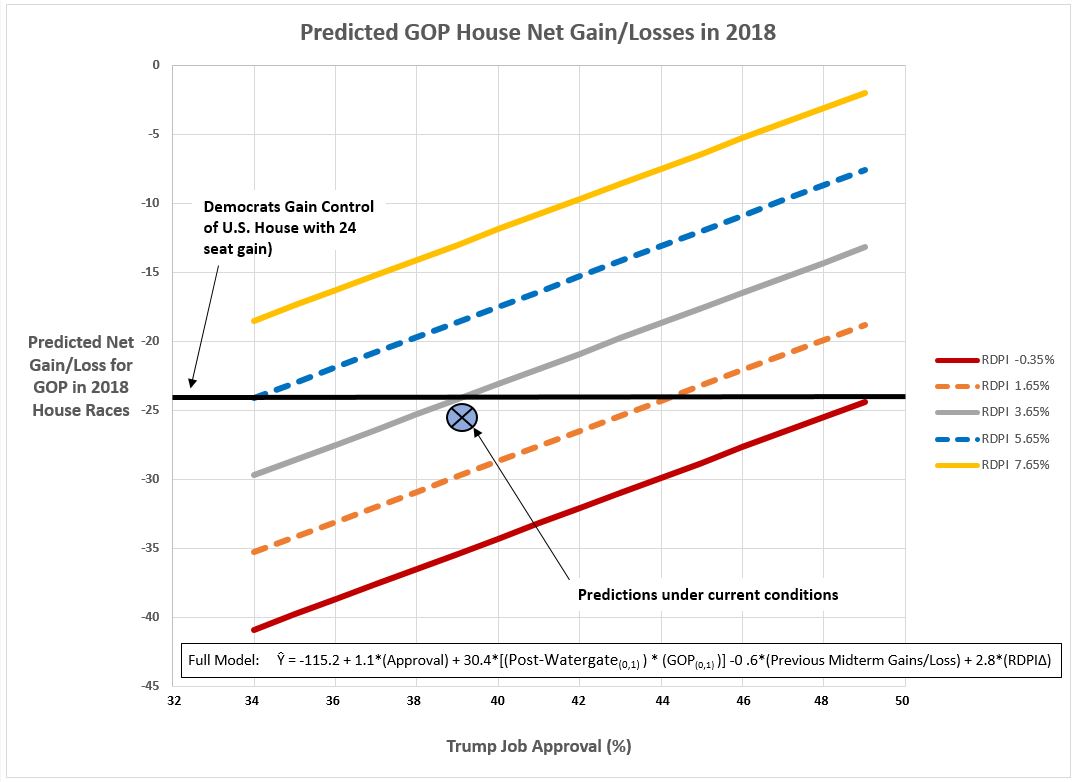
The good news for the GOP is that they can keep their loss small enough to avoid a Democratic takeover of the House if Trump can rediscover job approval numbers north of 41 percent (assuming the economy stays relatively strong as well).
That’s a narrow path for Trump and the GOP to keep control of the House, but given what happened last November, its hard to bet against them.
About the author: Kent Kroeger is a writer and statistical consultant with over 30 -years experience measuring and analyzing public opinion for public and private sector clients. He also spent ten years working for the U.S. Department of Defense’s Office of the Under Secretary of Defense for Personnel and Readiness and the Defense Intelligence Agency. He holds a B.S. degree in Journalism/Political Science from The University of Iowa, and an M.A. in Quantitative Methods from Columbia University (New York, NY). He lives in Ewing, New Jersey with his wife and son.