By Kent R. Kroeger (Source: NuQum.com, December 20, 2016)
CLINTON IS MORE POPULAR THAN TRUMP! SHE WON THE POPULAR VOTE!
“He (Donald Trump) lost the popular vote to (Hillary) Clinton by more than 2 million votes,” recently wrote New York Times columnist Gail Collins, who goes on to scold Trump supporters “who don’t want to hear that more people actually voted for Hillary.”
This decontextualized fact is used by many to discredit Trump’s electoral college victory and inspired attempts to force vote recounts in Wisconsin, Michigan and Pennsylvania, and to persuade Republican electors to become “faithless” and vote against the preference of their state’s voters. All were wastes of political energy .
Unfortunately, the promulgation of the “Hillary won more votes” narrative ignores the real story of the presidential vote in 2016. More importantly, it prevents many Democrats and Never Trumpers from moving forward and rebuilding their political capital.
Our analysis of the 2016 presidential vote finds that, had the Trump and Clinton campaigns been as active in the non-swing states as they were in the swing states, Trump would have squeaked out a narrow popular vote victory of 48 percent to 47 percent.
When I first shared this finding with my wife, her reaction was swift: “Are you kidding me?! Isn’t winning the election enough for you? You have to take away Hillary’s popular vote victory too!”
No, I am not denying the raw popular vote total. The almost 3 million vote gap in Clinton’s favor is real. Fifty-years from now, when talking about the 2016 presidential election, pundits across the ideological spectrum will cite Clinton’s popular vote advantage. But while the vote difference is real, it is not as meaningful as we are told to believe it is.
Why? Others have made this next point better, but I will summarize: Both candidates understood going into the election that it is an electoral college election, not a popular vote election. The type of election (popular vote versus electoral college) informs campaign strategy. In an electoral college election, swing states (i.e., states where the popular vote is competitive) become the battleground states. In contrast, in a popular vote election, the optimal campaign strategy is to concentrate campaign activities in densely-populated areas. Trump’s campaign manager, Kellyanne Conway, put it simply to MSNBC’s Chuck Todd: “Had this been a race for the popular vote, we would have won that too, because Mr. Trump would have campaigned in California, in New York, stayed in Florida, gone to Illinois, perhaps.”
After hearing Conway’s statement on MSNBC, my curiosity demanded a more formal test of her assertion. In this effort, I used a simple statistical model to adjust the actual popular vote for the net campaign effects witnessed in the vote results from these swing states: Arizona, Colorado, Florida, Georgia, Iowa, Michigan, Minnesota, Missouri, New Hampshire, Nevada, North Carolina, Ohio, Pennsylvania, Virginia, and Wisconsin.
IN A NOT-SO ALTERNATIVE UNIVERSE, CLINTON LOSES THE POPULAR VOTE IN 2016
My popular vote adjustment is a two-step algorithm: (1) Calculate the net campaign effect in the swing states, and (2) apply this campaign effect to the non-swing states so the adjusted national popular vote accounts for the campaign dynamics observed in the swing states.
Here, I will keep the explanation short, but feel free to access the full analysis at this link: Adjusted 2016 Popular Vote. Also, given the on-going counting of ballots, particularly in California, some of the numbers used for this analysis have changed. (Can you imagine if this country used the popular vote method for selecting the president and the outcome was so close we had to wait over month after Election Day for California to certify its results? It would be the political equivalent of an all-out thermonuclear war that would never be resolved in a way satisfactory to the losing candidate. Perhaps a reason we should stick with the electoral college?)
From David Wasserman’s Cook Political Report analysis, we know that Clinton won the presumptive popular vote by almost 3 million votes. However, she lost the 15 swing states by almost 1.5 million votes, even while winning the non-swing states by over 4 million votes.
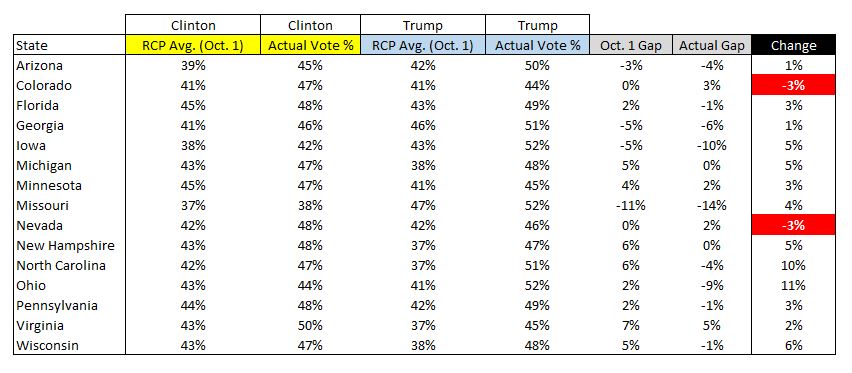
Diving deeper into the swing state results and the early polling, we see the effect of the Trump campaign’s tactics and strategy. Using the state-level RealClearPolitics polling averages as of October 1st, Trump probably trailed Clinton by almost 1 million votes. This means the Trump campaign generated a net turnaround of 2.2 million votes in the swing states between Oct. 1st and Nov 8th. The chart below shows the Oct 1st polling averages and final vote percentages for the swing states. In only two states (Colorado and Nevada) did Clinton see a positive campaign effect. In all other swing states, Trump improved his vote percentages relative to Clinton’s between Oct. 1st and Election Day.
(Note: Some readers have criticized this analysis’ assumption that Trump’s swing state ‘campaign effect’ can be transferred to the non-swing states. I agree that this is a strong assumption and it is interesting to note that Clinton had a positive campaign effect in the two of the three western swing states (Colorado and Nevada) and may reflect the strength of her message among Hispanics.)
Forget the 80,000 vote margin in the three rust belt states (Wisconsin, Michigan, Pennsylvania) often discussed in the media. That is a meaningless post hoc analytic. The important number is the extent to which Trump campaign’s tactics (local media buys, candidate appearances, and surrogate events) changed the final outcome. That number is the “net campaign effect” as measured by the net vote change divided by the size of the vote eligible population (VEP) in the swing states. The number is 2.6 percent (in Trump’s advantage). Not a big number, but a profoundly important number.
The next step requires a big assumption and asks this question: What if the candidates’ swing state campaigns were conducted in the non-swing states as well? In my popular vote adjustment, I assume that Trump would have had a similar campaign effect on the popular vote outcomes in those states.
“The non-swing states are too different to make that assumption,” my wife averred, thereby dismissing out-of-hand my finding that Trump would have won the popular vote if he had competed in all 50 states.
But isn’t it more ludicrous to think Clinton’s vote advantage in California (over 4 million votes at last count) wouldn’t have changed if both Clinton and Trump had campaigned in a substantive manner there? He doesn’t have to win California in a popular vote election, he simply needs to do better – and he would if the contest required him to do so.
By applying the 2.6 percent campaign effect in Trump’s favor to the results in the non-swing states, I estimate Clinton would have won the non-swing state popular vote by 600,000 votes — not enough to overcome her 1.4 million vote disadvantage in the swing states. The adjusted 2016 popular vote is therefore: 64.8 million for Donald Trump to 64.0 million for Hillary Clinton.
DID THE COMEY LETTER CAUSE CLINTON’S LOSS? NO, IT DIDN’T.
If my analysis says anything, it says the Trump campaign was superior to Clinton’s — not a controversial finding. But if you want to know the extent the Russians or the Comey letter contributed to Trump’s advantage, I can’t help you here. My hunch is, not much. Based on my interviews with Iowa voters (not representative of all U.S. voters, to be sure), Clinton’s “deplorable” remark was memorable to voters. The “deplorable” comment was an in-your-face, playground insult that didn’t require translation by cable news pundits.
The John Podesta emails, on the other hand, reinforced a “crooked Hillary” narrative that had become entrenched among swing voters long before his personal emails were released by WikiLeaks. To claim the DNC and Podesta emails or Comey’s letter caused Clinton’s demise is analytically problematic. In a regression modeling context, statisticians call it a ‘multicollinearity problem’ which can make it difficult to quantify the causal effects of discrete events in the presence of simultaneously occurring events.
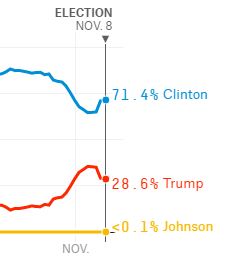
Yet, 538.com founder Nate Silver confidently asserts that the Comey letter was a difference maker. However, I am not as confident in that conclusion. First, the announcement of the Obamacare premium increases occurred on Oct. 24th — just four days prior to the Comey letter. At that time, 538.com’s model said Clinton had a 86.3 percent chance of victory. The day of the Comey letter’s release (Oct. 28th), her chance of victory had already fallen to 81.5 percent. A nearly 5 percent probability decline in just four days that CANNOT be attributed to the Comey letter.
If you were to extend the trend in Clinton’s probability decline from Oct. 24th to Nov. 8th, the final Clinton probability would be 71 percent…which is where it stood on Election Day, according to 538.com (see graphic below). Yes, Clinton’s decline accelerated after the Comey letter, but it also recovered (a little) after Comey said the FBI found no new evidence to change their conclusion regarding Clinton’s emails. The end result? Clinton stood at a 71 percent probability on Nov. 8th. You don’t need to reference the Comey letter to explain the Clinton’s probability of victory on Nov. 8th. Her decline began days before the Comey letter.
LIES! ALL LIES! THE ELECTORAL COLLEGE STOPPED HILLARY!
If our adjusted popular vote is right, you can’t blame the electoral college on Clinton’s loss. Instead, it was the product of difficult electoral context (a slow-growth economy, Obama/Clinton fatigue, ISIS threat, etc.) and an opponent that captured the national mood far better than Clinton’s ‘career of fighting for children and women’ message.
I attended rallies here in Des Moines for both Clinton and Trump. The difference in energy could not have been more dramatic. The Clinton crowd was large but lacked excitement. With the exception of actor Sean Astin (Rudy), the warm-up speakers were dull and uninspiring. By the time Hillary made it to the stage, people were slowly moving to the back of the crowd so they could get to their cars quickly once Hillary was done. it was a weird crowd dynamic. The more Hillary talked, the more the crowd dissipated. If she had talked 15 more minutes, she would have been addressing the clean-up brigade.
The Trump rally had a different vibe. The crowd grew slowly but consistently. Trump was late, of course, but it didn’t seem to matter. Crowd chants passed the time mixed in with a few speakers that kept their unmemorable comments short. But once Trump arrived — BOOM! People didn’t want to leave. He didn’t even say much. His speech was a loosely connected series of extemporaneous riffs. It was short (or, at least, seemed short) and included all the classic hits: “Build the Wall” “End Obamacare” “Crooked Hillary” yadda yadda yadda. Like the old O’Jays song said, “Give the people what they want.”
When I emailed my popular vote analysis to a friend living in southern California, she nailed its insight immediately.
“I didn’t see the same campaign you saw in Iowa,” her email reply started. “I didn’t see many Clinton or Trump TV ads; there were no rallies; and my newspaper (LA Times) was openly pro-Hillary. I thought Hillary would win in a blowout.”
She did…in California. For those of us living in swing states, a blowout never seemed possible.
No, Clinton didn’t lose because of the voting process. When you the mine the deep-vein data, the story is clear. Trump out campaigned Clinton. That’s a winning formula whether you are in a popular vote election or an electoral college election.
WHO SHOULD BE MORE TICKED OFF? AL GORE or HILLARY CLINTON?
“I still think Hillary would have won a popular vote,” my friend wrote in the email postscript. “And Gore was robbed too!”
And, on that assertion, I agreed.
If our country changed to the popular vote method (or some near variation), it would not change the election outcomes much. Except in one case. Unlike Clinton, Al Gore was truly stiffed. Al Gore won that election against George W. Bush in both the electoral college and popular vote — that is, had the true preferences of Florida voters been reflected in Florida’s popular vote. Unfortunately, for Al Gore, a bizarre “butterfly” ballot design in Palm Beach County altered the election. Gore’s victory was hijacked. And it didn’t help that the Gore campaign made a bad decision on how and where to contest the Florida vote. They should have pushed for a statewide recount. They didn’t.
That’s all water under the bridge, however.
EVEN IF IT DOESN’T ALTER THE RESULTS, DOESN’T THE POPULAR VOTE MAKE MORE SENSE?
Calls for changing to a popular vote are understandable. In the final analysis, however, I don’t think it really matters. In fact, there may be some unintended consequences. For example, the popular vote may increase the importance of money in our presidential elections. All else equal, a popular vote election would certainly increase the need to buy TV and radio ads in the major population centers.
The 2016 presidential election provides vivid evidence that an under-funded candidate can beat a well-funded candidate. Money is important in elections, of course; but so is the quality of the candidate and the election’s zeitgeist. Though Trump raised less money than Clinton ($650 million versus $1.2 Billion, respectively), he lessened that disadvantage by being a better campaigner who promoted an anti-establishment message when the national mood favored such an outsider.
My analysis here makes some strong assumptions. However, I am confident – had the 2016 presidential election been a popular vote election – Donald Trump would not have lost by nearly 3 million votes. Instead, it would have been a close race…a very close race…and Donald Trump would win the popular vote by about 1 million votes.
So, to all CNN and MSNBC on-air talent, enough with the “She Won the Popular Vote” preambles and epilogues. Without running the 2016 election as a popular vote contest, it is pure conjecture to say she won the popular vote. My analysis says Clinton would have lost that too.


You need to adjust your non-Swing state vote estimates for the likely increase in voter turnout. I would think you could assume it would be close to the turnout in swing states
I did a re-analysis that did exactly that. I adjusted the voter turnout to 64% in the non-swing states under the assumption that their turnout would go up in a popular vote election (at or near the same levels as the current swing states).
That adjustment cut Trump’s popular advantage significantly — but it didn’t go away (47.3% to 47.1%).
i’ll put the new analytic spreadsheet up on the website.
But I will re-iterate the basic finding: If we had run a popular vote election, the result would have been very very close — regardless of who would have won, it would have been by no more than a percentage point.
Good blog you have got here.. It’s difficult to find good quality writing like yours these days.
I honestly appreciate individuals like you! Take care!!