By Kent R. Kroeger (Source: NuQum.com, March 4, 2017)
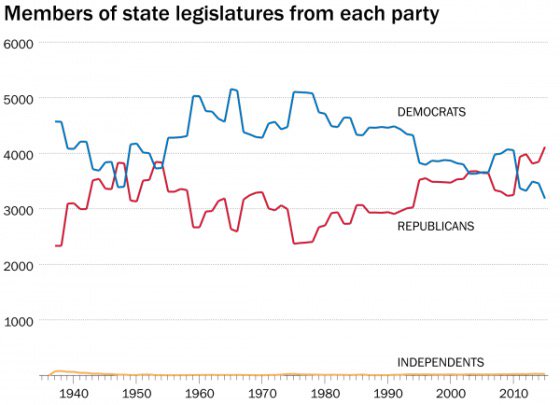
Readers of this blog know that I’ve long argued that, ideologically, the United States is a center-right country. My argument is always capped by the chart that shows the 40-year, 2,000-seat decline of the Democratic Party in the nation’s state legislatures. Here it is again:
I can respect any hypothesis for why the Democrats have seen this decline, as long as it can cover the last 40 years. Blaming Obama’s neglect of the state parties does not provide enough information to explain the decline. Neither does voter suppression or gerrymandering — though all of these factors can offer some explanation. A more systemic set of factors are required. In my view, its a combination of public mood, party branding and strategic positioning efforts, and demographic changes.
On the first factor I like to reference Dr. James Stimson’s Public Mood time-series summary of U.S. public opinion since 1950 (Graph Source: Dr. Larry Bartels):
In combination, these data argue unequivocally that this country is increasingly conservative when compared to the early 1990s.
Well, in retrospect, its not that simple. I was reminded of this as I plundered through some of my old analytic files on my laptop. As I was doing a ‘right-click, delete’ dance through my files I came upon a graph that I had created back in 2013 from data taken from the 2012 American National Election Study (Time-Series Panel).
I was asked by a former colleague with developing an attitudinal segmentation of U.S. eligible voters. The task was to model and graphically display the most analytically distinct segments of the vote eligible population and to map the positions of the Democratic and Republican parties relative to these voter segments.
The analysis of 5,893 U.S. adults from the 2012 ANES was straightforward. We applied a basic K-means clustering algorithm to develop the segments. While we investigated 12- and 16-cluster solutions, we ended up focusing on the simplest solution: 3 clusters (Left, Middle, Right). As you might imagine, the “Left” cluster tended to consistently agree with Democratic policy positions, the “Right” cluster agreed most often with the Republican policy positions and the “Middle” tended to be…well, in the middle on most policies. So below is the chart.
Along the vertical-axis are the issue questions from the ANES survey and the horizontal-axis shows the agreement scale where negative values indicate disagreement with the policy statement and positive values indicate agreement. The key takeaway from this chart is that most eligible voters are in the Middle segment (113 million Americans), shown by the green triangles. The Left (red circles) and the Right (blue squares) both represent about 62 million people. Therefore, on any given issue, if you are a Democrat, you want the Middle segment (green triangle) to be closer to the Left (red circle) than the Right (blue square). In those cases, its the Democrats that have the consensus position. Of the 24 issue statements below, the Left-Middle consensus occurs 12 times. Not bad. The Right-Middle consensus occurs just eight times. The four other issue statements were too close to call. It should also be noted that the 24 issues are sorted on the vertical-axis by the gap between the cluster extremes. Hence, issues where the cluster attitudes are similar are at the top of the graph, while as you go down the vertical-axis the gap becomes greater. In other words, when it comes to attitudes about the military and middle class people, there is little social differentiation. On issues like the environment or government-controlled health care, the Left and Right clusters stake out more extreme positions.
The overall result from the above graph seems to argue that we live in a center-left nation. That is, in fact, what I concluded when I presented this data analysis four years ago. The Left (Democrats) holds strategic advantages over the Right (Republicans) on a broad menu of key social issues: the environment, government support for child care, equal opportunity, and social welfare spending (particularly Social Security).
But, upon closer inspection, it is interesting to look at the eight issues on which the center-right coalition hold the consensus. They are: (1) Attitudes towards gays & lesbians, (2) Attitudes towards illegal aliens, (3) Attitudes towards Christian fundamentalists, (4) Level of desire for fewer restrictions on abortions, (5) Support for more defense spending, (6) Attitudes towards the private sector, (7) Desire to decrease the number of immigrants to the U.S., and (8) Attitudes towards the military.
Of those eight issues, five are directly related to issues the public felt were most important in the 2012 election according the Pew Research Center in 2012: national security, jobs, economic growth, health care and immigration. In other words, while the Left (Democrats) dominated the consensus on issues of civil rights, the environment, and the basic social safety net issues (social security and social welfare programs), the Right (Republicans) dominated on the issues that matter most to election outcomes. Interestingly, on government-controlled health care, the Middle (at least in 2012) was positioned equidistant from the Left and Right positions.
Of course, we’re talking about 2012 here. While Barack Obama won re-election, down ballot the Republicans held most of the gains they made in the state legislatures in the 2010 midterm elections. Obama was popular, but his charm didn’t transfer well to other Democrats.
But, has the public mood changed since then? The good news is that the 2016 ANES data will be released in April, 2017. I’ve already set up the R-code to re-run the same segmentation I created in 2012. I am curious to see what differences we find. My intuition says, not that much has changed. We are still a center-right country on the issues that matter most to voters, but there remain many strategic opportunities where the Democrats can regain an electoral advantage over the Republicans.
If the Democrats could ever discover a way to talk about the environment in a way that influenced vote preferences, it would be a game-changer. But I will save that for another column at a later date.


