
By Kent R. Kroeger (Source: NuQum.com, January 7, 2022)
The headline photo is not meant to imply the COVID-19 pandemic has been an amusement ride. Quite the opposite. But it has gotten to the point where some of my family, friends and colleagues, who were originally terrified of this virus, are ready to get off this ride and get back to some form of relative normal.
“At this point I’d rather just get it,” I overheard at the Stop and Shop grocery storein Pennington, New Jersey yesterday.
Personally, I expect to be wearing a mask at indoor locations for many months going forward, if not years. Even as I oppose mask mandates and other Karen-generating policies, I consider it no inconvenience to wear a mask or maintain a healthy distance from strangers. I’ve never liked being physically close to people in the first place. [I guess my sensory processing problems are finally paying off!]
A recent news story out of the U.K., which was given little attention here in the U.S., concerned comments from one of the scientists that helped create the Oxford-AstraZeneca vaccine for COVID-19.
“We can’t vaccinate the planet every four to six months. It’s not sustainable or affordable,” Professor Andrew Pollard, the director of the Oxford Vaccine Group and head of the U.K.’s Committee on Vaccination and Immunization, told The Daily Telegraph.
This man cannot be dismissed as a crank trying to spread misinformation.
Dr. Pollard noted the much slower vaccine rollouts in countries outside Europe and North America as problematic for humans trying to control the coronavirus. The vaccines are too cost prohibitive and too transitory in their effect, he says.
Instead, he believes, in the future countries “need to target the vulnerable” rather than trying to vaccinate everyone, including healthy children, who are not at great risk from this virus.
Pollard further argued that we do not have enough evidence to warrant offering a fourth (‘second booster”) COVID-19 vaccine shot.
I fully expect Dr. Pollard will be banned from Twitter and Facebook if he keeps talking like this.
Is Omicron scarier than other COVID-19 variants?
Sadly, the Omicron variant has given new life to the COVID-19 panic cult, though, admittedly, there appears to be something different (and potentially scary) in the latest epidemiological data.
Normally, I would go straight to national or worldwide data to support this point, but some more localized numbers just startled me. The first was a from New Jersey’s Department of Health: On January 5th, 106 new COVID-19 deaths were reported in New Jersey.
New Jersey hasn’t seen numbers like that since the peak of the Winter 2020–21 surge. And we are a state that has implemented some of the most draconian COVID-19 measures to go along with one of the country’s highest vaccination rates. [My teenage age son received his booster shot the day the CDC approved it for his age group — and he had to stand in line behind other teenagers to get it.]
Predictably, Democrats and news pundits have made sick sport of victim shaming and blaming the unvaccinated for our nation’s growing COVID-19 cases and deaths. Unfortunately for their narrative, it was a second number from the county government in Bucks County, Pennsylvania (which neighbors my county) that really caught my attention: 38 percent of the 199 people hospitalized with COVID-19 during the week ending January 4th were vaccinated.
Figure 1: COVID-19 Hospitalizations in Bucks County, PA (week ending January 4, 2022)
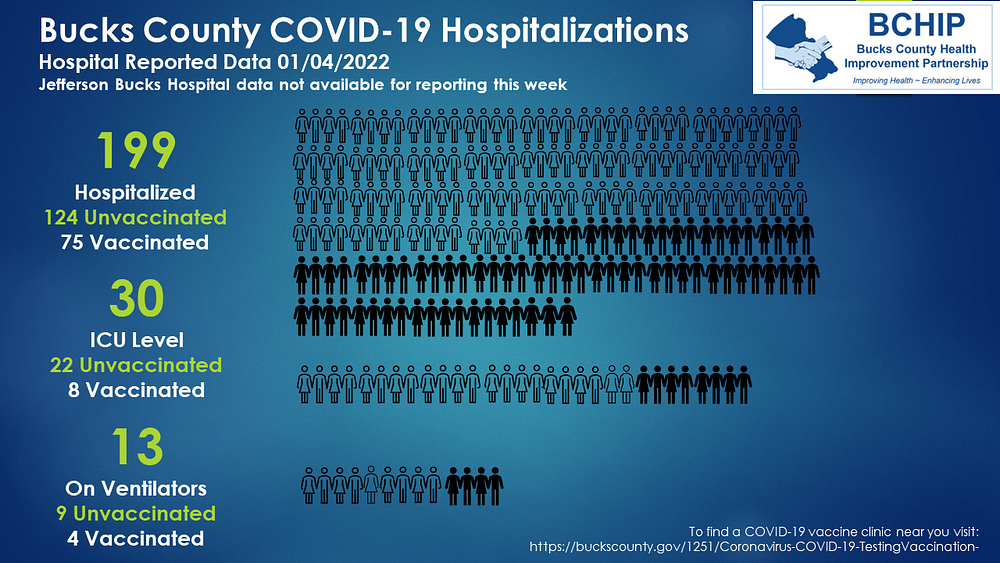
Maybe more distressing is that 27 percent of ICU patients during that week were vaccinated, as were 31 percent of COVID-19 patients on ventilators.
This is not my way of saying, vaccinations don’t matter. They absolutely do (and in a big way). But, as I increasingly hear people say they are weary of worrying about COVID-19, the public policy analyst in me recognizes that this country may be near its peak level of vaccination. As the second dose and booster jabs slowly wear off (in roughly 5 to 6 months), it may be difficult to get Americans to go back online to make reservations for future booster shots at the pace they did the first time. The current 62 percent full vaccination rate may be as good as it gets.
It is fantasy to think a country of 330 million people will ever achieve even an 80 percent full vaccination rate. As we start to vaccinate small children, who are not generally at risk for serious symptoms from COVID-19, the U.S. vaccination level will rise faster, but current trends according to New York Times’ statisticians estimate the end-of-year full vaccination rate will be around 75 percent. Notably, these statisticians admit their earlier long-term projects for U.S. vaccinations levels were far too optimistic.
The U.S. is probably nearing its maximum vaccination level. And it is not just because of “misinformed,” plaid shirt Republicans. In reality, it is hard to get people to do anything, even when it is in their best interest. People are busy with their lives. But, more importantly, they have a genetic propensity for misestimating their own risk probabilities. Life is much happier with your head in the sand. I can vouge for that.
It also doesn’t help that most people in this country will NOT die from COVID-19, no matter how long it stays with us. The odds are in the favor of those with meh amounts of concern about COVID-19.
I estimate from CDC’s reported numbers that there is about a 1-in-130 chance that an unvaccinated person will die from COVID-19 in the next 12 months. [I don’t like those odds, but many people do.]
You can’t build public policy around wishful thinking and an exaggerated sense of politicians’ power over nature. We need to develop a vaccine against such delusions and jab our political leaders and policy experts as soon as possible. Omicron, oddly enough, may be the vaccine to do just that.
Its hard to imagine that the American public can keep riding this rollercoaster as we are right now. Politicians from both sides of the aisle are already losing their appetite for strict COVID-19 related mandates.
When asked last month about expanding mask mandates in California as Omicron began to rise in his state, Governor Gavin Newsom punted: “I think a lot of people will self-enforce and do the right thing.”
What Gov. Newsom is really saying is that we can look forward to more mask-less Karen videos on YouTube.
So, without minimizing the seriousness of Omicron — which, by early scientific accounts, appears to be much more contagious than prior COVID-19 variants but less virulent — perhaps a look at the numbers might be in order.
Three caveats must be made before showing the latest COVID-19 case, hospitalization and death numbers. First, I am using aggregated data instead of individual-level data. For example, to estimate the percentage of COVID-19 positive people that are hospitalized or put in ICUs, individual-level data is ideally needed. I can only approximate those estimates using nationally aggregated data. Second, it is too early to know precisely the virulent nature of Omicron. Granted, we are not yet seeing the daily rise in deaths that followed case increases during the previous surges; but it will take more time to see the full picture. Third, because I am using aggregate time-series data, I cannot make definitive conclusions, particularly with regard to Omicron’s virulence. It is true that we are seeing falling fatality rates, but that does not necessarily mean Omicron is less dangerous. Those falling rates are also a function of better COVID-19 treatments, the healthier status of those contracting the virus and rising vaccination levels, among other factors that can affect fatality rates.
Early signs are that Omicron, even if it is less virulent, is more contagiousness will lead to record or near-record hospitalization and ICU rates, though we may not see fatality levels like those during the Winter 2020–21 surge (i.e., Third Wave).
Is Omicron more contagious?
In the aggregate Omicron appears more contagious, despite some uncertainty over whether the current numbers are a reflection of the Delta variant or Omicron. They are circulating at the same time.
There is a also a question of whether the current fast rise in cases is due to an increased number of people getting tested. Figures 2, however, should put that last question to rest. The recent change in the daily number of news COVID-19 cases does not appear to be following a similar surge in COVID-19 tests.
Figure 2: New COVID-19 Tests per 1K and New Daily Cases in U.S. (14-day moving averages)
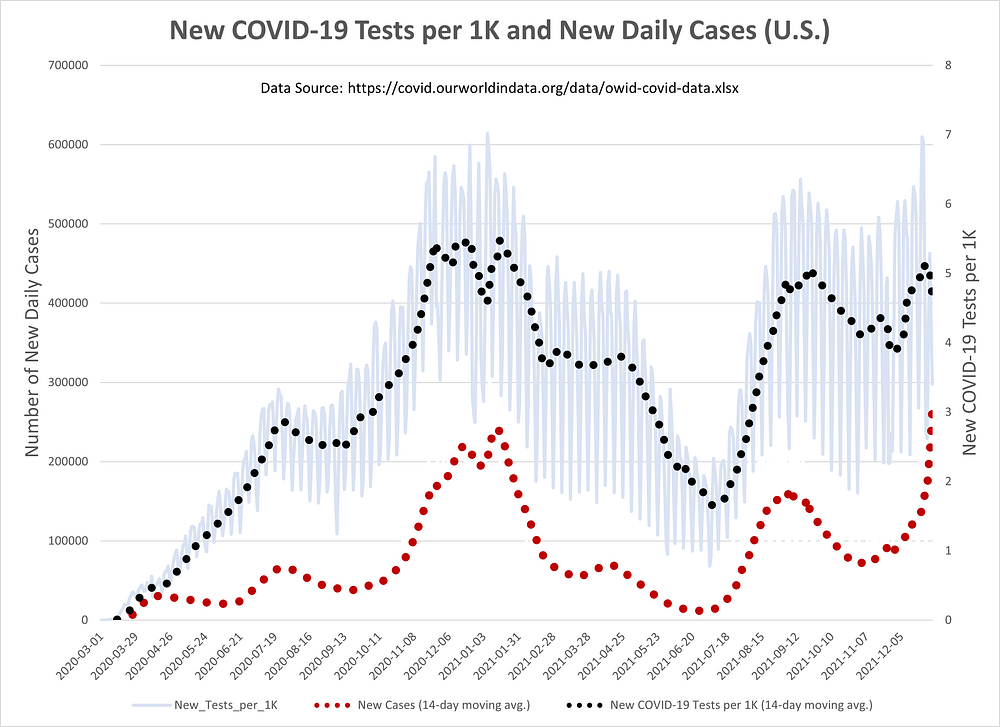
While the number of daily tests have increased in the last two weeks, it has not been on a scale similar to the daily rise in new cases. The U.S. is in unchartered territory right now in terms of case numbers.
So what happened?
By all appearances, Omicron is more contagious. We see that when we plot the number of daily tests (per 1,000 people) against the daily positivity rate of these tests (see Figure 3).
The daily positivity rate is at record levels right now.
Figure 3: New COVID-19 Tests per 1K and Positivity Rate (U.S.)
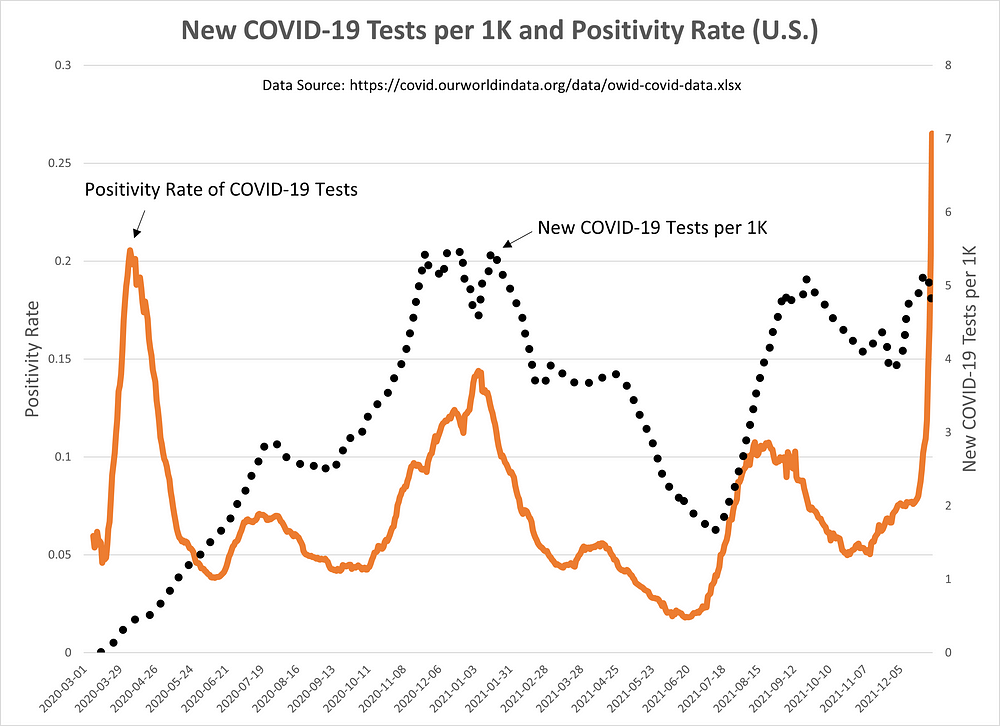
When we regress daily COVID-19 tests on the daily positivity rate, there are two extreme outlier periods: (1) the initial COVID-19 surge in Spring 2020, and (2) the most recent surge (presumably, Omicron).
The first outlier can be explained by the preponderance of early tests being dedicated to people showing strong symptoms. As testing became more prevalent and routine, that positivity rate moderated to some extent and rose more modestly during every new surge. That has changed in the latest surge.
Based on these aggregate numbers, I would conclude, even with the remaining presence of the Delta variant, Omicron is the cause of the recent positivity rate increases.
Is Omicron less lethal?
As noted earlier, it is difficult using aggregate time-series data to make definitive statements about Omicron’s lethality. Other confounding factors are in the mix (e.g., vaccination levels, treatment improvements, characteristics of the infected population, etc.).
Figure 4 plots two versions of the case fatality rate (CFR) for COVID-19. The black line represents the cumulative CFR, while the blue line represents the CFR calculated over a 30-day period. Also, shown are the daily vaccination numbers (as the orange dotted line). The recent drop in vaccinations should not be over-interpreted as the newest numbers tend to be revised upwards over time.
The CFR is calculated as the proportion of people diagnosed with a certain disease, who end up dying of it. It is inevitably an overestimate of the incidence fatality rate (IFR) which estimates this proportion of deaths among all infected individuals. Unlike the CFR, the IFR requires knowing the incidence of asymptomatic cases (which can be a large percentage for some illnesses).
The number we care about is the IFR. The number I have data for, however, is the CFR. Keep in mind, therefore, my estimates for the cumulative IFR of around 1.5 percent and 1.6 percent for the 30-day CFR are likely overestimates of the IFR.
As a crude estimate for COVID-19’s IFR, I consider the fact that the seasonal flu (prior to the pandemic) typically has an IFR around 0.1 percent and kills, on average, 40 thousand Americans every year. COVID-19 will have killed around 900,000 Americans in two years, or about 11.5 times the number of the seasonal flu. Ergo, I estimate COVID-19’s IFR to be around 1.2 percent. [If I’m close to the right number, that is horrific!]
Figure 4: 30-Day and Cumulative COVID-19 Case Fatality Rate (CFR) in U.S.
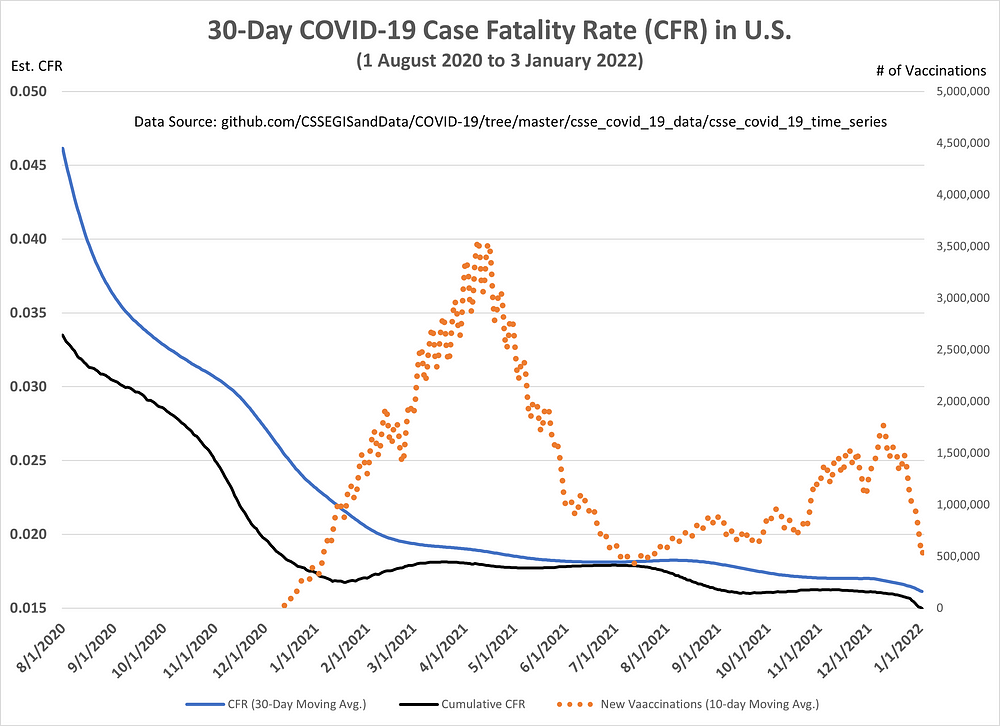
Back to the issue at hand: Is Omicron more lethal? According to Figure 4, the U.S. is at an all-time low for its cumulative and 30-Day CFR estimates (1.5 and 1.6 percent, respectively). Therefore, I believe this is evidence of Omicron’s lower lethality, with one caveat — we simply haven’t seen the full impact of Omicron on death counts.
Also supporting the conclusion that Omicron is less lethal is the experience of other advanced economies where Omicron is rapidly growing in appearance.
As of January 1st, of the 31 advanced economics I analyzed in Europe and Asia, 74 percent were at or near all-time low in cumulative CFRs (Data available upon request to kroeger98@yahoo.com). The average cumulative CFR for these countries is 1.0 percent — giving me another opportunity to point out how the U.S. health care system again grossly underperforms relative to our other economic partners.
Those countries seeing significant increases in CFR included Taiwan, Russia, Liechtenstein, Greece, India, Singapore, Austria, and South Korea.
Maybe Omicron isn’t more deadly, but is it causing higher hospitalization and ICU rates?
With the rise of Omicron, the news stories are multiplying about rising hospitalization levels across the U.S.
But an equally important question is the probability an infected person will go to the hospital or ICU. By early accounts, Omicron is filling hospitals because of its high contagion rate, not necessarily its virulence.
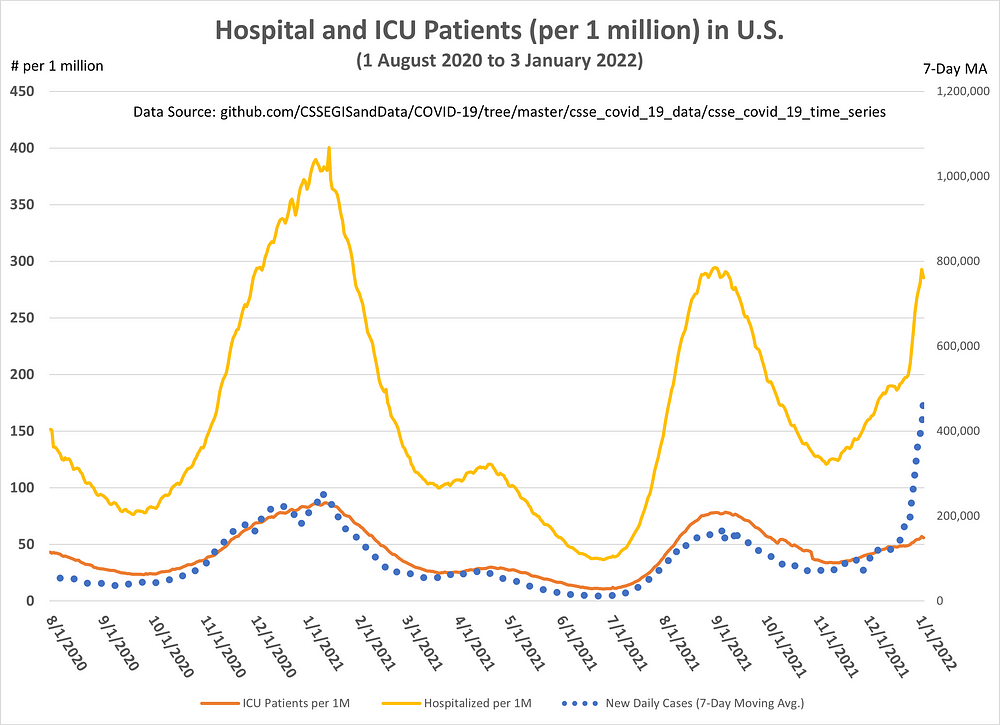
As seen in Figure 5, hospital (yellow line) and ICU (dark orange) admissions per 1 million people are surpassing last summer’s surge and could very well surpass all-time highs before this current surge is over.
Figure 5: Hospital and ICU Patients (per 1 million) in the U.S.
But as the hospitalization and ICU rates, the story is different.
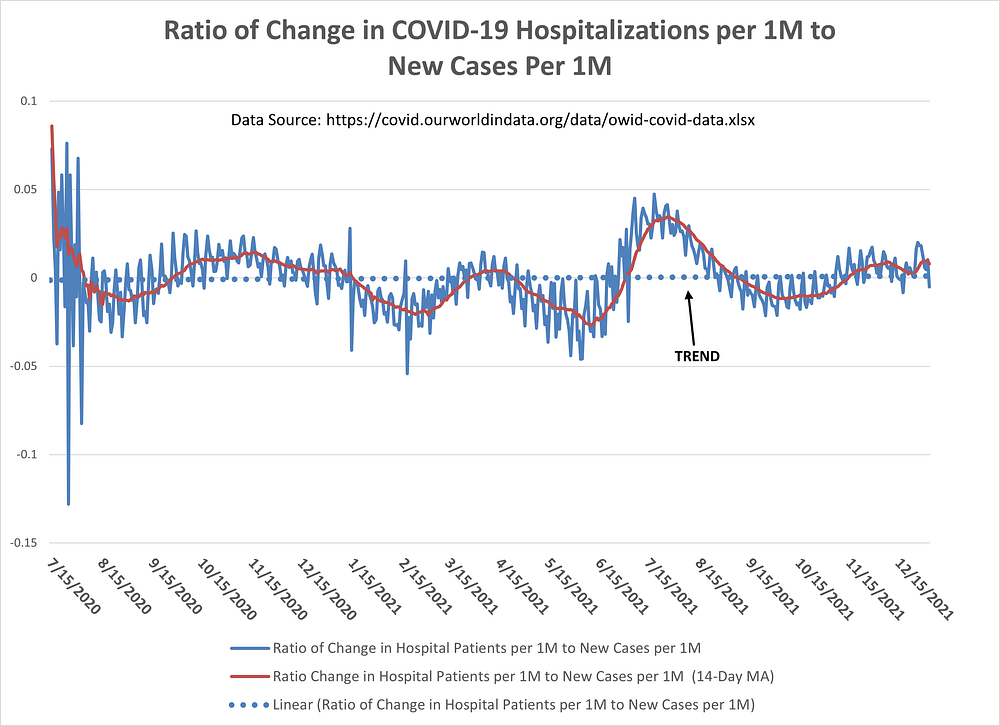
Figure 6 attempts to show the relationship between changes in the number of COVID-19 hospitalizations with changes in the number of new cases. Are new COVID-19 cases more or less likely to get admitted into a hospital over time?
As noted, since I do not have access to individual-level patient data, I can only approximate that relationship.
The important line in Figure 6 is the dotted blue line, which represents the trend in the ratio of new COVID-19 hospitalizations to new cases.
There appears to be no trend in this ratio. A new COVID-19 case today is just as likely to be admitted into a hospital as it was in Summer 2020.
Figure 6: Ratio of Change in COVID-19 Hospitalizations (per 1M) to New Cases (per 1M) in the U.S.
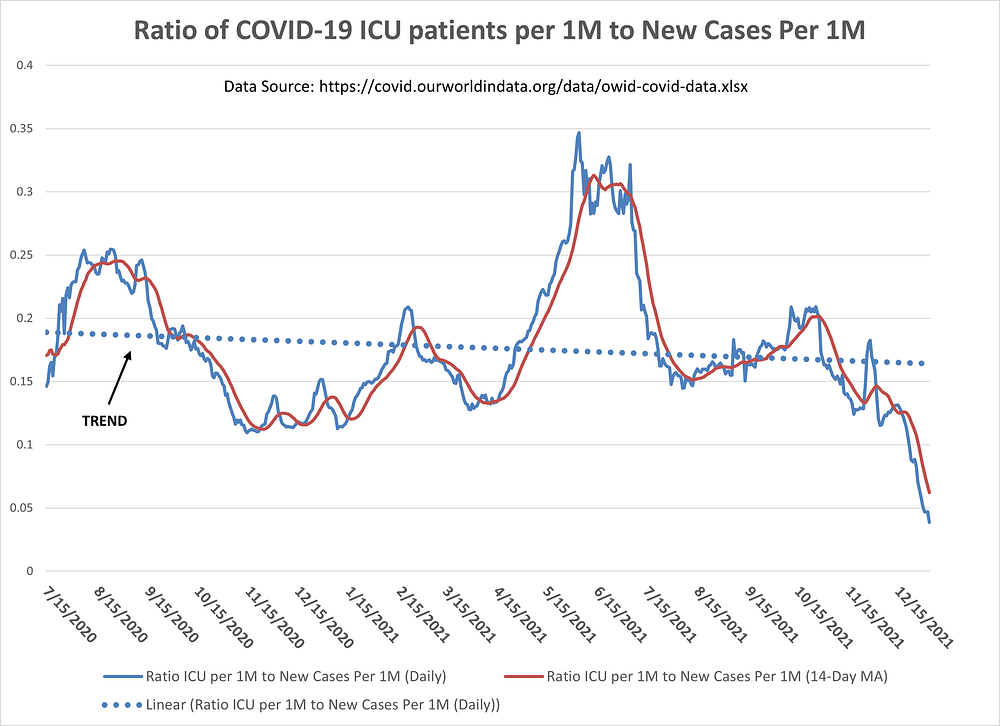
But what about the probability of a new COVID-19 case ending up in an ICU?
With the same caveat as in Figure 6, the graph in Figure 7 shows the ratio of COVID-19 ICU patients (per 1 million people) to new cases (per 1 million people). Ideally, I would have calculated the ratio of ICU patients to current “active” cases. However, I consider the “active” case numbers for the U.S. as unreliable as not every state consistently tracks patients from start to finish of their illness.
States, however, have been doing a fair job of registering new COVID-19 cases and Figure 7 indicates that the probability of a new COVID-19 patient ending up in an ICU has been going down since Summer 2020 (see dotted blue trend line). This, of course, may be due to many factors such as vaccinations levels, characteristics of patients, and improved treatments. But do notice the steep drop in this ratio in recent weeks. This could be a further indication of Omicron’s lower virulence.
Figure 7: Ratio of COVID-19 ICU patients (per 1M) to New Cases (per 1M) in the U.S.
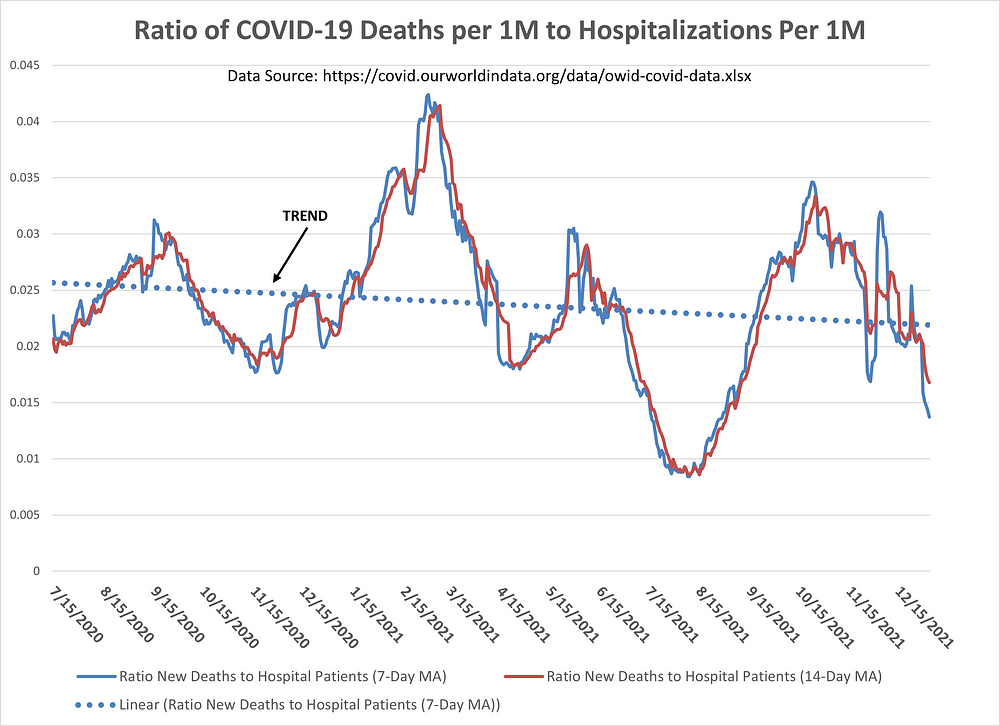
And, finally, in Figure 8 we have the ratio of COVID-19 deaths (per 1 million people) to hospitalizations (per 1 million people). Again, the trend line (dotted blue) has been going down since Summer 2020. The probability of a hospitalized COVID-19 patient dying from COVID-19 appears to be going down over time.
Figure 8: Ratio of COVID-19 Deaths (per 1M) to Hospitalizations (per 1M) in the U.S.
Final Thoughts
The findings in this essay are consistent with the most reported research on COVID-19. My intention here is more to demonstrate that publicly-available COVID-19 data in the aggregate is potentially useful in capturing the 30,000-foot view of the COVID-19 pandemic.
In clinical and epidemiological research, there is no substitute for individual-level patient data. However, much can still be learned with sub-optimal data if accompanied by sufficient care and caution.
Stay safe. Wear a mask. Keep your distance. And get vaccinated.
- K.R.K.
Send comments to kroeger98@yahoo.com