By Kent R. Kroeger (Source: NuQum.com, May 28, 2020)
“I don’t believe I am costing lives at all,” said Missouri Governor Mike Parson (R) in late March as he rejected calls for a statewide stay-at-home (SaH) order. “The effects that (a statewide SaH) will have on everyday people are dramatic. That means businesses will close, people will lose their jobs, the economy will be in worse shape than ever.”
At the time Governor Parson said those words, eight Missourians had lost their lives to COVID-19. Two months later, the death toll stands at 705 (or about 115 people per 1 million Missouri residents), putting the Show-Me state at 26th among the 50 states (plus District of Columbia) in the relative number of COVID-19 deaths. Missouri is ranked 37th in the relative number of confirmed COVID-19 cases at 2,088 per 1 million people.
In other words, Missouri’s performance so far in containing the coronavirus is roughly average to above-average.
It can’t emphasized enough that this pandemic is still an ongoing and many of the Middle America states that refused to impose stay-at-home orders, such as Iowa, Nebraska and Arkansas, are now in the middle of their first wave of cases (as opposed to states like New York and New Jersey that are near the end of the first wave).
Still, it is legitimate to consider whether Governor Parson was at least partially correct about SaH orders (though he did end up issuing a SaH order on April 6th). This question is particularly important as all 50 states (plus the District of Columbia) are in the midst of slowly re-opening for business — some faster than others.
What is not helpful nor analytically pertinent is the suggestion that one party is wholly responsible for increasing the number of COVID-19 deaths or worsening an economic recession merely for political gain.
At least, as of today, explicitly political variables (e.g., a state governor’s political party, Trump’s share of the statewide vote in 2016, etc.) offer little information that can explain the relative number of COVID-19 cases and deaths across states.
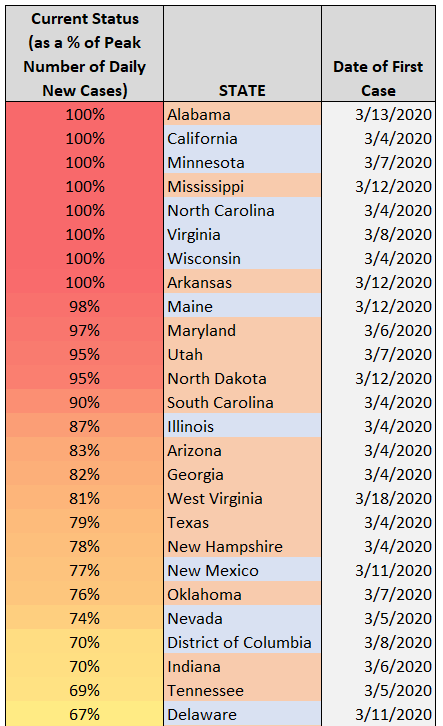
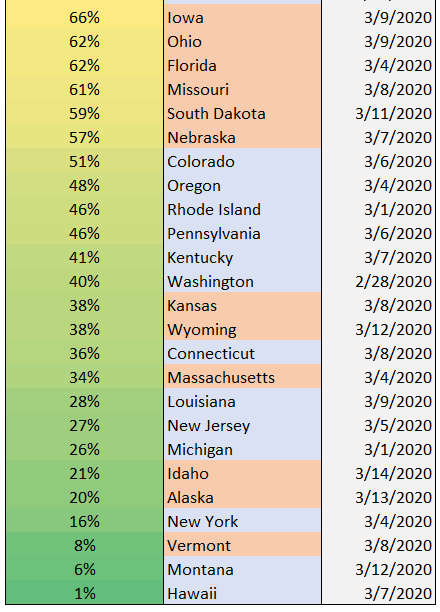
However, today we are in a period where many of the Democrat-led states (CT, HA, KY, LA, MI, MT, NY, NJ, OR, RI, PA, WA) are witnessing significantly lower numbers of new cases as the first wave of the COVID-19 pandemic nears its end in those states (see Figure 1). Six out of the 10 states with the lowest relative number of new cases in the past week (May 19th to 25th) are led by Democratic governors.
In contrast, four out of the 10 states with the highest relative number of new cases new cases in the past week are led by Republican governors.
Figure 1: A state’s recent new cases (7-day moving average, May 19–25) as a percent of the state’s highest 7-day average (Data from 22 Jan — 25 May)
If there is a partisan effect on how long this pandemic is extending, it is more subtle than appreciated.
A more explanatory hypothesis might be that the start of the summer tourism season is starting to increase new COVID-19 cases for coastal states (AL, CA, GA, ME, MD, MS, NC, SC, TX, VA). Figure 2 shows a selection of beach states and their 7-day moving average trends in new cases.
Figure 2: New COVID-19 Case Trends by Selected Beach States (as of 25 May)
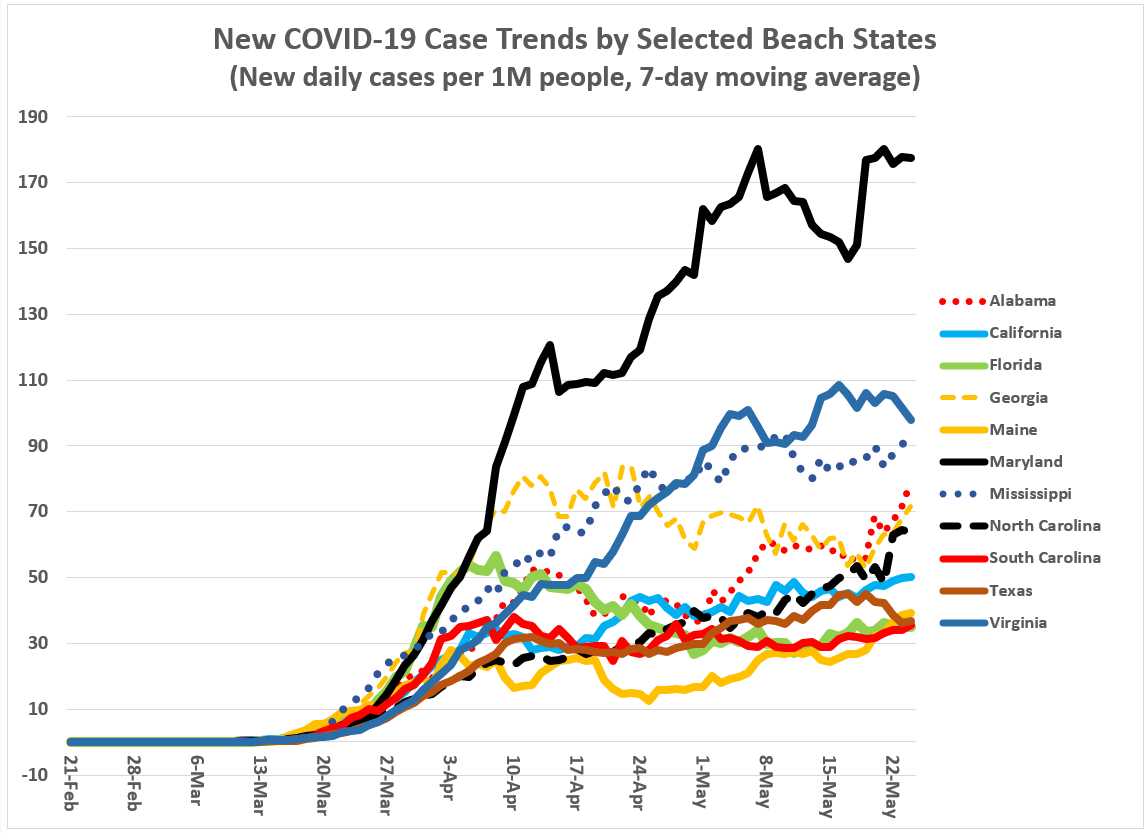
We’ve seen the pictures and video from the Memorial Day weekend: Ocean City, MD tourists cramming along the boardwalk with not even a quarter of the people wearing face masks.
Even you believe it is hard to transmit the COVID-19-causing virus (SARS-CoV-2) or believe its effect is not significantly different from the seasonal flu, not donning a mask is disrespectful to those who believe otherwise. Its called being neighborly and its a small price to pay if that is what it takes to keep our beaches and outdoor entertainment facilities open.
In the next 14 days or so, we will see the impact of the Memorial Day weekend on new COVID-19 cases. If we don’t see a bump, expect almost all states to accelerate their phase-out of business closures and SaH orders. If we witness a surge, on the other hand, the recriminations and calls for extending SaH orders will thunder across cable news networks and social media.
New COVID-19 Path Model (updated through 25 May 2020)
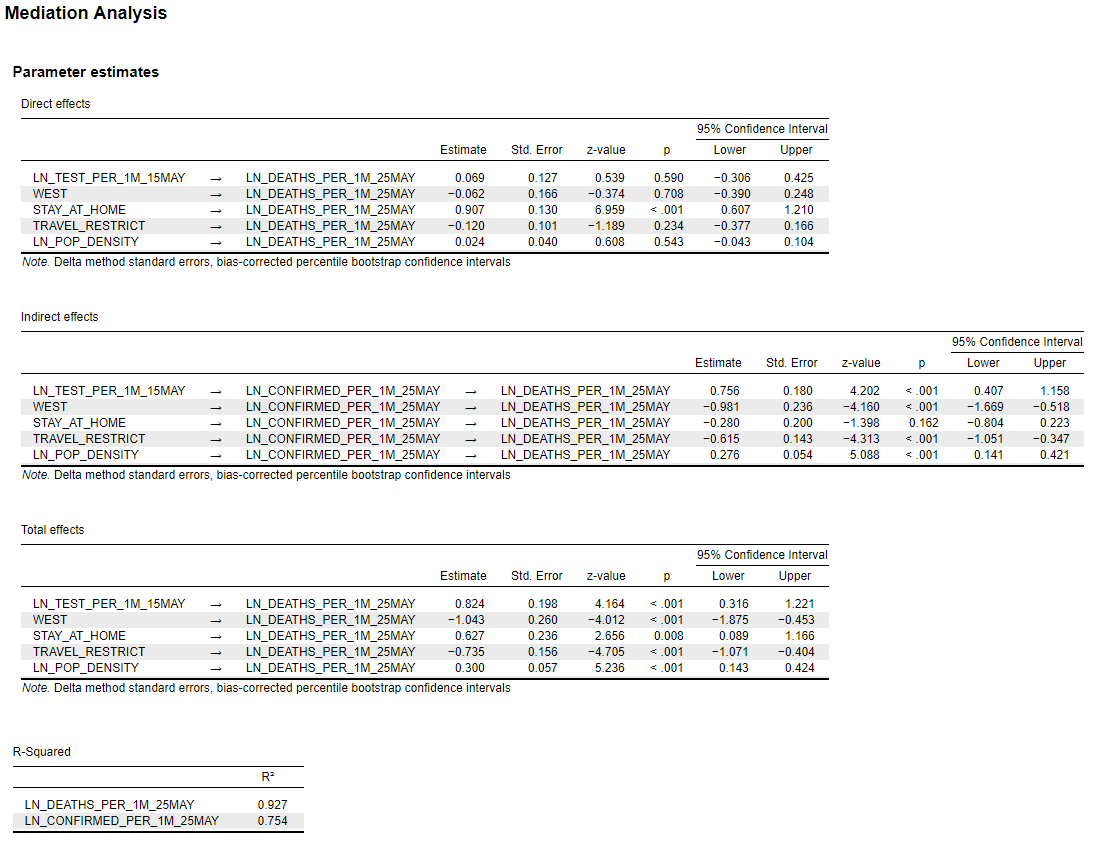
Figure 3 (below) shows the coefficient estimates for a path (mediation) model estimated in JASP, a free statistical software package available here. More detailed results for this path model are in the Appendix at the end of this essay.
As with previous path models I’ve estimated for the COVID-19 pandemic, the outcome of interest is the relative fatality rate for COVID-19 (measured in each state as the number of fatalities per 1 million people). The mediating variable is the relative confirmed case rate (number of cases per 1 million people) and the other predictor variables are: (1) A binary variable for West Coast states (CA, HA, OR, WA), (2) A binary variable for whether a state imposed a SaH order, (3) a binary variable for states that imposed travel restrictions, (4) the number of COVID-19 tests (per 1 million people), and (5) a state’s population density. [Note: An indicator variable for “Beach” states was only weakly correlated with the outcome and mediation variables and was therefore left out of the final path model.]
Overall, the path model in Figure 3 explains 75 percent of the variance in relative confirmed case rates and 93 percent of the variance in relative fatality rates.
Figure 3: COVID-19 Path Model (U.S. data updated through 25 May 2020)
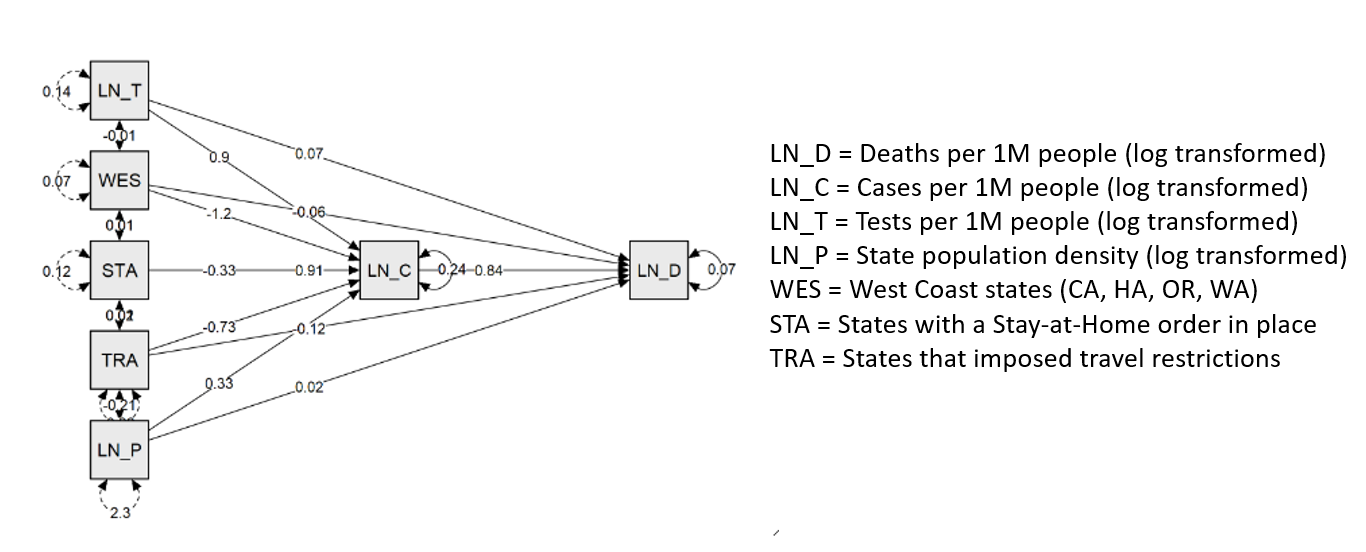
In the case of COVID-19-related fatalities through May 25th, by far, the most significant correlate is the relative number of confirmed cases. That is not surprising. More puzzling is that SaH states have experienced disproportionately more COVID-19 fatalities than non-SaH states, all else equal. This relationship is weak enough, however, that it could change when the first wave of this pandemic is over for every state. Those two variables were the only variables significantly correlated with COVID-19 fatalities.
The more interesting results are for the factors correlated with the relative number of confirmed cases where (as in past models I’ve estimated) a state’s population density and the number of COVID-19 tests (per 1 million people) are the most significant correlates with case rates.
However, we also find two policy variables negatively correlated with case rates (SaH orders and Travel Restrictions). In other words, the presence of a SaH order and travel restrictions in a state independently correlate with fewer COVID-19 cases in that state. This is in consistent with our expectations that these policies should suppress confirmed case numbers (if only temporarily).
Finally, the West Coast states (CA, HA, OR, WA) are also negatively associated with relative confirmed case rates. This relationship has been fairly consistent over time, if previous path models are an indication.
The significance of West Coast states, however, may not be a function of the specific policies in those states (though all four were aggressive in putting SaH orders in place early). There is epidemiological evidence that the U.S. West Coast has been predominately hit by a slightly weaker form of the SARS-CoV-2 virus compared to the U.S. East Coast. For this reason, I hesitate to assume West Coast state policies are the sole reason for their relatively lower case rates. It most likely a combination of the SARS-CoV-2’s pathogenic characteristics and state policies.
Final Thoughts
As I must always caveat any statistical finding related to the COVID-19 pandemic: the pandemic is far from over. In fact, we may only be in the first of many contagion waves for this virus, according to The University of Minnesota’s Center for Infectious Disease Research and Policy (CIDRAP). Indeed, the hopeful discovery and production of a SARS-CoV-2 vaccine by early next year (or possibly late this year) may not completely eliminate the presence of COVID-19 in our lives.
Furthermore, our knowledge about this virus seems to change by the day. On day the CDC can say picking up the virus from surface exposure, and the next day the CDC retracts that statement and says “it is possible to become infected by touching a surface containing the active virus.”
We just don’t know enough to make strong declarative statements yet on what policies will or won’t defeat SARS-CoV-2.
For all of these reasons, the partisan narratives polluting our airwaves over this virus are not helping in the slightest. These partisan tirades from both sides are, in fact, hurting the learning process for those in a decision-making position who must increasingly filter out the noise to get to the facts.
No politician, in the U.S. or elsewhere, has made perfect decisions regarding COVID-19 and they will make mistakes going forward. [I know how successful New Zealand Prime Minister Jacinda Ardern has been in pushing policies that have successfully suppressed the virus in her country; but, remember, New Zealand is an island. They have an advantage. The same goes for Hawaii.]
It is time to chuck the partisan noise driving the coronavirus narrative in the national media and, instead, focus on the actual facts.
Recent COVID-19 data has not been a good news story for a significant number of Republican-led states. Unfortunately for some Democrat-led states (e.g., CA), it has been a tough week for them too.
What is clear from a statistical point of view, the coronavirus does not give a bucket of owl spit about anyone’s political preferences. The coronavirus is brutally apolitical.
Slowly and methodically, the U.S. states are converging towards similar COVID-19 case and death rates, independent of partisanship or public policy. That does not mean public policy is irrelevant. Governors are merely rearranging chairs on the Titanic. Ask Hawaiians if state-level coronavirus policies have made a difference. They have mattered, as we can see with the significance of travel restrictions and statewide stay-at-home orders in the above path model.
Policies matter. But the pathogenic characteristics of the SARS-CoV-2 virus matter more. It is highly contagious and three to four times deadlier than the average seasonal flu, according to the newest estimates by the Centers for Disease Control and Prevention.
So, please wear a mask…even if you are at the beach.
- K.R.K.
Send comments to: kroeger98@yahoo.com
or tweet me at: @KRobertKroeger1
APPENDIX: Path Model Output and Diagnostics
