By Kent R. Kroeger (Source: NuQum.com, May 18, 2020)
Social scientists have long recognized that humans have a psychological need to control their environment and individual perceptions of one’s ability to exert such control affects one’s sense of well-being and happiness.
On a macro-level, Anthropologist Leslie White once wrote that human cultural evolution is the “process of increasing control over the natural environment” through technological progress.
He even proposed a simple equation, known as White’s Energy Formula, to summarize his neoevolutionist view:
C = ET
where E is a measure of energy consumed per capita per year, T is the measure of efficiency of technical factors utilizing the energy and C represents the degree of cultural development.
The coronavirus (SARS-CoV-2) has shaken one of our most durable assumptions about human history: the near uninterrupted progress of human society over time.
Today, we live better than our parents, who lived better than their parents, who lived better than their parents…and on and on it goes.
If we view progress as our ability to produce greenhouse gases and consume heavily processed foodstuffs, we’re kickin’ it like never before. If we take a more comprehensive view of human happiness, however, the progress myth was never true.
As businessman Mark Cuban recently said: “I’m worth billions and I’m afraid to leave my damn house.” But that is just one manifestation of the coronavirus’ power over humans.
We live in the coronavirus’ world for now — and when will that end?
“The (corona)virus dictates the the timeline for lifting restrictions, not us,” said a New York epidemiologist on WNYC-FM last Friday.
Still, since the earliest stages of the COVID-19 pandemic, experts, bureaucrats, and politicians have hammered on the same basic message: We can control the coronavirus.
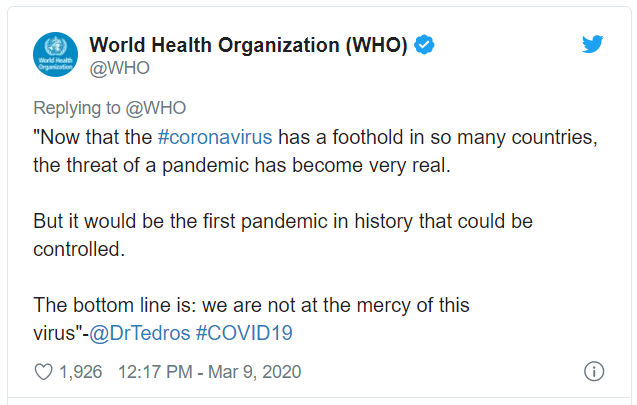
“We are not at the mercy of this virus,” said the WHO Director-General Tedros Adhanom Ghebreyesusat a March 9th media briefing. “All countries must aim to stop transmission and prevent the spread of COVID-19, whether they face no cases, sporadic cases, clusters or community transmission.”
The WHO Director followed up his press conference with a tweet:
At around the same time, Dr. Marc Lipsitch, a professor of epidemiology and director of the Center for Communicable Disease Dynamics at the Harvard T.H. Chan School of Public Health, wrote:
“The city of Wuhan, China, where Covid-19 started, waited weeks before acknowledging human-to-human transmission and taking measures to control it. Wuhan thus experienced an out-of-control epidemic that overwhelmed the health care system. The city felt these effects for weeks after intense control measures were in place, as newly infected people got sick and required care. Other cities in China watched Wuhan’s experience and imposed strict controls at a much earlier stage in their epidemic: They closed schools, sharply limited social contact, and traced and isolated cases and contacts. These early interventions dramatically slowed transmission. No other Chinese city has repeated Wuhan’s horrific experience so far.
These experiences…show that early and sustained imposition of measures to limit social contact will slow the epidemic. This is desirable for many reasons — fewer total people get infected in a slowly moving epidemic; those who do get infected do so later, on average, so doctors will have learned more about how to care for the illness, and antiviral drugs may even be available.
Most important in light of Wuhan’s crushing experience, a controlled epidemic has a lower peak, reducing the strain on health systems. From the perspective of disease control, every effort should be made, as soon as possible, to slow the spread of the virus and flatten the epidemic curve. If these interventions are not sustained, spread will resume, but every action to slow it buys us some time and probably reduces the total size of the outbreak.”
Within days of the WHO and Dr. Lipsitch statements — as well as from other public officials and epidemiologists around the world — the majority of the northern hemisphere rapidly implemented the core recommendations: (1) school and business closures, (2) lockdowns (‘shelter-in-place’), (3) travel restrictions, (4) social distancing requirements (e.g., masks, “the 6-feet rule”), (5) and the promulgation of stricter personal hygiene techniques (e.g., “20-second hand washing”).
Have these efforts worked? How would we know?
Is the U.S. (& the world) controlling the coronavirus (SARS-CoV-2)?
From the U.S. experience (so far), aggregated to the state-level, the data do not tell us which suppression and mitigation (S&M) efforts have been more effective than others.
Working against the data are numerous methodological issues: (1) states implementing multiple S&M techniques simultaneously (confounding factors), (2) vast majority of states (and all of the large, densely-populated states) implemented ‘shelter-in-place’ orders, though some states adopted this policy later than others (e.g., Texas, Florida, Oklahoma, Kansas), (3) significant variation between states in how otherwise similar S&M techniques were implemented, and, most importantly, (4) the pandemic is not over in the U.S. by any stretch of the imagination.
Adding to these complications is this fact: the COVID-19 pandemic has included more than one coronavirus, with at least one being more contagious than others.
According to a recently released Los Alamos National Laboratory study, a new (mutated) strain of the coronavirus has become dominant in Europe and the U.S. East Coast and is potentially more contagious than versions that dominated China and the U.S. West Coast during the early stages of the pandemic.
If true, how can we compare New York and California’s response to the coronavirus if they are dealing with fundamentally different viruses?
It makes the analysis difficult — but not impossible. Studies using probability-based sampling are already in the field throughout the U.S. and when their results are available, more sophisticated statistical controls will better facilitate such comparisons.
In the meantime, we have U.S. county-level data from Johns Hopkins University (CSSE), updated daily, which continues to suggest four state-level factors are correlated with the spread and lethality of the COVID-19 pandemic in the U.S.: (1) Population density, (2) Testing incidence, and (3) Travel restrictions, and (4) an indicator for West Coast states (CA, HI, OR, WA).
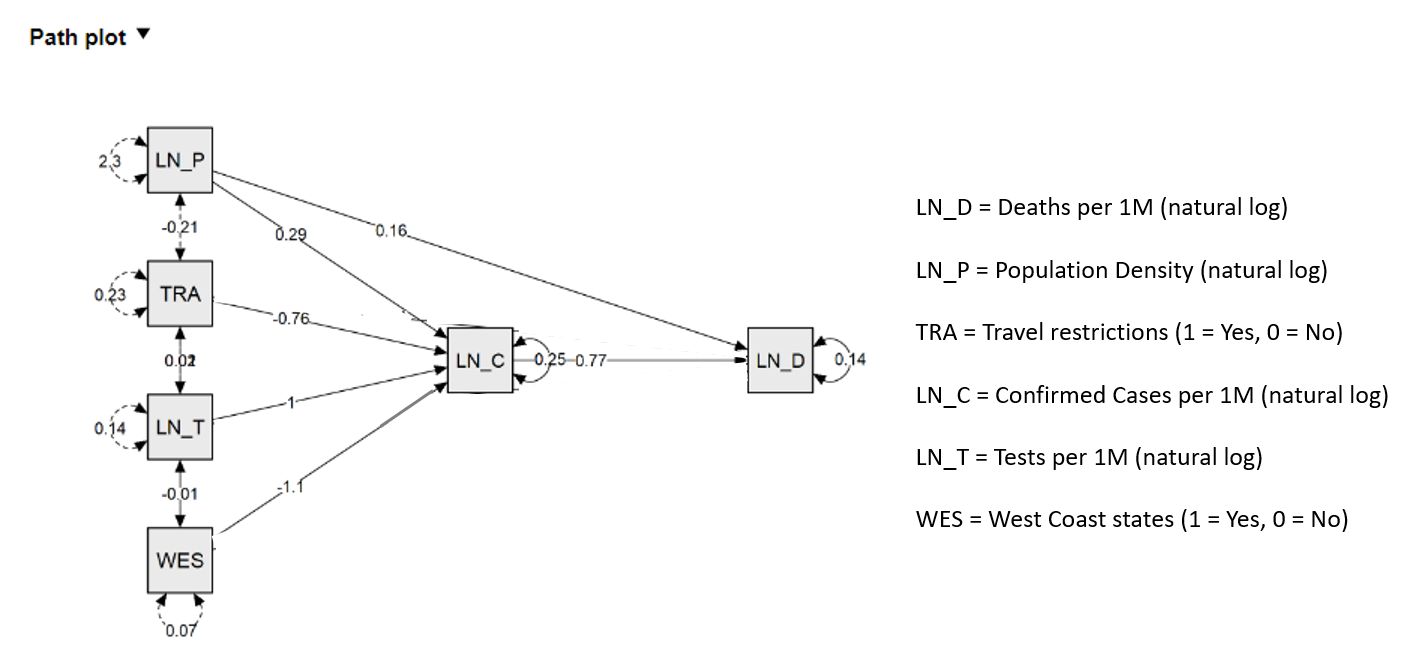
See Figures 1 and 2 for a path model (mediation) analysis of the spread and lethality of the coronavirus in the U.S. at the state-level (through May 15th).
While only a state’s population density (per sq. mile) is significantly correlated both directly and indirectly with the number of COVID-19 deaths (per 1 million people), the total effects are significant for all four factors.
Figure 1: Path model estimates for COVID-19 deaths per 1M (output) and COVID-19 cases per 1M (mediator) for the U.S. through May 15, 2020.
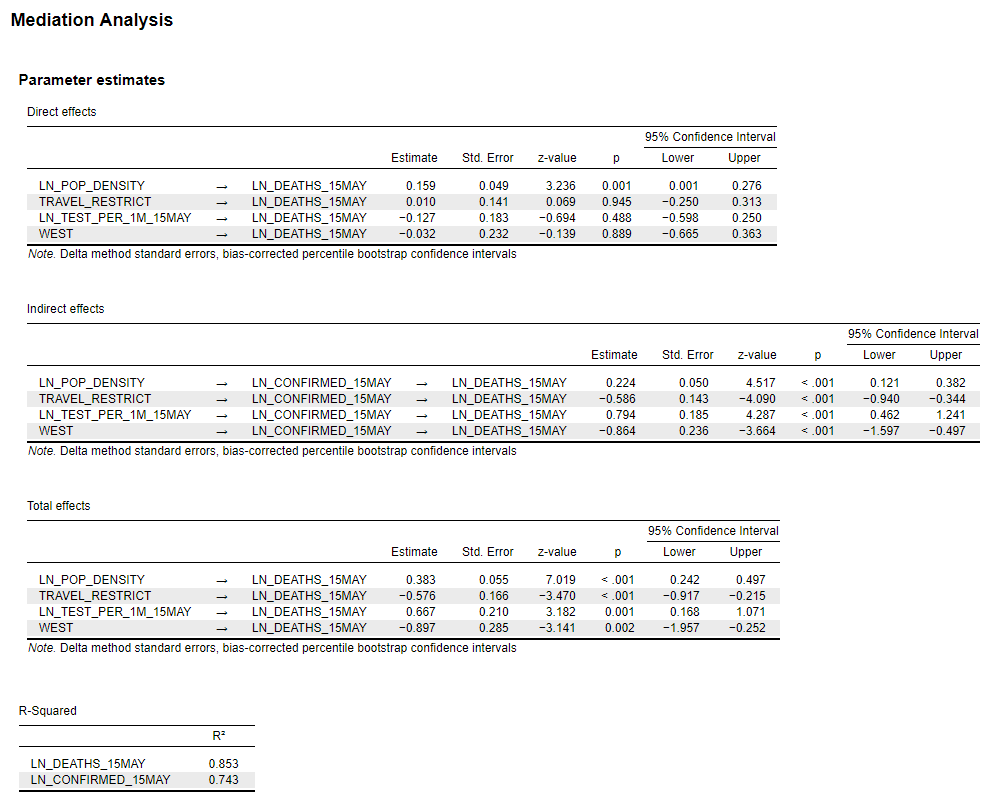
Figure 2: Path model estimates for COVID-19 deaths per 1M (output) and COVID-19 cases per 1M (mediator) for the U.S. through May 15, 2020.
While researchers note that population density alone cannot explain many of the differences in COVID-19 morbidity and mortality across the U.S. — for example, New York City and San Francisco are both densely populated but have significantly different morbidity and mortality rates — it is manifestly a major factor, if not the dominant factor.
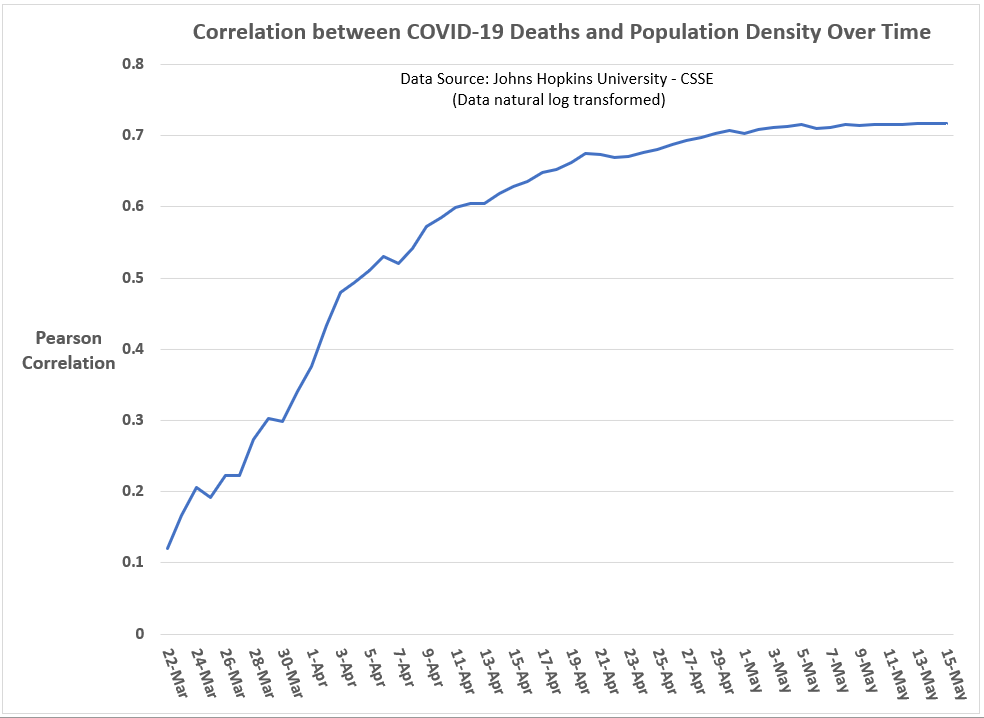
As can be seen in Figures 3 and 4, the correlations of state-level population density and state-level COVID-19 case rates and fatality rates have increased over time, reaching in mid- to late-April an apparent threshold of 0.64 (Pearson coefficient) for cases and 0.72 for fatalities.
Figure 3: Correlation between COVID-19 cases (per 1M) and a state’s population density over time (U.S. state-level analysis; data through May 15, 2020).
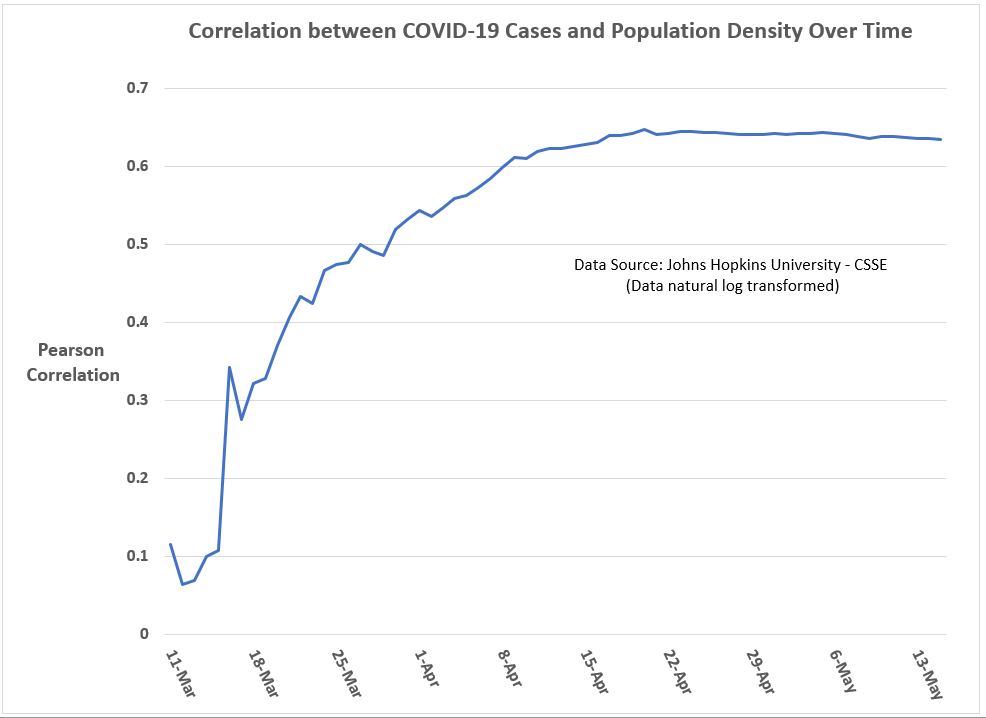
Figure 4: Correlation between COVID-19 deaths (per 1M) and a state’s population density over time (U.S. state-level analysis; data through May 15, 2020).
To my eyes, this over-time convergence in the correlation coefficient for population density reminds me of how population parameter estimates in sample surveys converge as sample sizes increase.
As for the other variables in the path model, the significance of the West Coast-indicator confirms that something substantively different is happening in those states — be it the characteristics of the virus itself, the S&M policies of those states, or both.
Likewise, as has been the case since I first estimated models for U.S. state-level COVID-19 cases and deaths, those states that implemented internal travel restrictions on its citizens (AL, AZ, DE, FL, HI, ID, KS, KY, ME, MT, ND, NM, OK, RI, SC, TX, UT, VT, WV, WY) are experiencing significantly lower COVID-19 case incidences than other states, all else equal.
Overall, the path model explains about 75 percent of the state-level variance in COVID-19 case incidences and 85 percent of COVID-19 death incidences — all without any reference ‘shelter-in-place’ orders and their timing, which were found to be insignificant in this cross-sectional (i.e., one-point-in-time) analysis when included in the model.
Have the ‘Shelter-in-Place’ orders been ineffective? The state-level evidence is not clear on this question, though I feel some confidence in saying that broad, state-level “Shelter-in-Place’ orders have no statistically significant relationship with state-level case and fatality rates. Unless it is the location of a cluster outbreak, why should Wanakah, New York (Population 2,824) be under a state-ordered lockdown? I can’t find any justification in the data for such a policy.
But does that mean these orders didn’t help moderate the scale of the coronavirus pandemic? Absolutely not.
Imagine there is a parallel universe where New York didn’t institute a ‘Shelter-in-Place’ during the coronavirus pandemic. Do you think the end result would have been the same as in our universe? I don’t.
Unfortunately, we don’t have access to this parallel universe. We have only this one. And in this one New York suffered more than any other U.S. state during the coronavirus pandemic, even with a statewide shutdown.
But do not despair, the path model presented here offers strong evidence that states are far from powerless in addressing viral outbreaks, with testing rates being the most important controllable factor.
Still, the statistical evidence reminds that us that factors outside the control of political actors and subject-matter-experts — population density and a virus’ characteristics (contagiousness and lethality), including regional variations in those characteristics — explain a significant portion of state-level variances in case and fatality rates.
A state cannot easily control its population density or its location on a map and as this pandemic progresses over time, the impression I am left with is that states are becoming more similar, not different, in their COVID-19 case and fatality rates.
In other words, a state’s S&M strategies can definitely ‘flatten the curve,’ but these strategies may be more limited in their ability to change the eventual incidence rates in cases and fatalities.
Are we all going to end up like New York? Probably not, as we do have some control over the COVID-19 pandemic, though probably not as much as we want to believe. And when I say we, I mean our elected politicians.
Watching New York Governor Andrew Cuomo’s daily press conferences on the coronavirus remind me of Billy Crystal’s catch phrase when doing his Fernando Lamas imitation on Saturday Night Live: It is better to look good than to feel good. [An analogous axiom I learned while working in the Federal Government may also apply: It is more important to look busy than to be busy.]
Governor Cuomo sure looks like he knows what he’s doing about the coronavirus, but the reality for New Yorkers is far different.
New York nonetheless leads the country in the relative number of COVID-19 cases (1,458 per 1 million people) and deaths (18,522 per 1 million people) and only New Jersey appears close enough to challenge New York for those two ignominious titles.
In all fairness, New York has seen its number of new cases and fatalities drop dramatically in the past two weeks:
New York is among only six states to see its current 7-day moving average in new confirmed cases fall below 25 percent of its peak. New York’s 7-day moving average peak in cases was 9,909 per day (on April 10th). As of May 15th, New York’s current 7-day moving average is 2,201 per day. The other states under 25 percent of their peak are: Alaska, Hawaii, Idaho, Montana, and Vermont.
New York is also among seven states to see its current 7-day moving average in new deaths fall below 25 percent of its peak. In New York’s case, its 7-day moving average peak in deaths was 951 per day (on April 12th). As of May 15th, New York’s current 7-day moving average is 234 per day. The other states to share this honor with New York are: Alaska, Hawaii, Idaho, Montana, Vermont, and Wyoming.
Barring any major setbacks — which is possible given the virus might be in more control than we realize — New York is the only large-population state on those two lists. [Maybe I was too hard on Governor Cuomo earlier?]
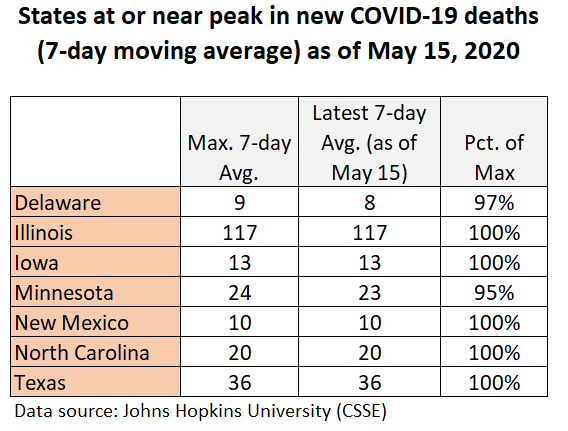
Unfortunately, there is an equally long list of U.S. states that are currently at or near their peaks in COVID-19 cases and deaths (see Figures 5 and 6).
Figure 5: States at or near peak in new COVID-19 cases
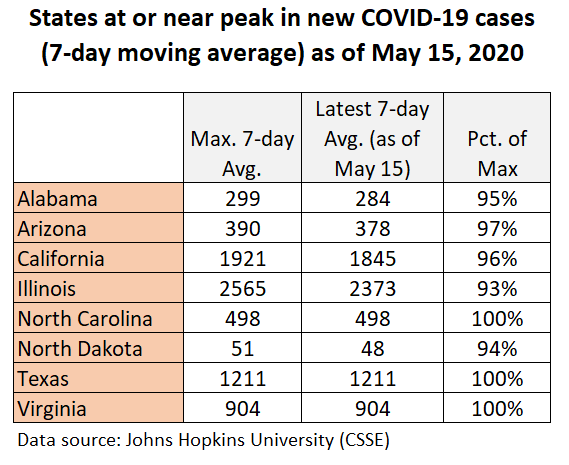
Figure 6: States at or near peak in new COVID-19 deaths
Should the data make us optimistic or pessimistic?
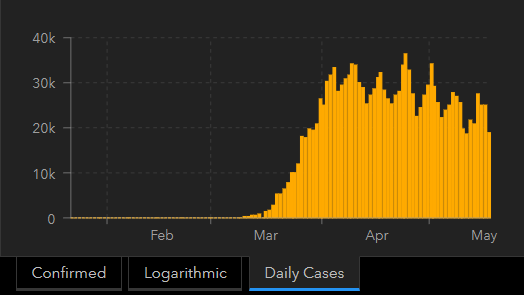
Based on the data, I am promiscuous in my belief that the U.S. is on the downhill side of this first coronavirus wave (see Figure 7). As for future waves, there is no consensus among epidemiologists on the shape they will take, but there appears to be a consensus that they will occur.
“This virus is on its own time schedule,” according to University of Minnesota epidemiologist Michael Osterholm. “But we will have some tough months ahead.”
Figure 7: U.S. trend in new COVID-19 cases (as of May 18th)
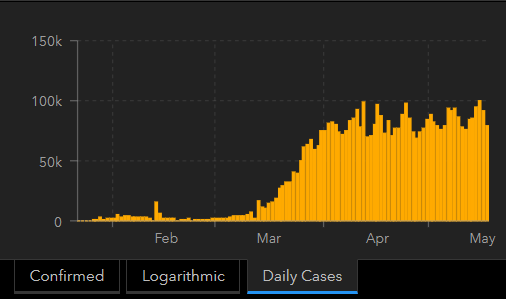
Unfortunately, the worldwide trend in this first wave of COVID-19 cases is not declining (see Figure 8); but, it is a relatively flat curve, as opposed to a highly peaked one, suggesting mitigation and suppression efforts are working on some level.
Figure 8: Worldwide trend in new COVID-19 cases (as of May 18th)
My optimism also grows as we learn more and more about this virus, particularly about potentially controllable drivers of COVID-19 morbidity and mortality.
For example, a recent UK study found levels of Vitamin D in a population may affect how the coronavirus impacts a population.
“Vitamin D levels are severely low in the aging population especially in Spain, Italy and Switzerland. This is also the most vulnerable group of population for COVID-19,” concludes research conducted by Petre Cristian Ilie (The Queen Elizabeth Hospital Foundation Trust, King’s Lynn), Simina Stefanescu (University of East Anglia), and Lee Smith (Anglia Ruskin University). “We believe, that we can advise Vitamin D supplementation to protect against SARS-CoV2 infection.”
When this pandemic is finally over — and it will end, at the minimum when a reliable vaccine is available — epidemiologists will have the time to
What seems less debatable is whether we can control the coronavirus to our liking. That is not going to happen.
Says researchers at the University of Minnesota’s Center for Infectious Disease Research and Policy (CIDRAP) in their latest analysis of the COVID-19 pandemic:
“We must be prepared for at least another 18 to 24 months of significant COVID-19 activity, with hot spots popping up periodically in diverse geographic areas. As the pandemic wanes, it is likely that SARS-CoV-2 will continue to circulate in the human population and will synchronize to a seasonal pattern with diminished severity over time.”
In other words, the coronavirus remains in charge…until a vaccine is widely available.
- K.R.K.
For data and statistical code used in this analysis, send requests to: kroeger98@yahoo.com
