By Kent R. Kroeger (NuQum.com, August 16, 2019)
I don’t blame Bernie Sanders for his crabbiness towards The Washington Post. He cares about his national media coverage as he knows it may be the difference between winning and losing the Democratic Party’s 2020 presidential nomination.
Sanders ignited a firestorm this month when he implied The Washington Post’s less-than-favorable coverage of his 2020 presidential campaign was influenced by the paper’s owner, Jeff Bezos, the founder, president and CEO of Amazon.com, Inc.
Immediate shock, outrage and dismissive eye-rolling animated the press corps.
“(Sanders) said what he said to get a cheap applause line at a town hall packed with supporters. The problem for Sanders, Trump and politics more generally is that many of the people who hear things like this from them don’t know better,” wrote CNN editor-at-large Chris Cillizza. “They actually believe there is some sort of conspiracy between corporate America and the news media. And when politicians — whether they are Sanders, Trump or anyone else in either party — stoke that sentiment, that’s dangerous. And bad for democracy. Full stop.”
“We’ve been tracking press coverage all primary long and Sanders has consistently been at or near the top of the field in terms of the volume of news coverage he’s received,” posted Nate Silver, the editor-in-chief of FiveThirtyEight, on Twitter.
These are the predictable responses one can expect from the national media when someone accuses them of systematic editorial bias.
Sanders, however, was wrong to suggest Jeff Bezos, or anyone connected to corporate Amazon.com, would intervene to impact WaPo editorial decisions. It just doesn’t happen that way.
The common interests of journalists and political elites drive the news media’s coverage of political candidates. They are alone a sufficient condition to power any conspiratorial-looking editorial process dedicated to helping one set of political candidates over others.
It doesn’t require late-night calls using anonymized cell phones or encrypted emails across secured networks. Journalists and politicians simply need a shared motivator to engineer an organic, successful, and legal conspiracy.
Perhaps ‘conspiracy’ is the wrong word for it. It is more like a confederacy built around an informal covenant. Members may not have secret handshakes, but they learn of their shared interests by going to the same schools, living in the same neighborhoods, attending the same parties.
The national news media and the Washington, D.C. political elite belong to the same club — a clique where you need to be invited, of course. Sorry, President Trump, your membership application has been misplaced. And, apparently, the membership renewal forms have been rejected for Hawaii House member Tulsi Gabbard and New York Senator Kirsten Gillibrand. They were once members in good standing. But not now.
The Systematic Bias of the National News Media is Undeniable
Recently, Michael Tauberg, an engineer by day and data journalist at night, published data on the tone of online news coverage for each of the 2020 Democratic presidential candidates from January to April 2019.
Figure 1 (below) shows the average news story sentiment for the major Democratic candidates. South Bend Mayor Pete Buttigieg, New Jersey Senator Cory Booker, former HUD Secretary Julian Castro, former Texas US House member Beto O’Rourke and Minnesota Senator Amy Klobuchar received the most positive news coverage over that period. More interesting are the candidates at the bottom: Gillibrand and Gabbard.
Figure 1: Average Sentiment of Coverage from Liberal News Sources
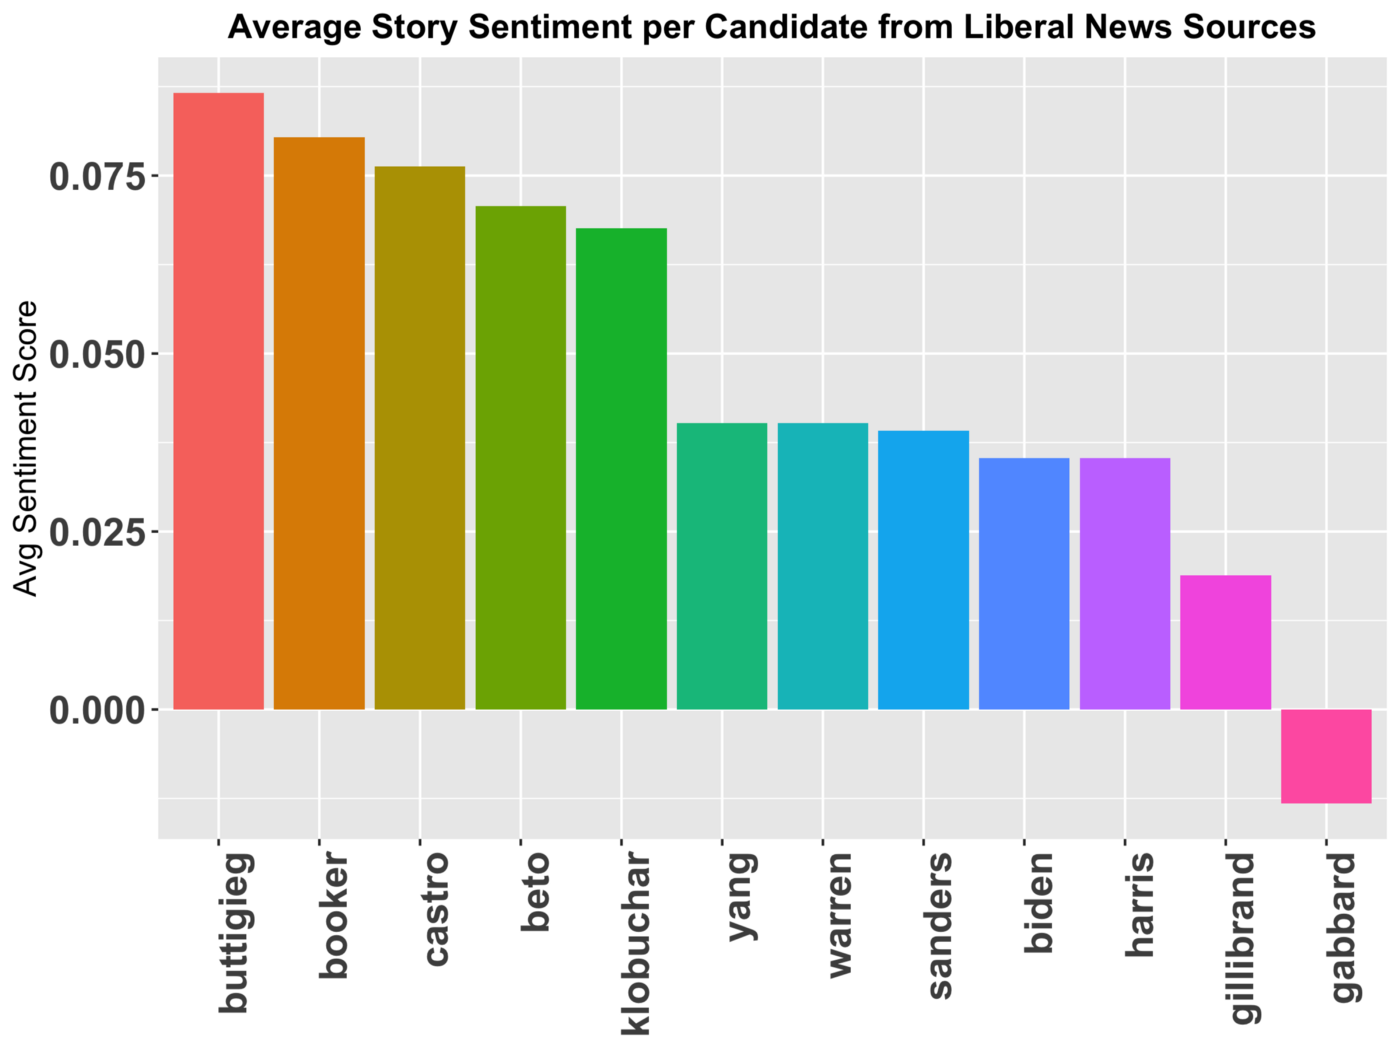
What exactly did Gillibrand and Gabbard do to earn so much negative coverage? Gabbard’s unforgivable offense to the political/media establishment is well documented. Rolling Stone magazine’s Matt Taibbi lays out a few reasons for why the establishment shuns Gabbard. She hates regime change wars and holds the Democratic Party — and the Obama administration, in particular — partially responsible for these never-ending conflicts. Gabbard hits the Democratic Party where it feels most vulnerable to the Republicans: national security issues. The fact Gabbard single-handedly stunted Hillary Clinton’s 2016 campaign momentum in late-February 2016 by resigning from a Democratic National Committee leadership position and endorsed Bernie Sanders did not help her status within the party establishment either.
But what about Gillibrand?
Her heresy is pure political insider stuff. She embarrassed former President Bill Clinton (and his wife) when she suggested Bill should have resigned for having an affair with a young intern.
Responding to Gillibrand’s admonishment, the former president told CBS News: “You have to — really ignore what the context was. But, you know, she’s living in a different context. And she did it for different reasons.”
That was Bill saying Gillibrand said what she said for purely political reasons. In other words, she’s no longer a FOB (Friend of Bill’s). If the Clintons are consistent on anything, it is punishing those who are disloyal; and Gillibrand, who they hand-picked for the New York Senate seat Hillary vacated when she became Secretary of State, has never been welcomed back into the Clinton or party establishment fold.
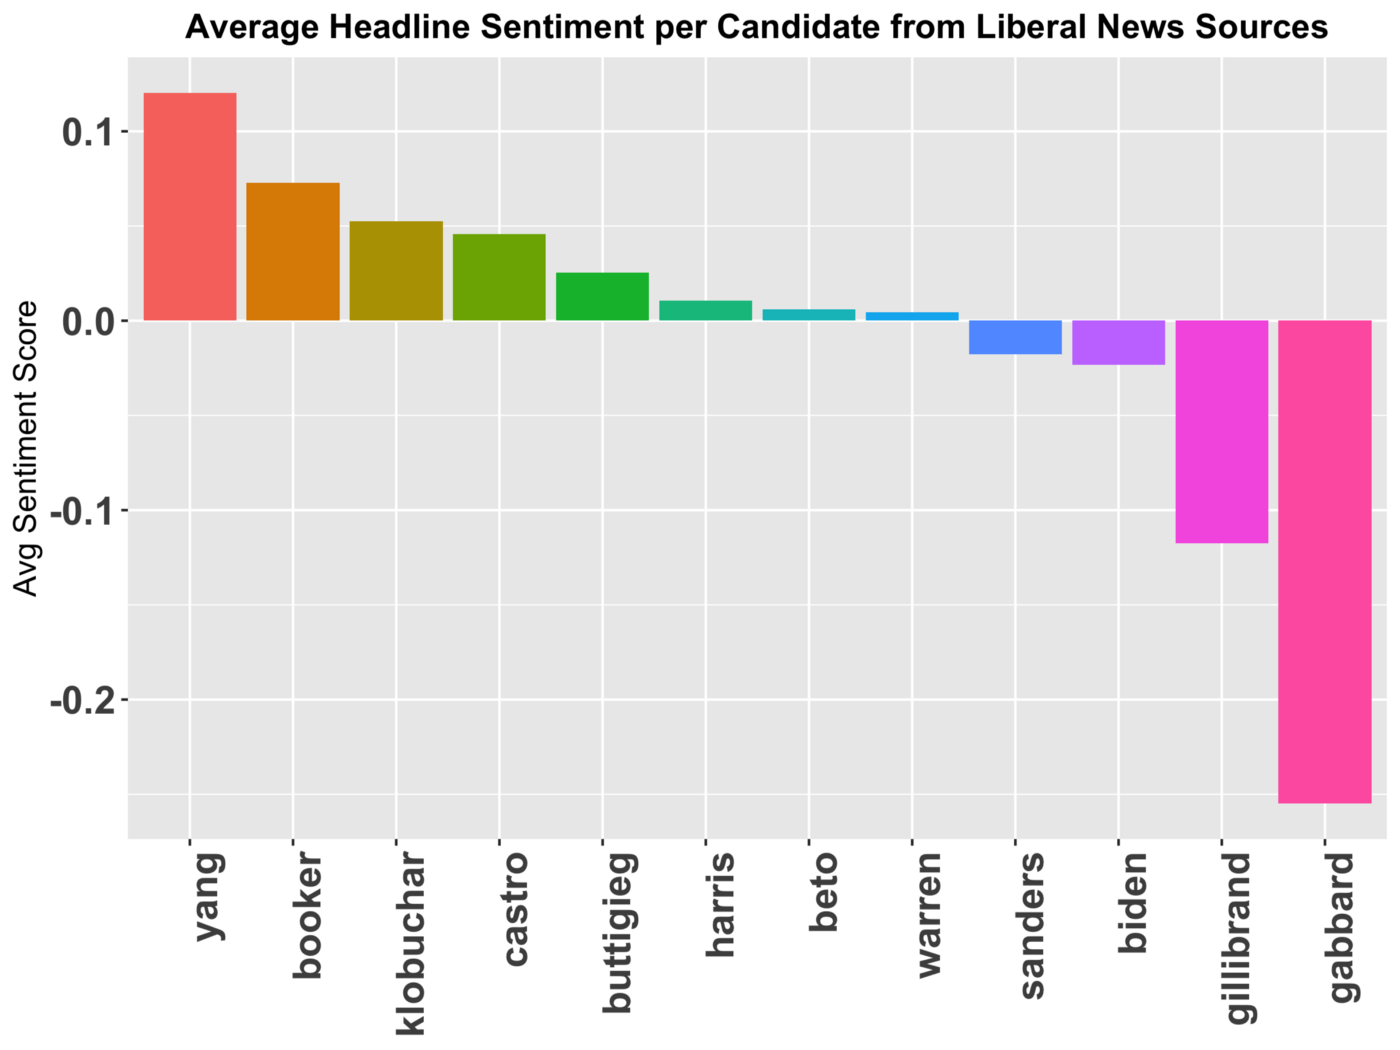
This becomes even more apparent in Tauberg’s analysis of news headline sentiment (see Figure 2). No other 2020 Democratic candidate possesses an average headline sentiment score as strongly negative as the scores for Gabbard and Gillibrand. Their outsider status is quantifiable and it won’t be easy for either to rise within this crowded field of candidates if their media coverage does not turn more positive.
Figure 2: Average Sentiment of Headlines from Liberal News Sources
But do Gabbard and Gillibrand deserve this level of negativity from the national news media? More importantly, who makes that decision? What objective editorial standard is in play that says these two candidates are going to hammered (or ignored) by our news outlet, while this candidate is going to get a far more positive treatment.
All candidates have strengths and weaknesses. Short of a candidacy by someone like David Duke or Richard Spencer, it is seems reasonable that an objective news organization would balance the tone of its coverage for all candidates, even if more popular candidates may get proportionately more coverage than less popular candidates.
But the Tauberg data shows how unbalanced the coverage has been through April with the 2020 Democratic race. The candidate differences in Figures 1 and 2 are not the product of chance — they are the product of an overtly sectarian and discriminatory editorial process.
CNN’s Chris Cillizza and members of the national news media ask us to believe those decisions are based purely on objective considerations by the journalists and editors themselves. The mere suggestion by Sanders that a corporate owner of a newspaper or broadcast news network could impact editorial content is universally mocked by those in the industry.
Responding to another opinion journalist’s criticism of corporate news decisions, MSNBC contributor Jason Johnson asks, “Do you actually think that network and site owners waste their time micromanaging a writer’s opinions? Or is that just some stuff you throw out because it hypes up your fans? I’ve never had anybody, on any outlet I’ve ever worked for even bother.”
There is an answer to Johnson’s first question and it is called ‘self-editing.’ Every writer of import does it — consciously and subconsciously. Writers know what their editors, readers and owners like to read, or at least the successful ones know.
Has Johnson not noticed writers and political analysts sometimes are around one day and gone the next on MSNBC? Has he asked himself why he doesn’t see Krystal Ball around the office as much anymore? [Krystal is now an anchor on The Hill’s TV news podcast Rising with the Hill’s Krystal Ball and Saagar Enjeti — an excellent morning program, by the way.]
The owners of major news outlets don’t micromanage because they hire people to do that. And the most important editorial control is not done at the micro-level anyway, it is done at a macro-level through the hiring and firing decisions by middle and upper management. In just the past twenty years, MSNBC has gone through at least two substantial ideological shifts. It was a mostly non-partisan, straight news organization in the late 1990s, but shifted to the progressive (anti-Fox News) left in the early-2000s with show hosts such as Phil Donahue, Dylan Ratigan, and Ed Schultz, only to turn into an establishment left news organization in the early 2010s with hosts such as Rachel Maddow and Chris Matthews.
Driven more, perhaps, by ratings than any ideological predilection on the part of its ownership, MSNBC is not atypical of other national news outlets. It is a corporate news organization guided by corporate necessities (i.e., advertising revenue and profit). That causal model systematically and inescapably alters the news content, largely in favor of advertiser and corporate interests. Lockheed Martin budgets a lot of advertising dollars each year and they are not going to use their money for underwriting spots on Democracy Now or Redacted Tonight. It just doesn’t work that way.
Changes in cable news coverage can change candidate support — but is it predictable?
Every political campaign I’ve worked on had a candidate and staff that complained incessantly about their campaign’s news coverage. One nasty news story could get a reporter barred from future interviews. But what candidates and campaign managers feared most — more than being on the receiving end of a negative story — was getting ignored by the media. Nothing kills a campaign faster than not being covered. Advertising and door-knocking can help build name recognition and promote a candidate’s core messages, but the credibility and visibility conveyed to a campaign through a national news media filter is irreplaceable — even in the age of social media.
How do we know news media coverage matters? We will need data.
The Data
The following is a very preliminary look at this question regarding news media influence on political candidate support. Using APIs to query a GDELT Project database on daily cable TV news coverage from January 4 to August 6, 2019, and downloading Democratic nomination polling data from RealClearPolitics’ data repository, I conducted a time-series analysis (vector autoregression) to determine whether or not changes in the volume of a candidate’s cable news coverage causes changes in a candidate’s popular support.
Spoiler alert: Changes in the volume of cable news coverage causes changes in candidate popularity, but the effect size is small.
First, let us look a how candidate support has varied since January (Figure 3). Of the five major candidates, they all received a significant popularity bump from the point of their candidacy announcement. In general, the surge in popularity lasted about a month and ranged in magnitude from 15 points for Sanders to 9 points for Buttigieg.
Warren is an outlier in that her popularity rise has been gradual and did not include a steep increase after her February 9th announcement; and, unlike the other four candidates, Warren has not suffered a significant decline from an announcement-related high — in fact, she has gained around 10 points. In contrast, Biden has seen his support decline from around 42 percent down to 30 percent. Sanders, similarly, has lost around 12 points from his March high, Harris 5 points and Buttigieg only about 2 points.
Warren may be the tortoise in a race full of hares.
Figure 3: Democratic Candidate Support since January 4, 2019
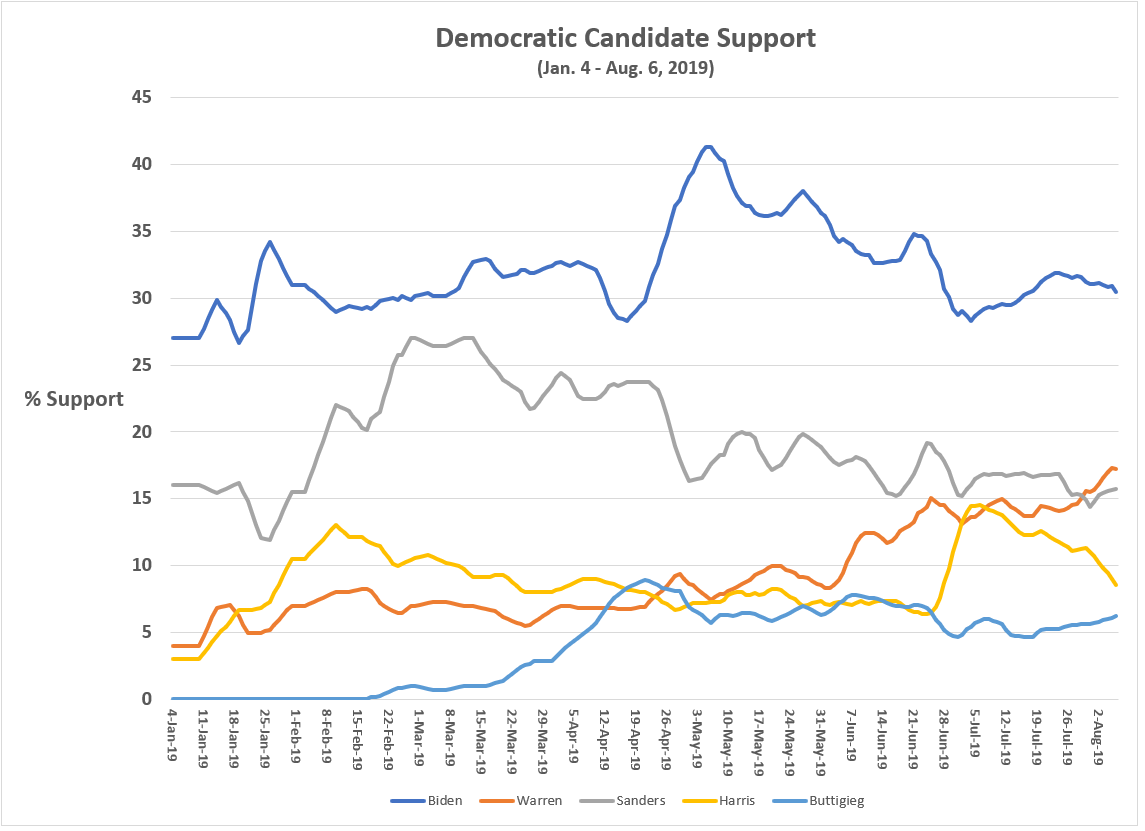
One other notable feature is the 8-point surge Harris experienced after the first debate where she challenged Biden on his position regarding forced busing. However, her lift from that debate has all but evaporated since the second debate when Harris was confronted by Gabbard over Harris’ law enforcement record while the California Attorney General.
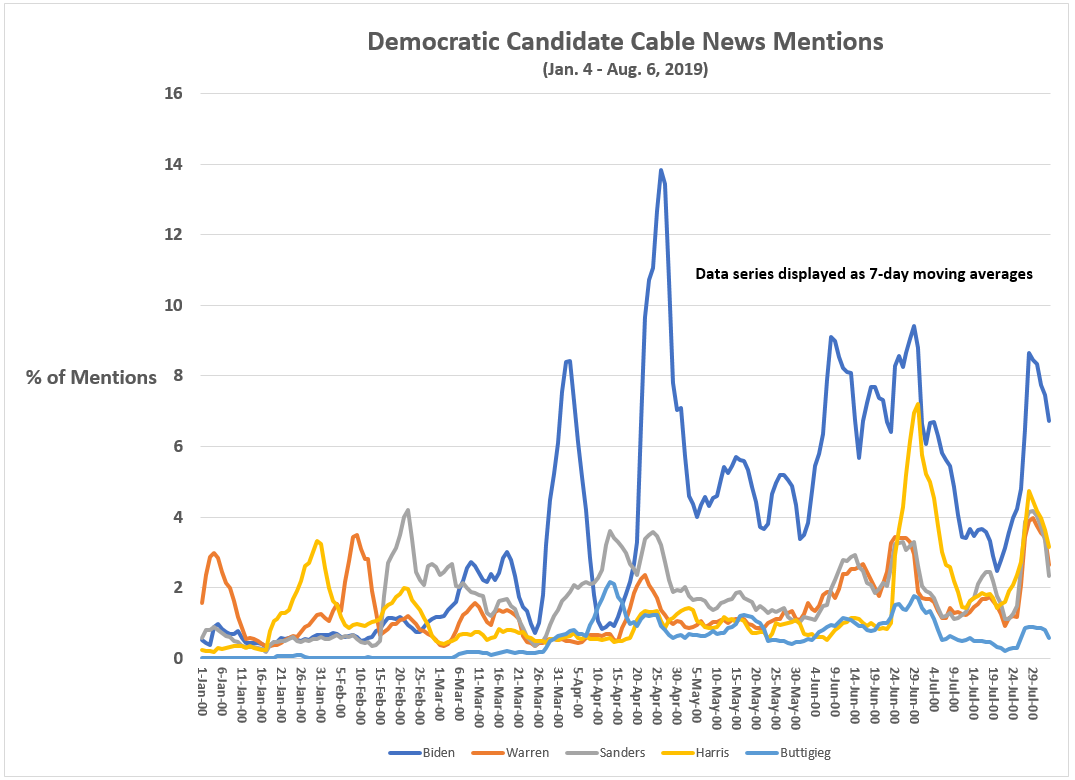
Turning to cable news coverage, there is more day-to-day variation in the volume of coverage for candidates, particularly around specific events such as Biden’s late-April candidacy announcement and around the two debates (see Figure 4). Another interesting feature is how Warren and Sanders mentions, starting in late-May, is now moving in near perfect lock step fashion. The reason for this strong correlation are the two dominant narratives being employed by both MSNBC and CNN during this period: The first focused on whether Warren’s rise is stunting any further rise in Sanders’ support. The second focused on Warren and Sanders defending their progressive policy ideas, particularly on their ability to fund them.
Figure 4: Democratic Candidate Cable News Mentions (as % of all mentions) since January 4, 2019
As yet, I’ve offered no evidence that candidate support and cable news coverage are causally linked. And that causal linkage, if it exists, may be non-recursive and going in both directions — a candidate’s rise in popularity may inspire more news coverage, and a rise in news coverage may increase a candidate’s popularity.
Before formally crunching the numbers, a visual inspection of how cable news coverage moves relative to candidate popularity might be helpful. I’ll focus on Mayor Buttigieg for two reasons: there are clear periods where his popularity and news coverage move together, while other periods where they seem to move in opposite directions (I’ve included charts for all five candidates in the Appendix below, Tables A.1 to A.5).
Figure 5 shows Buttigieg’s dramatic surge in support occurred at the same time as his cable news mentions increased. To only the most hardcore politicalphiles was the name Buttigieg familiar before the 2020 campaign. By the time of his April 14th announcement, he was near his campaign highs in both popularity and cable news coverage. But it is not obvious from Figure 5 if popularity causes news coverage or the other way around (or in both directions).
Figure 5: Buttigieg Support and Cable TV News Mentions
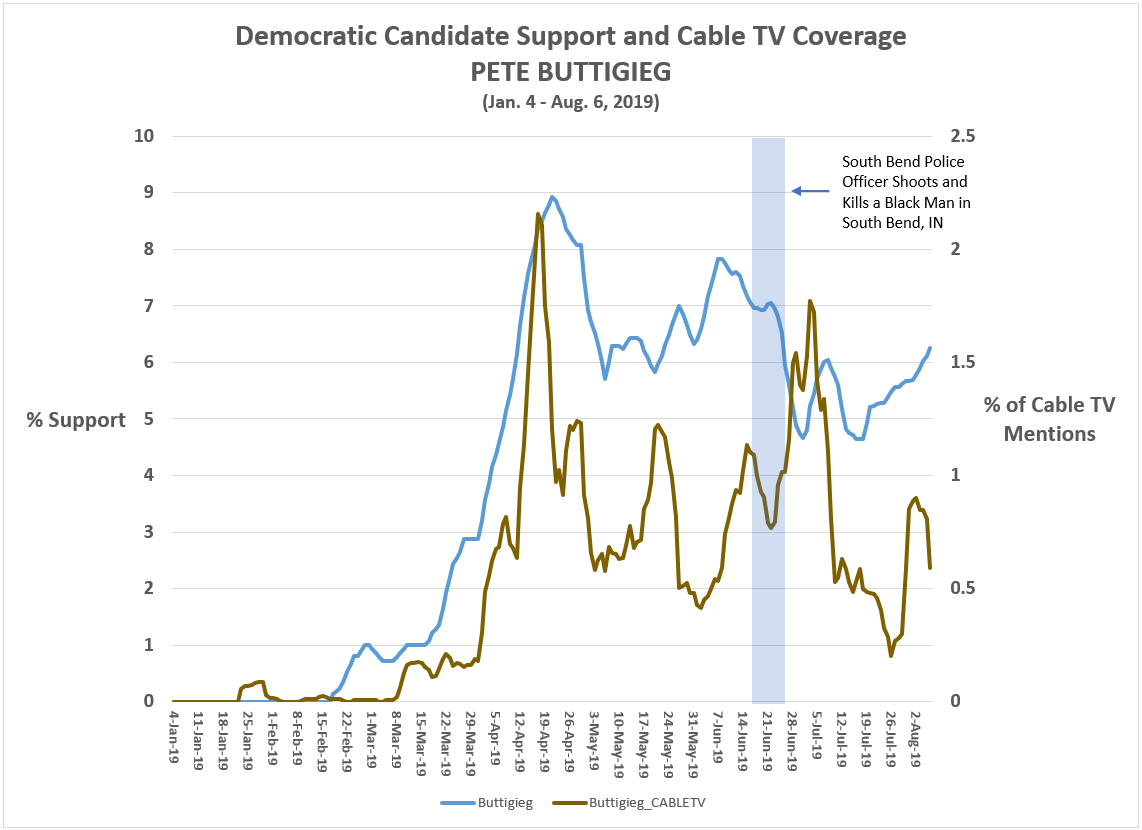
Since his mid-April highs, he has experienced significant declines in both variables, except for a period just after the first debate when his cable news mentions surged a second time. Another important period is between June 20th to 30th when Buttigieg’s cable mentions rose steeply even as his popularity was in steep decline. The negative turn was most likely a product of his city, South Bend, dealing with a June 14th police shooting where a Black man had been killed by a white police officer. Buttigieg’s appearance before a public hearing on the incident did not go well, according to many observers.
What this episode demonstrates is that any model of support and news coverage may require an interaction term or independent variable measuring the tone of coverage. Unfortunately, I am still working on generating a sentiment analysis of cable news stories for inclusion in a future analysis.
With that methodological caveat, any causal relationship I might find between popularity and news coverage here is likely going to be an underestimate of the true relationship. Research is, after all, an iterative process.
Feel free to skip to ‘The Results’ section if you don’t want the details on the statistical methodology.
The Statistical Method
Noble Prize winner in economics, Clive Granger, defines a relationship between two variables as causal (X1 Granger-causes X2) if prior changes in X1 predict future changes in X2, independent of past values in X2 and while controlling for other potential causal factors.
A common statistical method for testing for Granger-causality is vector autoregression (VAR). The beauty (and limitation) of this technique is that it makes few assumptions about the causal relationships between variables. Hence, these models often devolve into ‘everything but the kitchen sink’ specifications that eat up degrees of freedom (which are typically precious, particularly for the analysis here which has only 215 cases to work with).
Due to these issues, it is often recommended that VAR models be employed during the initial model and theory-building stages and that more explicit, theoretically-informed statistical models be used in the final analytic stages (e.g., dynamic Bayesian networks).
For my purposes, VAR is more than adequate to uncover the basic causal relationship between news coverage and candidate popularity.
Model Specification
The VAR models estimated here for popularity (Y) and volume of news coverage (X) specify a p-order = 7, which means the ten models (two models for each candidate) looks back 7 days to assess the relationship between Y and X. All variables were measured at the daily level and smoothed using a 7-day moving average. The variables were also differenced in order to meet VAR’s stationarity requirement. This means we are, in fact, testing whether changes in X cause changes in Y and vice versa.
The raw data, SAS code, APIs, model parameter estimates, and VAR diagnostic charts are available for download at: https://github.com/Nuqum/NuQumStuff
The Results
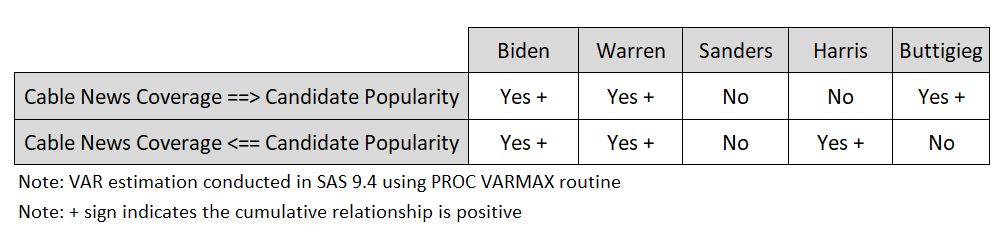
The bottom line up front: For three of the five candidates (see Figure 6), increases in their volume of cable news coverage caused small but significant increases in candidate popularity. Also, for three of the five candidates, increases in candidate popularity caused small but significant increases in the volume of their cable news coverage.
Figure 6: Summary Table of VAR Model Estimations
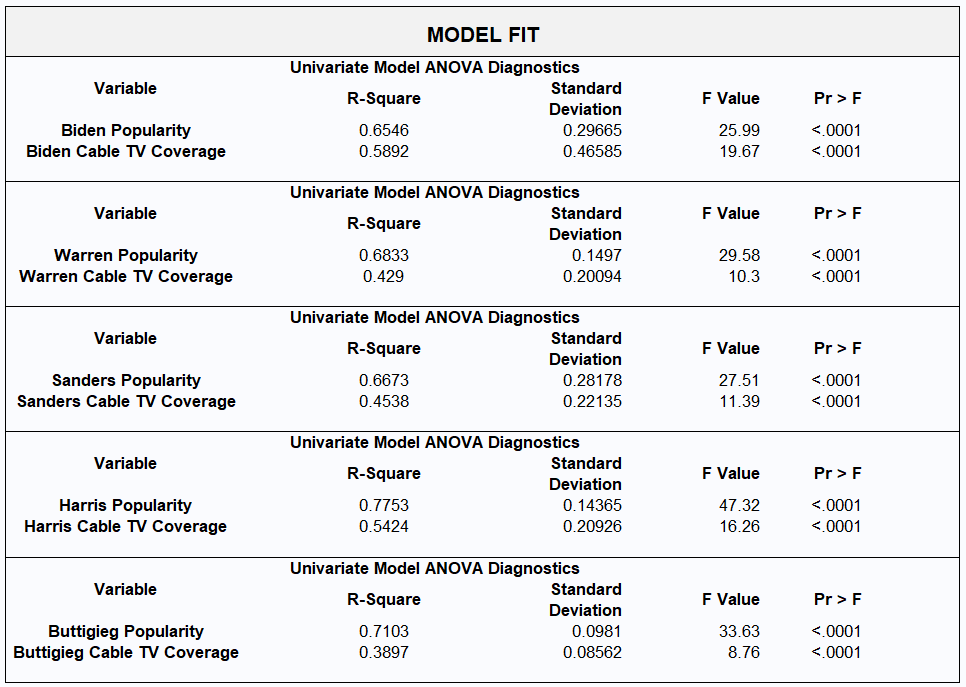
Using Buttigieg again as our highlighted case, the VAR model predicting popularity has a model fit of R-squared = 0.71, compared to an R-squared = 0.39 for the news coverage model. This general pattern is consistent for all five candidates. However, not shown in Figure 7, the inclusion of news coverage volume added very little new information in explaining candidate popularity, as the R-square for all models only fell by 2 to 4 percentage points when news coverage was excluded from the model. This gives me great pause in suggesting news coverage is a dominant predictor of candidate support. Visually, we can see the some causal relationship is there, but, statistically, it still looks like just one actor in a much larger drama.
Figure 7: Summary of VAR Model Fits
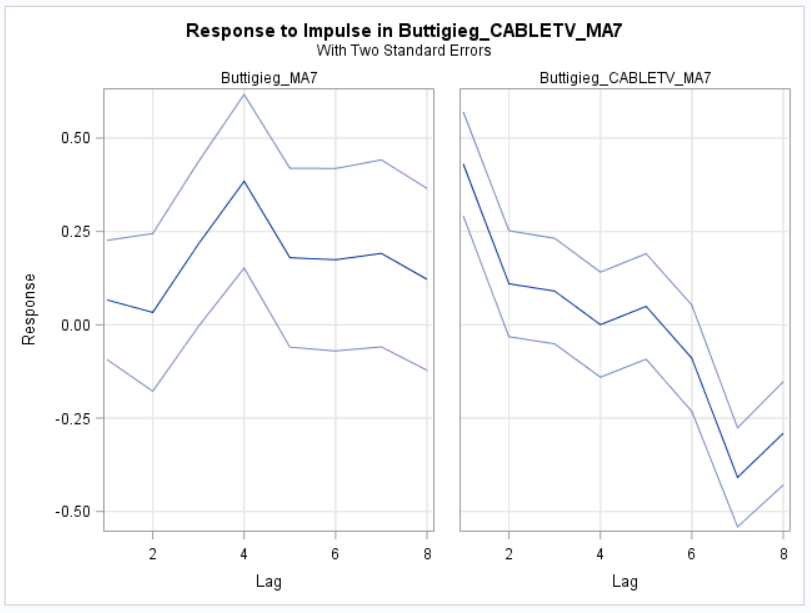
One of the most informative outputs generated from a VAR model is what is called an Impulse Response Function (IRF) graph. An IRF describes the changes in the dependent variable along a specified time horizon after a one-unit shock in the independent variable. Both variables — candidate popularity and cable news mentions — are measured as percentages and theoretically range from 0 to 100 (variable summary statistics can be found in this project’s Github depository as part of the VAR output).
Buttigieg will once more be our exemplar.
Figure 8 indicates that a one percentage-point increase (shock) in cable news mentions of Buttigieg leads to a 0.40 percent increase in his popularity four days after later. No other lag parameters are significant in the Buttigieg model (that is, the confidence intervals include zero). That change in popularity might not seem like a game-changer, but cumulatively that translates into a nearly 1.5 percentage-point increase in popularity over 8 days. For a candidate whose support drifts between 4 and 9 percentage points, that is significant shift.
Figure 8: Impulse Response Function: 1-unit Shock in Cable News Coverage and Changes to Candidate Popularity over 8-day period (Buttigieg)
Yet, without a measure of the tone of a candidate’s news coverage, the true dynamic between news coverage and candidate popularity is probably under-stated in the analysis here. As Buttigieg’s case makes clear, there are times when even a popular candidate with the news media will need to weather negative news coverage that will hurt his or her standing in the polls. That dynamic must be directly modelled.
My next step will be in further developing and capturing a tone/sentiment measure for news coverage. Presumably, this will significantly improve the model of candidate popularity.
Final Thoughts
Perhaps the most interesting candidates in this analysis are Bernie Sanders and Kamala Harris. There was little evidence of any causal relationship between their volume of cable news coverage and their popularity. It doesn’t surprise me that Sanders doesn’t even get a meager lift anymore from positive news coverage. It does surprise me that Kamala doesn’t. Just a visual inspection of the relationship between her popularity and her cable news mentions reveals what appears to be a strong (positive) relationship between the two (Figure 9).
Figure 9: Candidate Support and Cable TV Coverage (Harris)
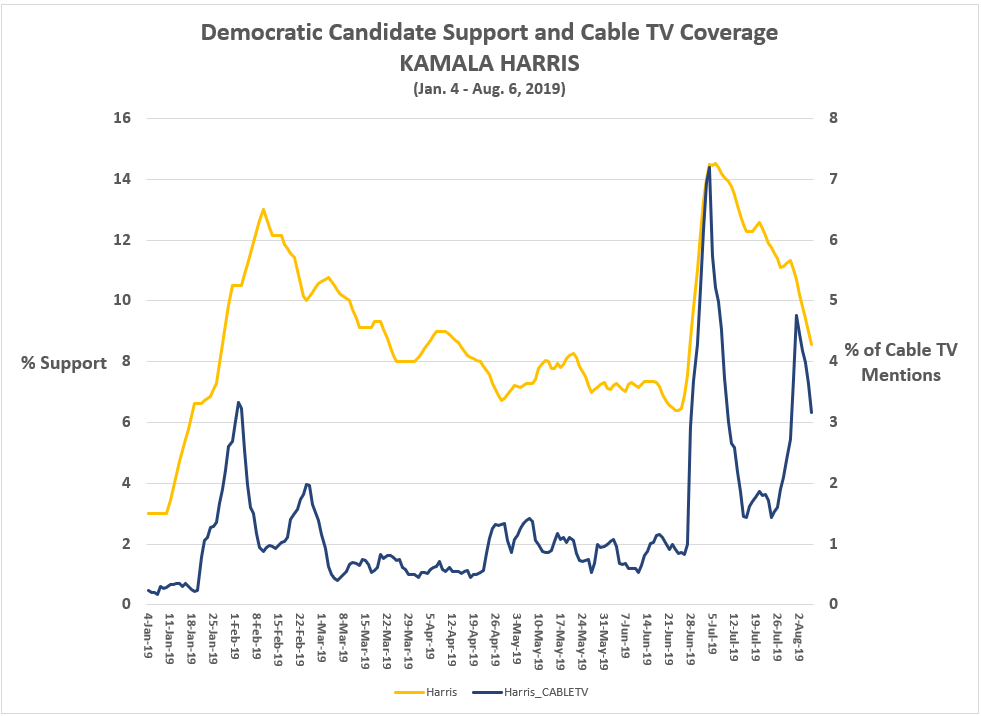
Harris has three major spikes in cable TV news mentions. The first occurred soon after her candidacy announcement on January 21st — which was mapped closely by a surge in support. One interesting feature of this first surge is that the support level peaked about one week after the peak in cable news mentions. Buttigieg’s chart showed a similar dynamic (see Figure 5 above). Harris’ second cable news mention surge occurred after her first debate performance and was, again, mapped closely by a popularity surge. What is different from the first surge is that the peaks of both mentions and popularity occurred contemporaneously — most likely because the debate was widely watched on television and its impact on popularity more immediate.
Harris’ third cable news mention surge occurred after the second debate but did not witness the simultaneous positive movement in popularity, the reason fairly obvious — the second debate was not a good performance by Harris.
Looking at the charts for all of the major candidates (Figures A.1 to A.5 in the Appendix) makes one thing clear — the dynamics between cable news coverage and candidate popularity varies by candidate and can change over time within each candidacy. Campaign events (e.g., debates), gaffes (Biden is one of the candidates after all), and random shocks (e.g., the economy, mass shootings, the border crisis, the Middle East conflicts, etc.) add a level of randomness and unpredictability that no statistical model, no matter how well specified, can fully anticipate.
This preliminary look at the common daily variations in cable news coverage and candidate popularity — a two-variable model — does not come close to capturing the full complexity of a real world presidential campaign. There are many other factors in a campaign that affect candidate popularity: endorsements, advertising, social media, online news, Google searches, campaign rallies, retail politicking, etc.
We want to believe the news media, as one of the primary gatekeepers through which campaigns try to get information to the general public, is as powerful as the news media itself assumes. No doubt, the struggle of Tulsi Gabbard and Kirsten Gillibrand to get their messages to the voting public is hindered by systematic negative news coverage (or, worse, no news coverage at all). The Tauberg news sentiment data supports the contention that the national news media systematically favors some candidates over others and can crush (or lift) small, outsider campaigns if they so choose.
The news media will argue that is part of their job. If they don’t do it, who will? Voters can’t digest 21 different candidates. The field needs to be whittled down to a more manageable number and the news media is more than happy to provide that service.
“Somewhere, somehow, professional journalists have to decide who gets covered — and any formula they could choose is going to appear biased to someone,” says Columbia University journalism professor Jonathan Stray. “In the end, the candidates who attack the media are right about one thing: The press is a political player in its own right. There’s just no way to avoid that when attention is valuable.”
But the question remains, is the corporate news media an unbiased, neutral party in this process or does it play favorites? Bernie chooses the latter conclusion. I lean that way as well, but I am still surprised at how sketchy the data remains showing a strong causal arrow from the national news networks to candidate popularity.
- K.R.K.
Comments and requests can be sent to: kroeger98@yahoo.com
All raw data, SQL commands, and SAS codes for this essay can be downloaded at: https://github.com/Nuqum/NuQumStuff
APPENDIX: Additional Graphs
Figure A.1: Candidate Support and Cable TV Coverage (Biden)
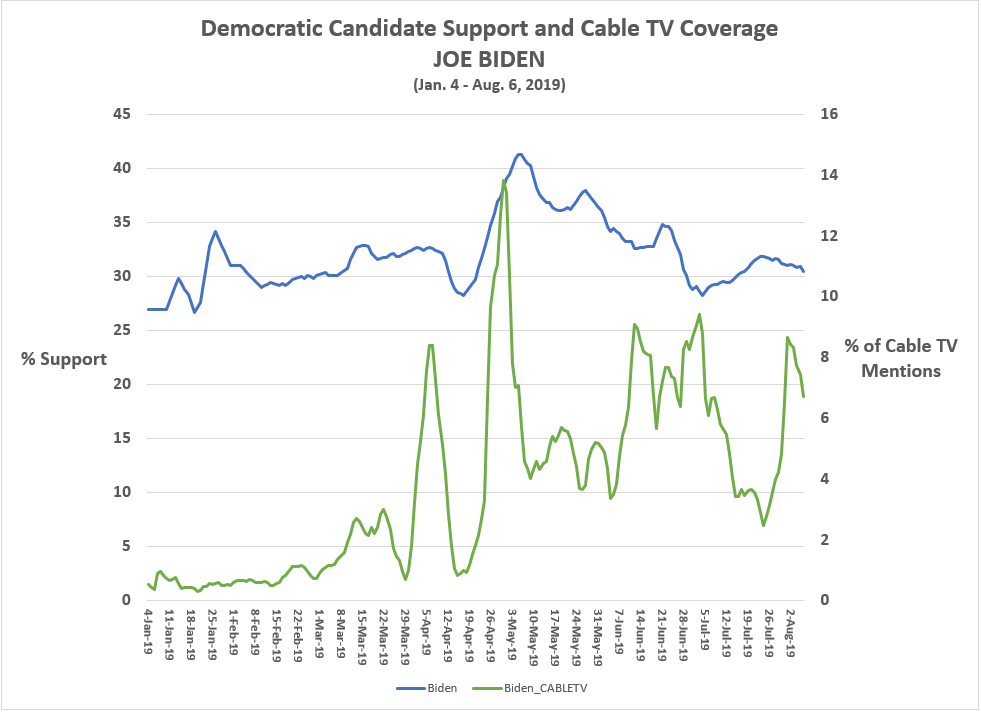
Figure A.2: Candidate Support and Cable TV Coverage (Warren)
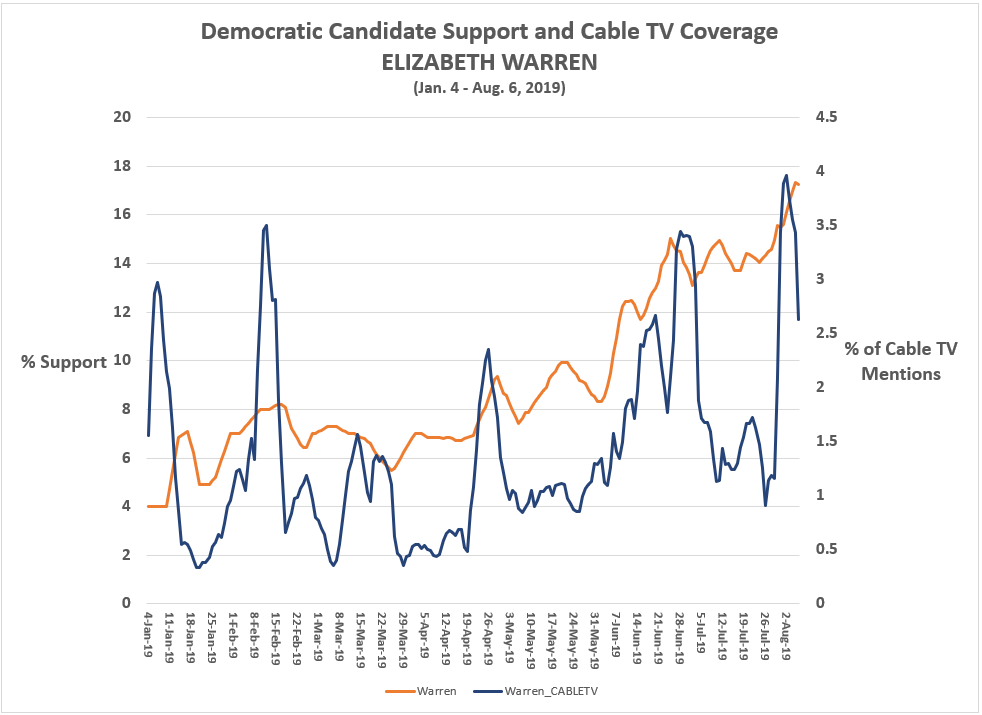
Figure A.3: Candidate Support and Cable TV Coverage (Sanders)
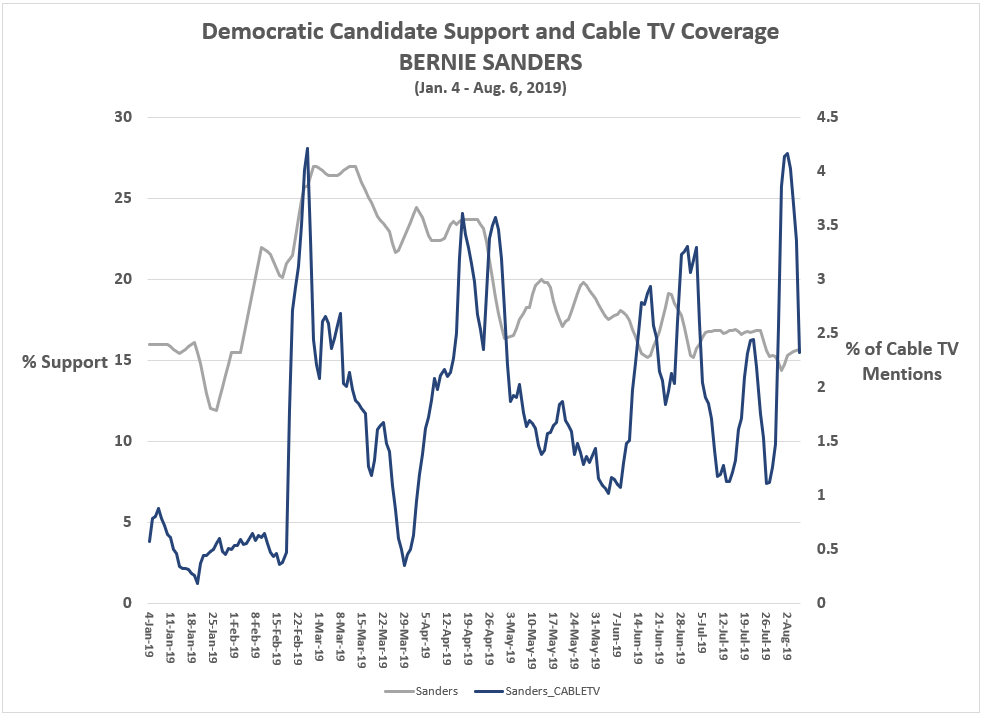
Figure A.4: Candidate Support and Cable TV Coverage (Harris)
Figure A.5: Candidate Support and Cable TV Coverage (Buttigieg)
Figure B.1: Impulse Response Function: 1-unit Shock in Cable News Coverage and Changes to Candidate Popularity over 8-day period (Biden)
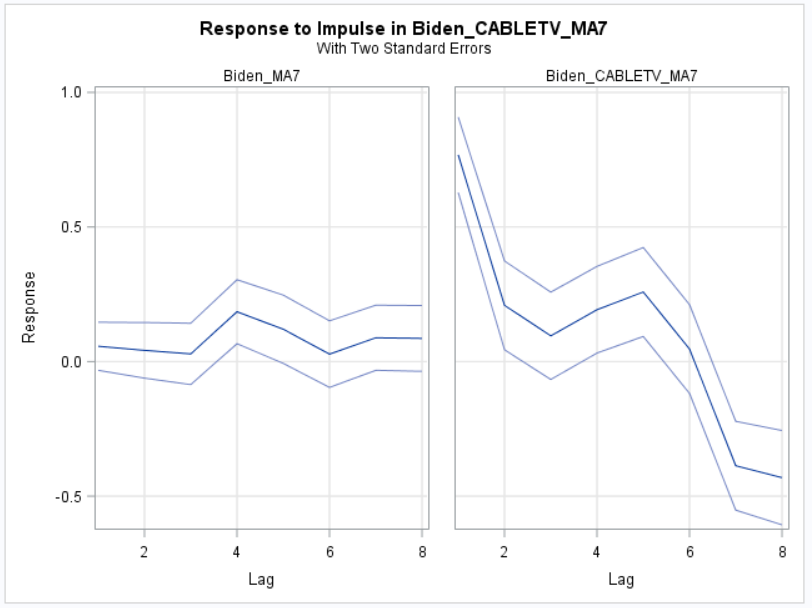
Figure B.2: Impulse Response Function: 1-unit Shock in Cable News Coverage and Changes to Candidate Popularity over 8-day period (Warren)
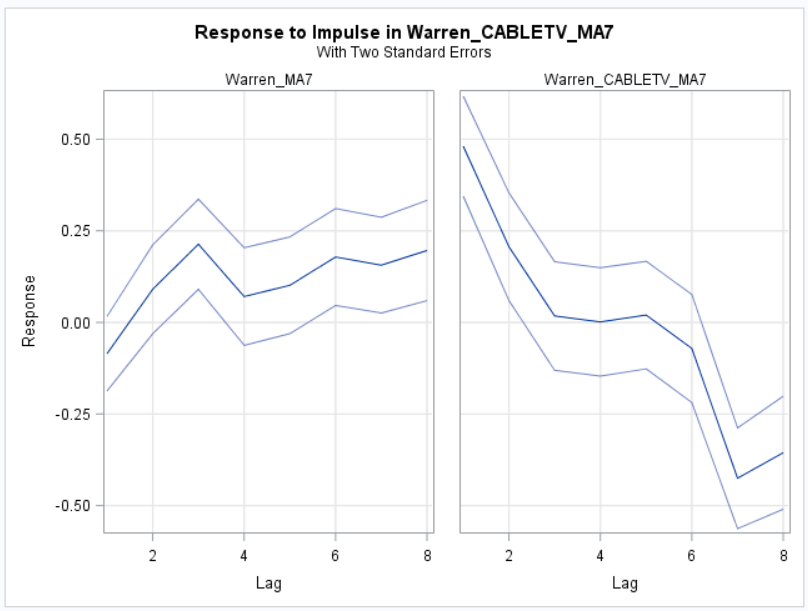
Figure B.3: Impulse Response Function: 1-unit Shock in Cable News Coverage and Changes to Candidate Popularity over 8-day period (Sanders)
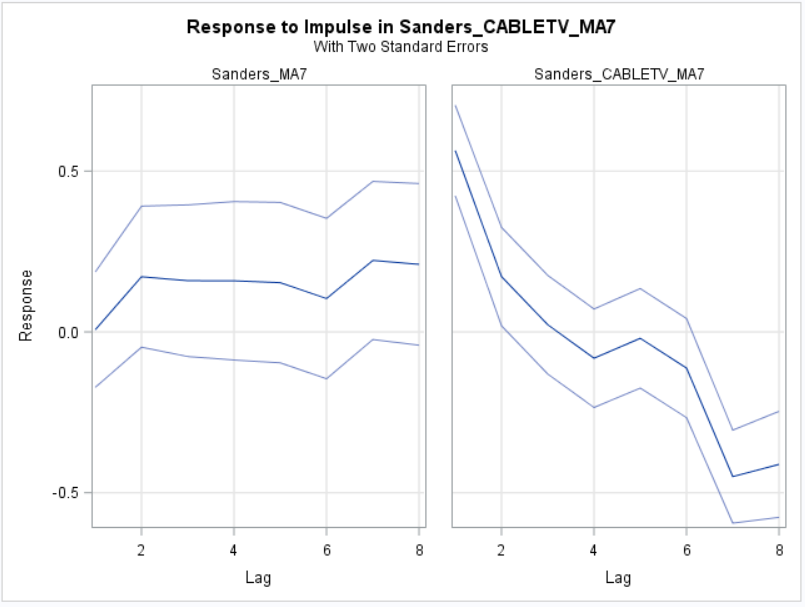
Figure B.4: Impulse Response Function: 1-unit Shock in Cable News Coverage and Changes to Candidate Popularity over 8-day period (Harris)
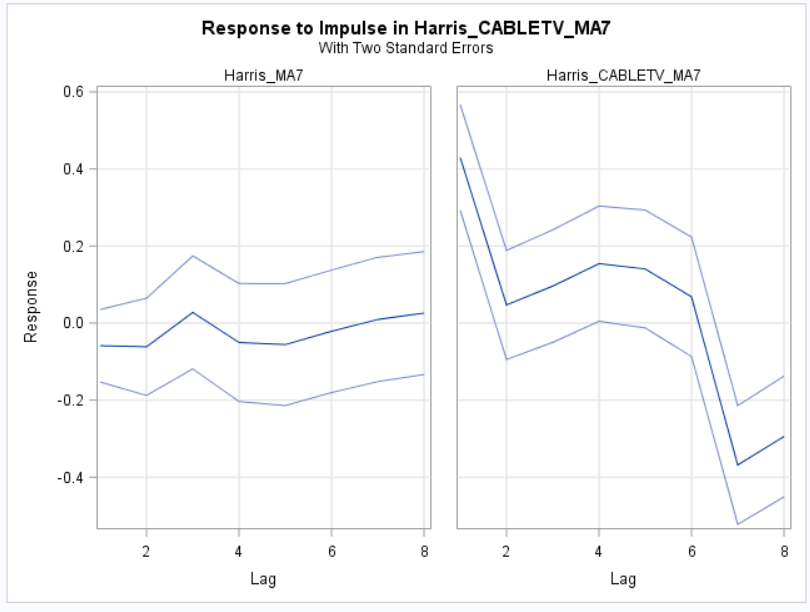
Figure B.5: Impulse Response Function: 1-unit Shock in Cable News Coverage and Changes to Candidate Popularity over 8-day period (Buttigieg)