By Kent R. Kroeger (Source: NuQum.com; March 31, 2021)

If there is one thing politicians like to do, it is to brag about their uncanny foresight and leadership skills. Unsurprisingly, the coronavirus pandemic has exposed many of them as far less capable than how they present themselves.
And no politician has been exposed more by this pandemic than New York Governor Andrew Cuomo, who published a book in October 2020 (“American Crisis” — which is no longer being promoted by its publisher) about his “heroic “efforts to stop COVID-19.
The problem with Cuomo’s self-promotion effort was that the pandemic was far from over in his state when he wrote the book; and, more importantly, he failed to mention one of the titanic policy failures of his COVID-19 containment efforts (i.e., nursing home deaths).
But Cuomo is far from alone in premature braggadociousness. In her Conservative Political Action Conference (CPAC) speech in February, South Dakota Governor Kristi Noem offered this assessment of her state’s coronavirus response:
“South Dakota is the only state in America that never ordered a single business or church to close. We never instituted a shelter in place order. We never mandated that people wear masks. We never even defined what an essential business is, because I don’t believe that governors have the authority to tell you that your business isn’t essential.”
What Noem left out of her COVID-19 policy analysis is that her small, low population density state has the 8th highest COVID-19 death rate in the country (2,179 per 1 million people) and the highest among states of similar population density and demographics (see Figure 1a).
Figure 1a: States with most COVID-19 deaths (per 1 million people, as of March 25, 2021)

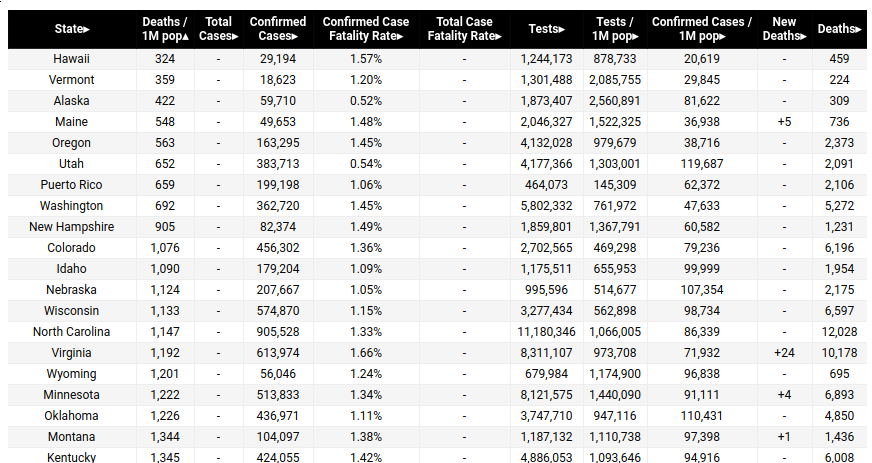
Figure 1b: States with fewest COVID-19 deaths (per 1 million people)
It is easy to respect Noem’s concern for keeping her state’s economy open during the COVID-19 crisis. As she put it:
“Even in a pandemic, public health policy needs to take into account people’s economic and social well being. Daily needs still need to be met. People need to keep a roof over their heads. They need to feed their families. And they still need purpose. They need their dignity. Now my administration resisted the call for virus control at the expense of everything else. We looked at the science, the data and the facts, and then we took a balanced approach.”
To her credit, South Dakota’s GDP contracted only -1.7 percent in 2020 (a preliminary estimate from the U.S. Bureau of Economic Analysis), compared to a national GDP decline of -3.5 percent and she correctly notes South Dakota’s nation-best unemployment rate. But…
…this economic stability came with a significant human cost.
Could South Dakota have done better against COVID-19 while keeping its economy stable? This question is raised in Figure 2 (below) where all 50 U.S. states (and the District of Columbia) are plotted based on their 2020 GDP growth and COVID-19 death rates (as of March 25, 2021). The chart is divided into four quadrants: (A) states with above average GDP growth and low COVID-19 death rates, (B) states with below average GDP growth and below low COVID-19 death rates, (C) states with above average GDP growth and high COVID-19 death rates, and (D) states with below average GDP growth and high COVID-19 death rates.
South Dakota resides in Quadrant C (above average GDP growth but a high COVID-19 death rate). In comparison, South Dakota’s southern neighbor, Nebraska (in Quadrant A), was able to minimize the economic consequences of COVID-19 while also keeping its COVID-19 death rate relatively low.
Figure 2: GDP Growth and COVID-19 Death Rates
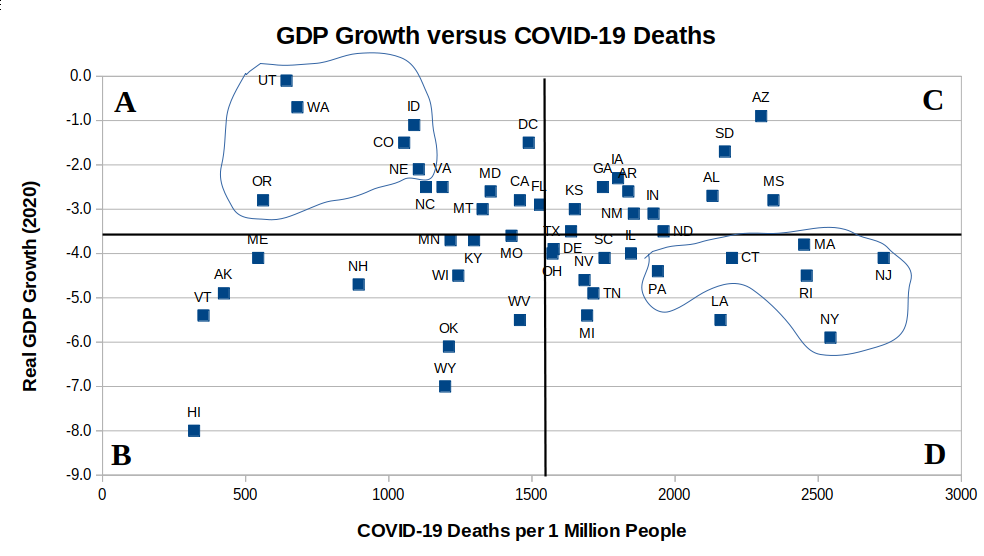
Hopefully, we can agree being in Quadrant A is better than being in Quadrant D. To that point, if GDP growth and COVID-19 death rates are our key performance metrics, Utah and Washington did substantially better during the pandemic than New York, New Jersey, Rhode Island or Louisiana.
One interesting outlier is Hawaii, which, so far, has experienced the lowest COVID-19 death rate (324 per 1 million) along with the worst economic performance (a -8.0 percent decline in 2020 GDP). Hawaii’s poor economic performance is easily attributed to its high dependence on tourism for economic growth, which has largely been shutdown since the start of the pandemic; but, it should be noted that another tourism-dependent state, Florida, has had substantially better economic performance than Hawaii (-2.9 percent versus -8.0 percent GDP growth). Granted, it is much easier to drive to Florida than it is to fly or sail to Hawaii.
Also, there appears to be some geographic clustering in Figure 2. For example, the best performing states in Quadrant A are mostly from the Pacific Northwest and Rocky Mountain states (Utah, Washington, Oregon, Idaho, and Colorado), while the worst performing states in Quadrant D are largely from the Northeast and Mid-Atlantic states (New York, Connecticut, Massachusetts, New Jersey, Rhode Island and Pennsylvania).
Figure 2 begs these questions: To what extent are these differences in economic growth and COVID-19 death rates attributable to specific state-level policies? And to what extent are these differences driven by factors outside the control of the political realm, such as a state’s geographic location?
No party has had a monopoly on wisdom during the pandemic
In order to have a meaningful discussion about COVID-19 and public policy, one must first purge themselves of the biased partisan narratives — oppressive-state versus anti-science-risk-takers — that drive the current political debate and, instead, focus on the facts.
For starters, is there any substance to the common assumption in the national media that Red (Republican-dominated) states have performed worse than Blue (Democrat-dominated)statesor Purple (i.e., battleground) states (see Appendix to see how each state is classified in this analysis)?
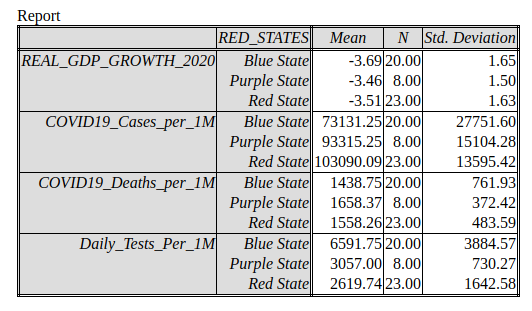
Figure 3a shows that a state’s partisan predisposition does relate to its COVID-19 outcomes. Red states have had slightly better GDP growth than Blue states during the pandemic (-3.51 percent versus -3.69 percent, respectively), while Blue states have done significantly better than Red states in controlling the spread of COVID-19 (73,131 cases per 1 million people versus 103,090 cases per 1 million people) and marginally better in mitigating its mortality outcomes (1,439 deaths per 1 million people versus 1,558 deaths per 1 million people).
Figure 3a: COVID-19 outcomes by Blue/Purple/Red state status
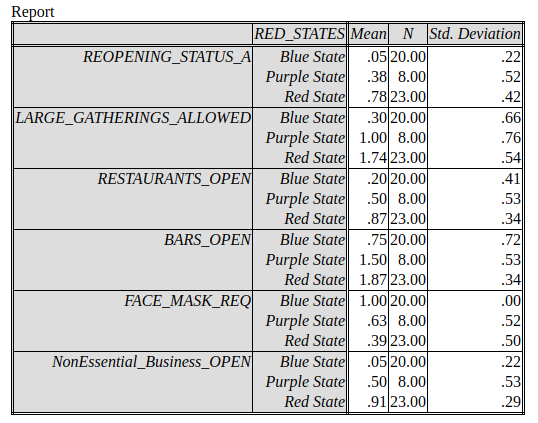
And are these outcome differences associated with state-level policy differences? Figure 3b shows that the Blue/Purple/Red state distinction does, in fact, relate to COVID-19 policy differences. For example, 87 percent of Red states currently allow restaurants to be open, compared to only 50 percent of Purple states and just 20 percent of Blue states. The most striking policy difference, however, is in whether to allow ‘non-essential’ businesses to be open. Currently, only 5 percent of Blue states allow non-essential businesses to be open, compared to 50 percent of Purple states and 91 percent of Red states.
Figure 3b: Current COVID-19 policiesby Blue/Purple/Red state status
Can we attribute these policy differences to the better COVID-19 outcomes and worse economic growth in Blue states? Probably not, considering the COVID-19 outcomes are only marginally better and economic growth rates only slightly worse for the Blue states.
As Figure 2 demonstrates, when economic growth is considered together with COVID-19 outcomes, neither political party has a monopoly on policy wisdom. Almost as many Red states (Idaho, Utah, Nebraska, and Montana) are in Quadrant A as there are Blue states (California, Colorado, D.C., Maryland, Oregon, Washington and Virginia) or Purple states (Florida and North Carolina).
Which state did better? California or Florida
One of the biggest mistakes made in state-level policy analyses is that too much weight is put on small (dare I say, inconsequential) states. Why should the policies and outcomes in a state like South Dakota be put on an equal footing with a state like New York or California? Small population states undoubtedly have advantages in implementing some statewide public policies and perhaps inherent disadvantages in other instances. Small states can make for nice case studies, but are dangerous to generalize from if you are more interested in public policies nationwide.
This is why I find the comparison of COVID policies and outcomes between California and Florida to be informative. Both are large population, coastal states with relatively diverse populations and economies (though Florida is somewhat more dependent than California on tourism — which is an economic sector particularly hard hit by the worldwide pandemic).
Florida Governor Ron DeSantis has been a hot media item lately as he touts his state’s COVID-19 response, and a number of prominent media outlets have happily climbed on board his PR train. Among them, Politico, heaped this praise on DeSantis’ COVID-19 policies:
“The most controversial policies DeSantis enacted — locking down later and opening up earlier, keeping nursing homes closed to visitation while insisting schools needed to be open to students, resisting intense pressure to issue a mask mandate — have ended up being, on balance, short of or even the opposite of ruinous.”
The AP’s David Lieb recently offered this comparative insight:
“Despite their differing approaches, California and Florida have experienced almost identical outcomes in COVID-19 case rates.”
If true, why is California Governor Gavin Newsom the one facing a serious recall challenge, while DeSantis is being presented as a serious contender to be our next president?
The first answer is: Life, particularly politics, isn’t always fair. But a better answer perhaps lies in the difficulty in comparing one state to another.
On the surface, their COVID-19 and economic numbers are quite similar:
Florida: 94,665 cases per 1M / 1,543 deaths per 1M / -2.9% GDP Growth
California: 92,555 cases per 1M / 1,475 deaths per 1M / -2.8% GDP Growth
As for their COVID-19 policies, their decisions could not have been more different. California shutdown businesses and schools early in the pandemic and has yet to substantially reopen; whereas, Florida locked down late, fully opened schools for the Fall 2020 term, started late-phase business reopening in September 2020, and has never issued a mask requirement.
It would be easy to conclude that COVID-19 policies are ineffective based on Florida and California’s COVID-19 numbers, but don’t be too hasty.
Some thoughtful people are arguing that California has done much better than Florida, despite having similar numbers.
One of my favorite business writers, Los Angeles Times’ Michael Hiltzik (who, along with Chuck Philips, wrote a series of Pulitzer Prize winning articles in 1999 exposing the entertainment industry’s deep level of corruption), is one of those people. He recently wrote a column challenging DeSantis, who some consider a front runner for the 2024 Republican presidential nomination, for prematurely and inaccurately praising Florida’s COVID-19 response over California’s.
“Florida hasn’t done better than California despite different policies — in the parts of each state that resemble each other demographically, the challenge is similar, and so is the weaponry. And when you put it all together, Florida still does worse overall than California.”
Hiltzik further chides DeSantis for carelessly “exporting” the SARS-CoV-2 virus (which causes COVID-19):
“Researchers at the Federal Reserve Bank of New York and Ball State University found that COVID case rates in counties with universities that scheduled breaks early in the spring last year rose within a week of students returning to campus, compared to rates in counties with few college students. Mortality rates began to rise in those locations three to five weeks after students returned, suggesting that students transmitted their infections to higher-risk (that is, older) people.”
But Hiltzik’s saves his best point for last:
“It’s important to recognize that a state’s success or failure in combating COVID-19 depends on a multitude of factors, many of which are outside a governor’s control (my emphasis). Those who claim credit for good-looking statistics may be setting themselves up for a boatload of blame if the numbers turn ugly.”
I am reminded of Hiltzik’s warning as the U.S. sits at the brink of possibly a fourth COVID-19 wave. Beware of any party or politician making grand declarations of success (or failure) against the disease. The final results remain a work-in-progress and the virus itself doesn’t care which party wins the policy debate.
- K.R.K.
Send comments to: nuqum@protonmail.com
Appendix
Blue States: California, Colorado, Connecticut, Delaware, D.C., Hawaii, Illinois, Maine, Maryland, Massachusetts, Minnesota, New Hampshire, New Jersey, New Mexico, New York, Oregon, Rhode Island, Vermont, Virginia, Washington
Purple States: Arizona, Florida, Georgia, Michigan, Nevada, North Carolina, Pennsylvania, Wisconsin
Red States: Alabama, Alaska, Arkansas, Idaho, Indiana, Iowa, Kansas, Kentucky, Louisiana, Missouri, Mississippi, Montana, Nebraska, North Dakota, Ohio, Oklahoma, South Carolina, South Dakota, Tennessee, Texas, Utah, West Virginia, Wyoming