__________________________________________________________________
This is the fifth essay in a series dedicated to analyzing the U.S. eligible-voter population using the 2018 American National Election Study (ANES), an online survey administered in Dec. 2018 by researchers from the Univ. of Michigan & Stanford Univ.
__________________________________________________________________
By Kent R. Kroeger (Source: NuQum.com; April 5, 2019)
Nothing makes a Democrat happier than describing the ‘average’ conservative Republican:
“The Republican base is now made up of religious and neoconservative ideologues, and the uneducated white underclass with a token person of color or two up front on TV to obscure the all-white, all-reactionary, all-backward, ‘there-is-no-global-warming’ rube reality. Actual conservatives, let alone the educated classes, have long since fled,” says author and filmmaker Frank Schaeffer, a conservative Christian in his youth who became a liberal Democrat as an adult. “…the Republican Party — as it is now — must be utterly destroyed in 2020. The word euthanized comes to mind.”
Sean McElwee, a researcher for dataforprogress.org, offers a more balanced, less provocative description of the GOP’s conservative base:
“While non-college whites do indeed make up a significant portion of (Donald) Trump’s base, they also make up a non-trivial share of (Hillary) Clinton voters…
…If we define the base as a group making up a non-trivial share of the electorate that overwhelmingly prefers one party, it is fair to call white evangelicals Trump’s base. If we define the base purely by the size of the coalition, we might prefer instead white non-college voters or whites over 50, both of whom make up more than half of Trump’s voters.”
And New York Magazine writer Eric Levitz takes a variant approach by summarizing what motivates this conservative base — but the implication about who is being motivated is crystal clear:
“For decades now, the conservative movement has sought to keep its core voters confined to a carefully curated media ecosystem — one where the Democratic Party is a Marxist–Islamist organization, America is the world’s most over-taxed nation, illegal immigrants bear sole responsibility for the stagnation of middle-class wages (and/or all violent crime), and there’s never been a better time to buy gold coins.”
Schaeffer and Levitz’ descriptions wouldn’t be funny if they weren’t somewhat accurate.
These are stereotypes about Donald Trump’s conservative base — rooted in reality — but deeply misleading at the same time.
Summarizing 62 million Trump voters is a Sisyphean task even for statisticians and strategic consultants, much less for the average political journalist, which is why stereotyping is so seductive, as it is often based on kernels of truth.
Using the attitudinal segmentation detailed in my previous essays, I computed within each political segment the percentage who were white and did not have a 4-year college degree. As seen in Figure 1, the majority of the conservative base (also referred to as ‘Trump’s conservative base’ in this essay) fit this demographic description (63%). In comparison, only 31 percent of the Democratic progressive base shares those attributes.
On the surface, it appears fine to categorize — or, rather, stereotype — conservatives as less-educated, white people.
Figure 1: Prevalence of Whites without a 4-year College Degree by Political Segment
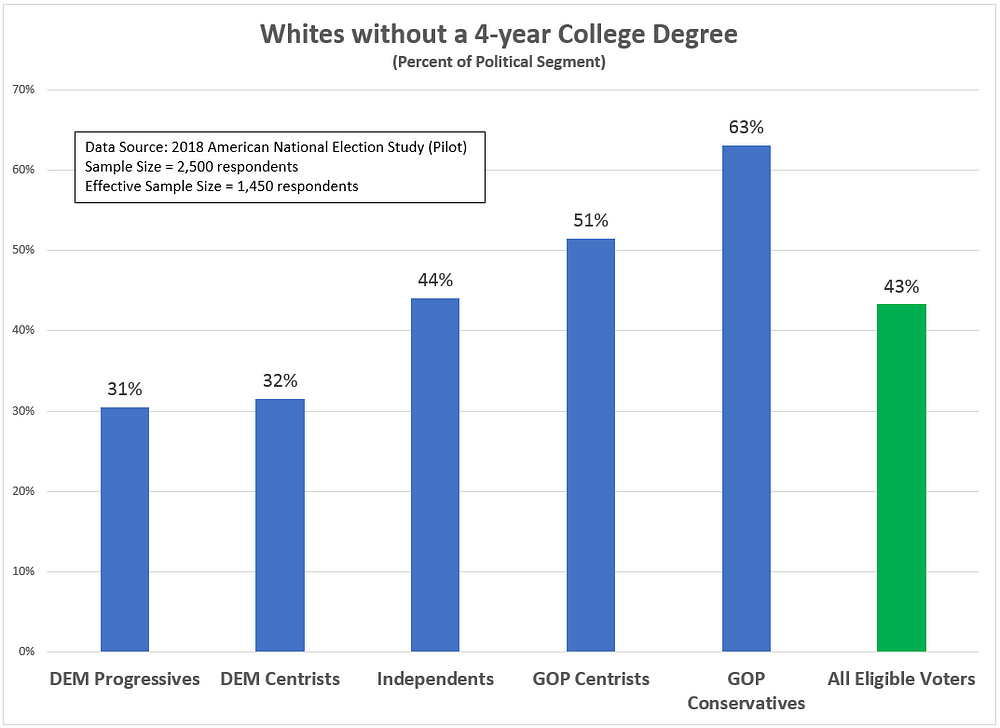
Data Source: 2018 American National Election Study (Pilot); Analytics & Segmentation by Kent R. Kroeger
But this characterization is not precise.
Anytime we use stereotypes as a heuristic device to save analytic time and energy, we risk mischaracterizing the world we’re trying to explain.
That is the case with many who try to describe Trump’s conservative base.
Stereotyping is lazy analytics
Stereotypes are cognitive short-cuts that help simplify our lives. We engage in stereotyping because it often works across a wide of range of daily activities.
When we choose a new restaurant, we judge it by location, cuisine, and price. That is stereotyping.
When we seek partners, we consider diction, education level, religious background, and even someone’s accent. That is stereotyping.
Stereotyping saves us time and effort. Psychologists James Hilton and William von Hippel define stereotypes as “mental representations of real differences between groups. . . allowing easier and more efficient processing of information.”
But stereotyping has a risk. It can mischaracterize the true nature of a group and its relationship to other groups. Trump’s almost monolithic white, less-educated voter base is not a myth, but its not the whole story either. And its certainly not the interesting story.
As we will see below, there is significant attitudinal diversity within the media-maligned conservative base, who could represent the tipping point in a Democrat landslide in 2020, or the foundation of a new, durable GOP electoral majority.
Yes, racism and sexism punctuated the 2016 election, but…
As the U.S. has become more educated and ethnically diverse, Republican voters have become more reflective of an earlier era in America, as they are now predominately white, Christian, and less likely — from even a decade ago — to be college graduates, according to a 2018 Pew Research study. Add in a growing partisan gender gap and it doesn’t take a PhD in demography or political science to realize this is voter base is problematic for the Republicans going forward.
Still, the formula worked for the Republicans in 2016.
Education levels among whites strongly correlated with their 2016 vote choice. The divide in vote preferences between highly-educated and lesser-educated whites grew dramatically during the 2016 campaign, according to a team of researchers led by University of Massachusetts–Amherst political scientist Brian Schaffner, and this gap is not explained by economics.
But this divide was not a reflection of greater economic stress among lesser-educated whites. According to Schaffner’s team, Trump’s vote was driven by sexism and racial denialism, not economics. “Explicit racist and sexist appeals appeared to cost Trump some votes from more educated whites, but it may have won him even more support among whites with less education.”
The UM-Amherst study, however, leaves a dark impression about the average Trump voter; even though, the analytic focus of the study had little to do with describing the average Trump voter. Its concern was in describing relationships between populations through marginal and conditional probabilities — which is not the same as describing a population such as Trump’s conservative base. Those are two different analytic tasks.
There is little doubt that Trump’s explicit appeals to nativism along with his own misogynistic behavior sharpened the sorting process among many voters still available to either Clinton or Trump in the last months of the 2016 election. But those ‘persuadable’ voters are not the same as the conservative base.
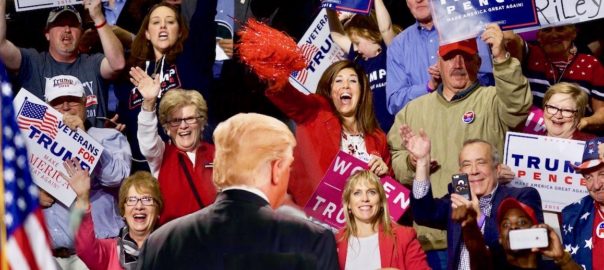
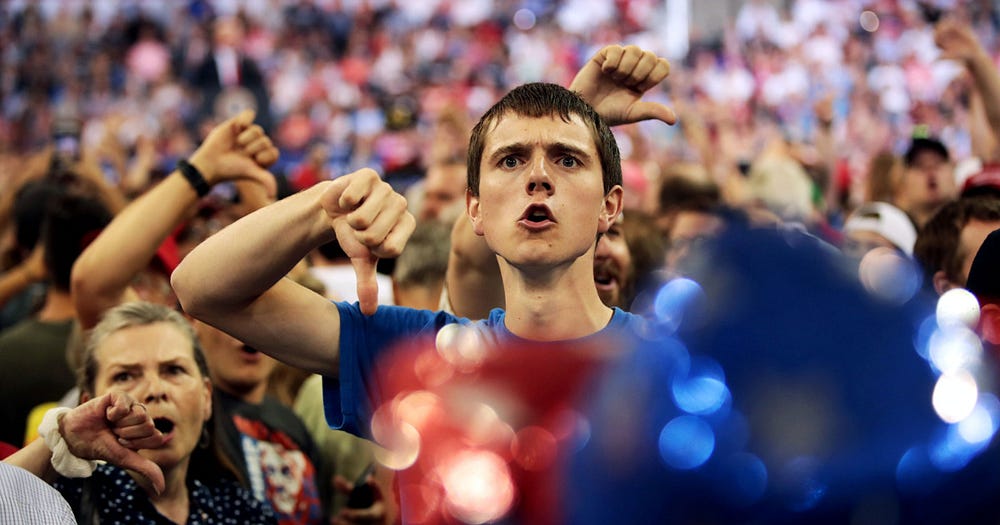 At a rally in Minnesota last summer, Donald Trump invited his audience to offer its opinion on the “fake news” media. Photo: Scott Olson/Getty Images
Don’t let the sounds and images from Trump campaign rallies (or the rambling, ignominious rants of Trump himself) define the entire conservative base. The bloc of voters that most helped elect Trump cannot be summarized with stereotyping labels such as ‘racist,’ ‘sexist,’ ‘homophobic,’ or ‘anti-immigrant.’ I understand the temptation, but resist.
Employing a two-stage attitudinal segmentation of 2018 ANES respondents, in the first stage, using attitudes related to current policy issues (immigration, trade, health care, economic inequality, gun control and climate change) and, in the second stage, using attitudes on race, ethnicity, sexual orientation, and other social organizations, three sub-segments are identified within the GOP’s conservative base (see Figure 2):
Old Guard Conservatives (33% of Conservatives; 9% of all eligible voters).
Lost Hope Conservatives (27% of Conservatives; 7% of all eligible voters).
Compassionate Conservatives (40% of Conservatives; 11% of all eligible voters).
Figure 2: The Sub-Segments within the Conservative and Progressive Political Segments
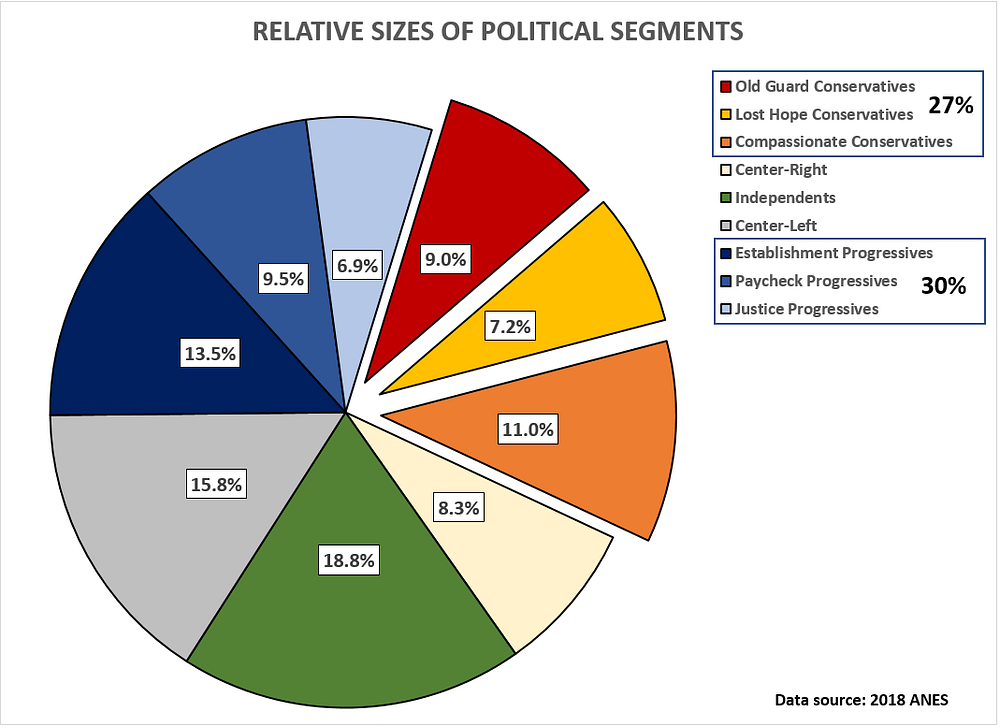
Data Source: 2018 American National Election Study (Pilot); Analytics & Segmentation by Kent R. Kroeger
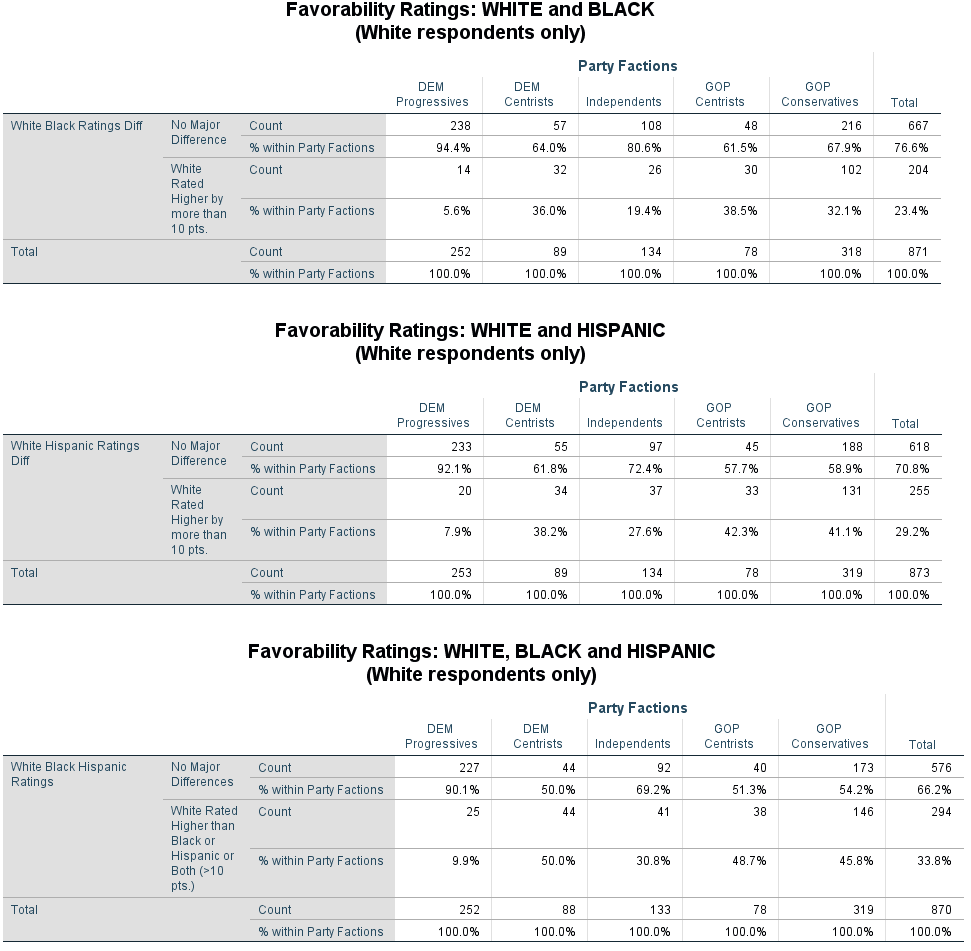
Compassionate Conservatives are the largest sub-segment of conservatives (40%) and distinguish themselves from both the Lost Hope and Old Guard sub-segments with respect to their favorability towards other races, ethnicities, and social groups (i.e., group affinities). On average, Compassionate Conservatives rate whites roughly the same as they do Blacks and Hispanics (in contrast to the other conservative sub-segments who rate whites significantly higher than those groups). Second, Compassionate Conservatives demonstrate greater affinities towards Gay and Lesbian, Transgender, Muslim and immigrant Americans relative to Lost Hope and Old Guard sub-segments. They are, for lack of a better description, more open-minded than other conservatives and represent the largest number of conservatives.
Given the relatively small sample size of conservatives (effective n = 331) and progressives (effective n = 358), most of the demographic differences between the sub-segments are statistically insignificant. However, there are some notable exceptions:
- Compassionate Conservatives are the wealthiest sub-segment
- Lost Hope Conservatives are the least wealthy sub-segment
- Old Guard Conservatives are the oldest and least Female sub-segment
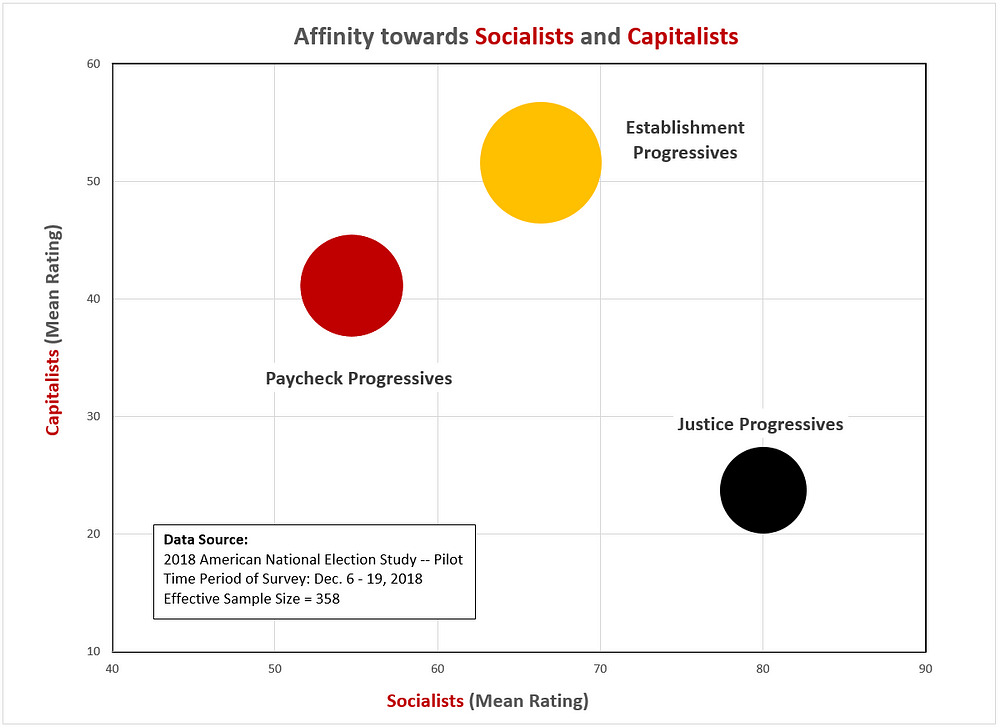
While more detail on the attitudinal and demographic differences between the conservative (and progressive) sub-segments can be found in the Appendix below, the following graphs highlight some of the more prominent attitudinal differences.
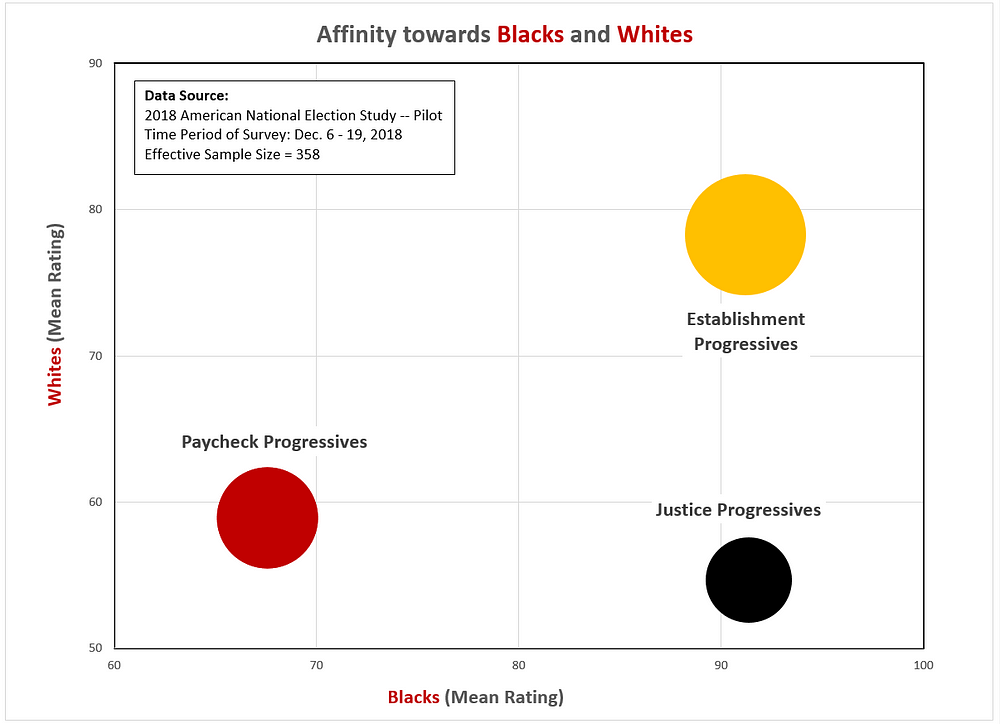
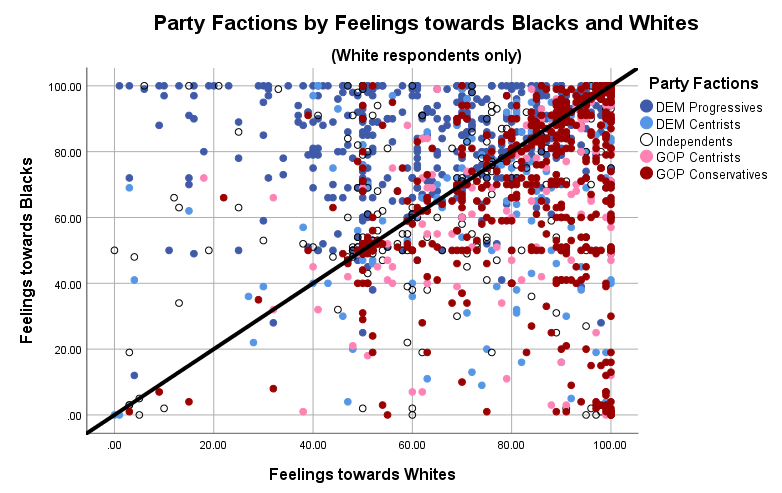
Figure 3 maps the conservative and progressive sub-segments based on their average ratings of whites and Blacks. The diagonal line shows where both racial groups are rated the same (equity). Four of the six groups are relatively close to this line (and statistically indistinguishable from it), while Justice Progressives, on average, rate Blacks higher than whites and Lost Hope Conservatives do the opposite.
Figure 3: Ratings of Blacks and Whites (Conservative and Progressive Sub-Segments)
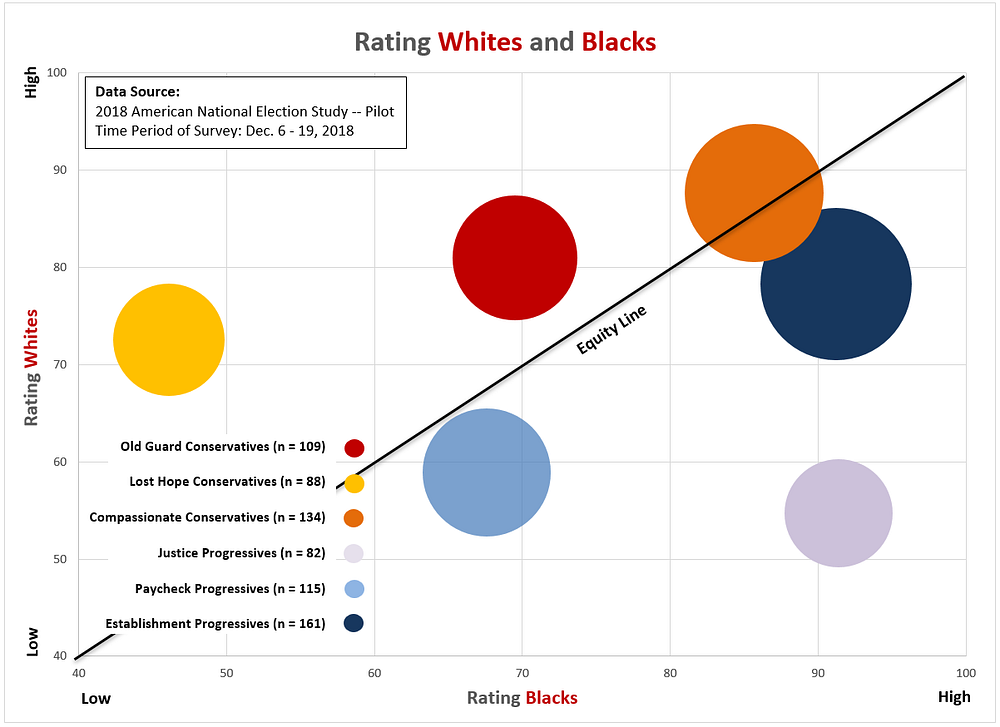
Data Source: 2018 American National Election Study (Pilot); Analytics & Segmentation by Kent R. Kroeger
On these racial attitudes, Compassionate Conservatives (the orange circle) have more in common with Establishment Progressives (the dark blue circle)than they do with the two other conservative sub-segments.
On attitudes regarding immigration, Compassionate Conservatives also distinguish themselves among the conservatives. While they generally agree that immigration numbers into the U.S. should decrease (horizontal axis in Figure 4), they depart from their political brethren on whether immigration and diversity hurts American society (vertical axis in Figure 4). Only 20 percent of Compassionate Conservatives believe immigration and diversity hurts society, while 46 percent of Old Guard Conservatives and 57 percent of Lost Hope Conservatives believe it does. That is a significant and dramatic difference within the conservative base.
Figure 4: Attitudes on Immigration and Diversity (Conservative and Progressive Sub-Segments)
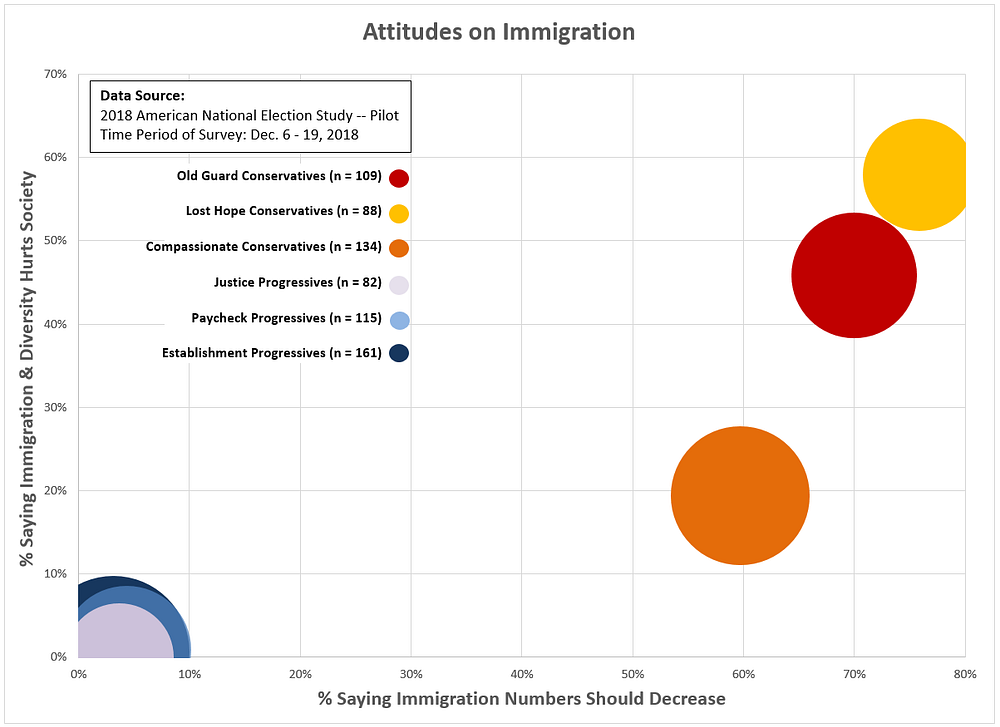
Data Source: 2018 American National Election Study (Pilot); Analytics & Segmentation by Kent R. Kroeger
Figures 5 through 7 summarize the sub-segments (conservative and progressive) on their ratings of Gays and Lesbians, Transgender, and Muslims. As seen in this series of bar charts, the distributions of the identity group ratings by the Compassionate Conservatives resemble the progressive sub-segments far more than the two other conservative segments. In particular, the distributions for the Compassionate Conservatives closely match those for the Paycheck Progressives, a sub-segment of progressives that skews male and less wealthy.
Figure 5: Ratings of Gays and Lesbians (Conservative and Progressive Sub-Segments)
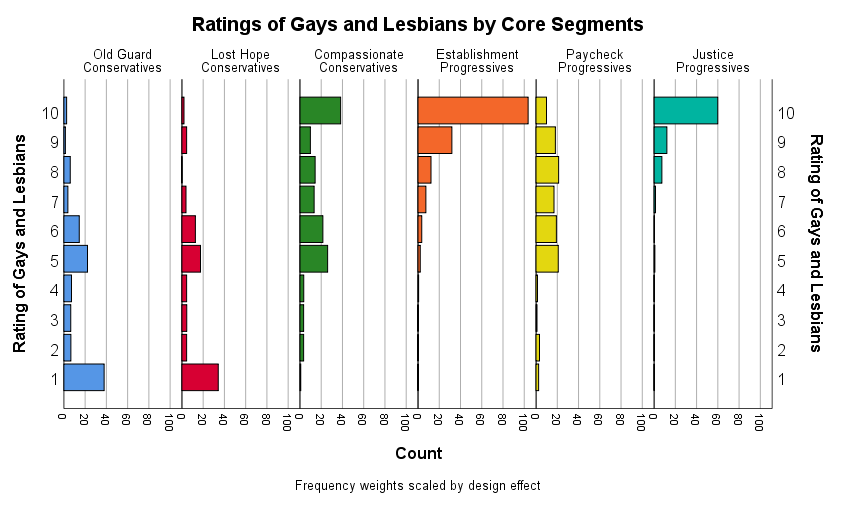
Data Source: 2018 National Election Study (Pilot); Analytics and Segmentation by Kent R. Kroeger
Figure 6: Ratings of Transgender (Conservative and Progressive Sub-Segments)

Data Source: 2018 National Election Study (Pilot); Analytics and Segmentation by Kent R. Kroeger
Figure 7: Ratings of Muslims (Conservative and Progressive Sub-Segments)
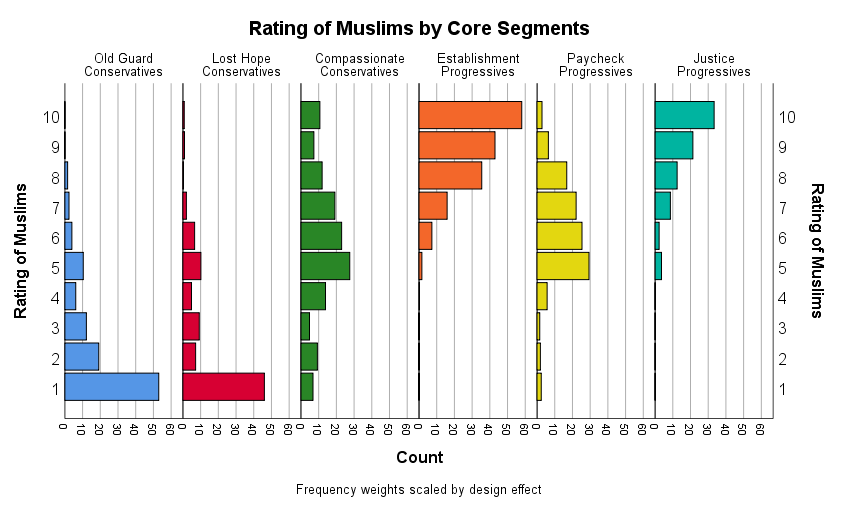
Data Source: 2018 National Election Study (Pilot); Analytics and Segmentation by Kent R. Kroeger
If LGBTQ rights and other identity-based issues were major vote drivers for conservatives, 40 percent of the GOP/Trump base might listen to Democratic messages on such topics during the current election cycle. Then again, the GOP might just as logically target Paycheck Progressives with uniquely tailored messages.
If there is one constant in American politics, every national election is potentially competitive. The popular vote difference between the two parties in U.S. House elections has exceeded 10 percentage points just six times since 1946 (out of 37 elections).
Neither the Republicans or Democrats enter an election without hope or possibilities. Whether a party leverages their strategic and tactical strengths enough to fulfill those hopes is another matter.
Are Compassionate Conservatives the GOP’s “Breakaway Province” or their beacon to the future?
A Democratic-aligned pollster once described Reagan Democrats, a working-class, once reliable voting segment of the Democratic Party coalition, as the Democratic Party’s ‘breakaway province.’ The defection of this ‘province’ to the Republicans in 1980 ushered in Ronald Reagan’s charismatic leadership and a conservative ideology that would dominate the American political landscape until the 2008 financial crisis.
Though some political scientists are skeptical that realignments actually happen — David Mayhew once writing, “Electoral politics is to an important degree just one thing after another… and their underlying causes are not usefully sortable into generation-long spans” — some political observers believe the 2016 Trump election may be the commencement of the next great realignment.
Washington Post columnist David Ignatius recently opined: “Political systems can be like scientific theories. Sometimes there emerge so many anomalous elements that don’t fit the existing structure that the theory collapses, and a new one arises… We may be entering such a period. The definition of a winning Democrat may be that, in response to Trump’s rambling circus of self-aggrandizement, he or she could create a genuinely coherent new political order.”
One possible target of Ignatius’ new political order could be Compassionate Conservatives whose attitudes resemble many in the Democrats’ progressive base, the presumption being that the three factions in the progressive left will hold together as long as Trump is in office.
The other common assumption rising from observations like Ignatius’ is that a centrist candidate could be very attractive to Republicans and Democrats disillusioned by the ideological extremism of their parties — and that an ideologue from the left (like Bernie Sanders) or right could not build such a coalition as easily as a centrist candidate.
But the political world doesn’t operate under this naive voting model where voters line up their opinions relative to those of political candidates and make their vote choices accordingly. Centrists and non-ideological voters, in particular, are generally unable or disinclined to make decisions this way.
Political scientists realized long ago that using spatial models of voter attitudes to predict vote choice aren’t terribly informative. To the contrary, two realities describe American voting behavior: (1) Vote choice often drives voters’ opinions (not the other way around), and (2) there is little electoral penalty for political extremism.
The result is that idealistic and folksy conceptions of our pluralistic democracy as one where voters ‘throw the bums out’ when their policies fail is dangerously wrong.
Political scientists Christopher H. Achen and Larry M. Bartels, in their book, Democracy for Realists: Why Elections Do Not Produce Responsive Government, conclude that “abandoning the folk theory of democracy is a prerequisite to both greater intellectual clarity and real political change. Too many democratic reformers have squandered their energy on misguided or quixotic ideas.”
In explaining why Bernie Sanders can attract voters that don’t necessarily agree with his policies, Achen and Bartels write:
“Decades of social-scientific evidence show that voting behavior is primarily a product of inherited partisan loyalties, social identities and symbolic attachments. Over time, engaged citizens may construct policy preferences and ideologies that rationalize their choices, but those issues are seldom fundamental. That is one key reason contemporary American politics is so polarized: The electoral penalty for candidates taking extreme positions is quite modest because voters in the political center do not reliably support the candidates closest to them on the issues.”
The point is simply that we cannot assume a candidate’s views are a direct reflection of his/her supporters’ views. And we see that phenomenon in the 2018 ANES data where Centrists are often low-information voters who support candidates not always close to their own personal opinions.
One reason I don’t show the Centrist political segments when mapping opinions and attitudes (such as in this essay) is that their political behavior is either too unpredictable or non-existent (i.e., non-voters). The more ideologically cohesive political segments are far more interesting.
Which is why Compassionate Conservatives (on the right) and Paycheck Progressives (on the left) are so intriguing and potentially more impactful in the 2020 election and for the futures of their respective parties.
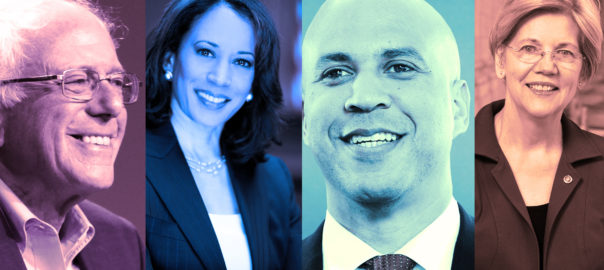
Contrary to media narratives, the potent political division within the Democratic Party is not between Centrists and Progressives but between Establishment Progressives (think Kamala Harris and Beto O’Rourke) and Justice Progressives (think Bernie Sanders and Elizabeth Warren). But even those two political segments agree far more than they disagree. On health care reform, for example, the distance between Sanders’ Medicare-for-Allplan (a single public option for all) and the Democratic establishment’s Medicare-for-America (offering a public option to go with the current private health care system) is small when compared to what the Republicans offer on health care reform — which is mostly nothing.
As for the GOP’s conservative base, the media narrative on its composition is not much more than stereotyping and it is generally wrong. Representing two-fifths of conservatives, Compassionate Conservatives mirror the Democrats more than other conservatives on racial, gender, and cultural attitudes. And not only are they the largest conservative segment, they are wealthier and younger than the party’s Old Guard, promising that the power of Compassionate Conservatives within the GOP is more likely to grow than shrink proceeding into the future.
The battle for the soul of the Republican Party will be fought between the three sub-segments of conservatives described in this essay. The older, more politically active Old Guard against two relatively young sub-segments, themselves divided by education, economic status, and levels of open-mindedness.
The conservative base is not a white, uneducated monolith of racists, sexists, and homophobes (…don’t get me wrong, these conservatives do exist). But, attitudinally, the conservative base is remarkably diverse. If it weren’t, the GOP would be dead in the water heading into 2020.
For datasets and statistical codes, send requests to: kroeger98@yahoo.com
___________________________________________________________________
APPENDIX: A METHODOLOGICAL SIDEBAR
A Two-Stage Segmentation Based on Policy Attitudes and Identity Politics
This essay uses an two-stage attitudinal segmentation of U.S. eligible voters as its data source to identify the GOP’s conservative base (measured in Dec. 2018).
In the segmentation’s first step, all 2,500 ANES respondents were clustered based on a series of attitudinal questions related specific social and political policies (e.g., trade, immigration, gun control, climate change, etc.) in order to create relatively homogeneous political segments. In other words, the people within each segment possess relatively similar attitudes on policy issues [More detail on these segments can be found in the previous essays, starting here.]
A five-cluster solution was selected based on fit characteristics and interpretability (Figure A.1). Progressives are the largest political segment today, accounting for 30 percent of the eligible voter population, followed by Conservatives (27%) and Independents (19%).
Figure A.1: The Political Segments in the U.S. eligible voter population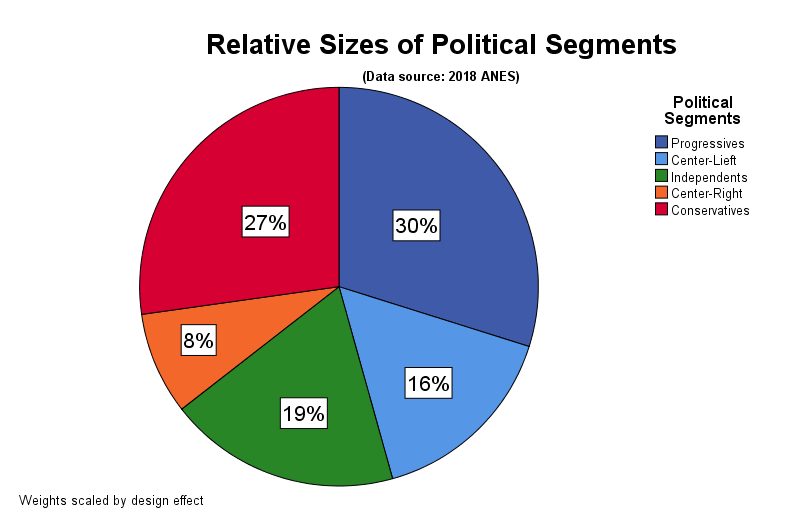
Data Source: 2018 National Election Study (Pilot); Analytics and Segmentation by Kent R. Kroeger
This essay is focused on the Conservatives, who were additionally segmented based on their racial attitudes and group affinities (i.e., orientation towards identity politics).
The second-stage segmentation identified three sub-segments within the Conservative political segment: Old Guard, Lost Hope, and Compassionate Conservatives. [My fourth essay discusses in detail the three Progressive sub-segments within the Democratic Party’s base.]
Compassionate Conservatives are the largest of the three Conservative sub-segments (40 percent of the Conservative segment and 11 percent of the total population) and, as we will see below, counter many of the stereotypes presented in the national media about the Trump base (Figure A.2).
Figure A.2: The Sub-Segments within the Conservative and Progressive Political Segments
Data Source: 2018 National Election Study (Pilot); Analytics and Segmentation by Kent R. Kroeger
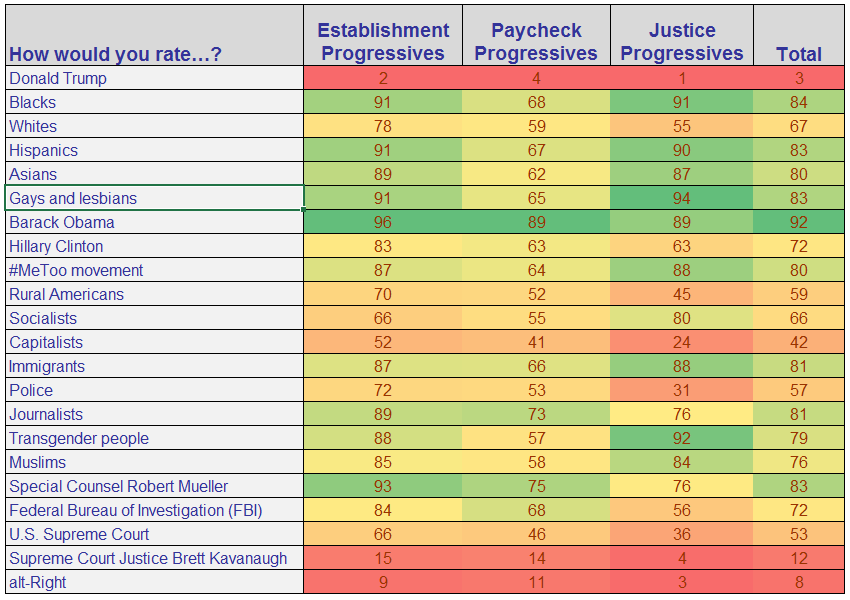
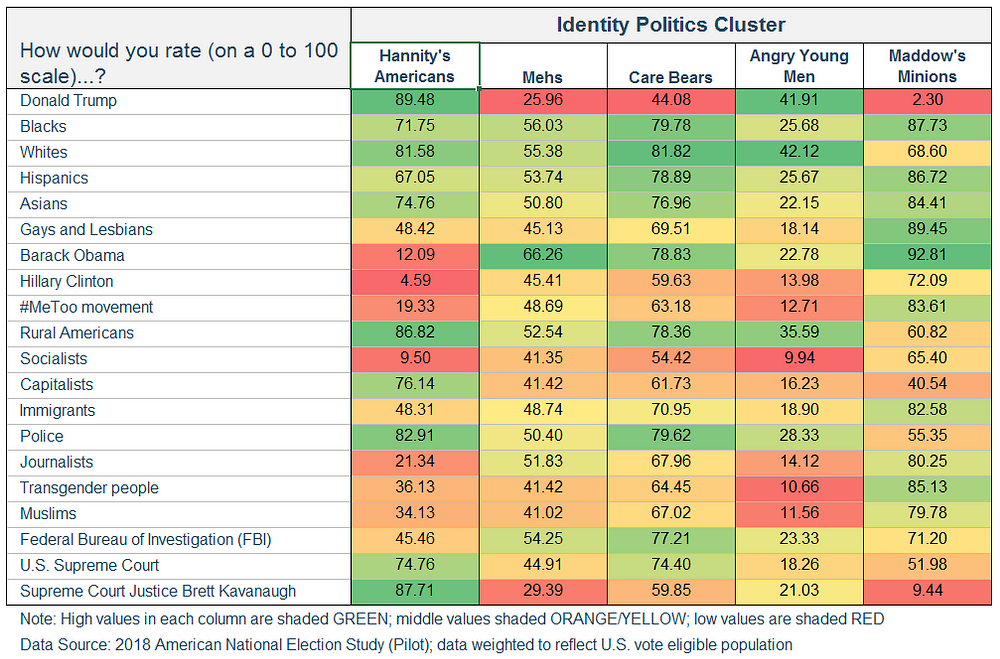
Figure A.3 shows the average affinity scores (rating on a 0 to 100 scale) for each Conservative sub-segment. Where all three sub-segments agree is no surprise: They like Donald Trump, whites, rural Americans, and Supreme Court Justice Brett Kavanaugh; and they dislike Barack Obama, Hillary Clinton, the #MeToo movement, socialists, journalists, and Special Counsel Robert Mueller (though on the latter, opinions have probably changed in the last few days).
Figure A.3: Racial Attitudes and Group Affinity Questions Used for 2nd-Stage Segmentation
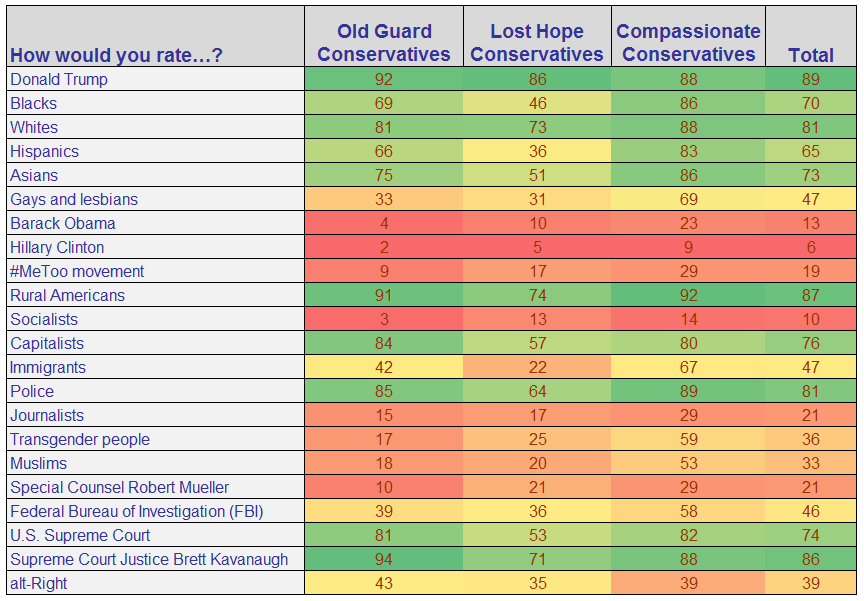
Data source: 2018 American National Election Study (Pilot); Segmentation by Kent Kroeger (NuQum.com); Color shading is determined within the column (i.e., political sub-segment)
However, significant differences in racial attitudes and group affinities also delineate the three sub-segments. Most axiomatic are the highly negative views Lost Hope Conservatives hold towards Blacks, Hispanics and immigrants. Lost Hope Conservatives, representing only 27 percent of the Conservative political segment, are consistent with mainstream stereotypes of the Trump base: They are anti-immigrant and racially-biased (and probably sexist too).
In counterpose, Compassionate Conservatives distinguish themselves in two ways from both the Lost Hope and Old Guard sub-segments. First, on average, they rate whites roughly the same as they do Blacks and Hispanics (in contrast to the other sub-segments who rate whites significantly higher than the other races and ethnicities). Second, Compassionate Conservativesdemonstrate greater affinities towards gays and lesbians, transgender people, Muslims and immigrants relative to Lost Hope and Old Guard sub-segments. They are, for lack of a better description, more compassionate and open to the world and its inherent differences.
Though not quite a majority of the Conservative base, Compassionate Conservatives probably represent a better conspectus of the “typical” Trump-voting conservative than either the Old Guard or Lost Hope sub-segments.
Demographics and Behaviors
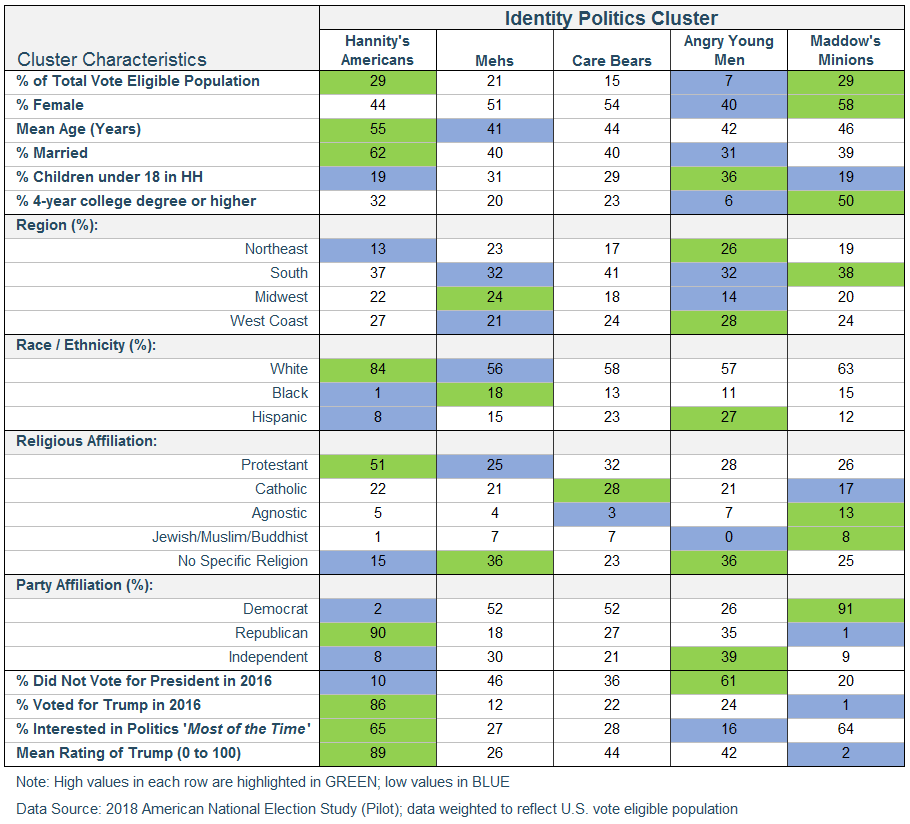
Figure A.4 details the demographic and behavioral characteristics of the sub-segments. In this table, the color shading is determined by each row. For example, in the first row, Establishment Progressives have the highest incidence of females (60%) and the Old Guard Conservatives have the lowest (37%).
Figure A.4: Demographic and Behavioral Characteristics (Conservative and Progressive Sub-Segments)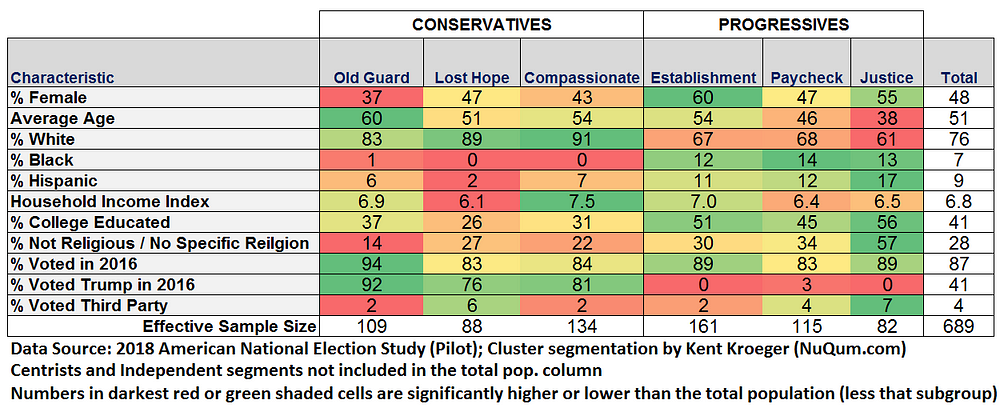
The starkest differences between conservatives and progressives are in the incidence of Blacks, Hispanics, a college education, Trump voters (no surprise), and non-religiousness.
Within the conservative segment, Compassionate Conservatives stand out asbeing very white and having high incomes, while the Old Guard are very male, religious, and old. The Old Guard were also the most supportive of Trump in 2016 and had the highest vote turnout percentage of the six sub-segments. Lost Hope Conservatives stand out from other conservatives with the highest percentage of females (47%) and the lowest average incomes.
___________________________________________________________________
Additional Graphics
Figure A.5: Demographic and Behavioral Characteristics (Conservative and Progressive Sub-Segments)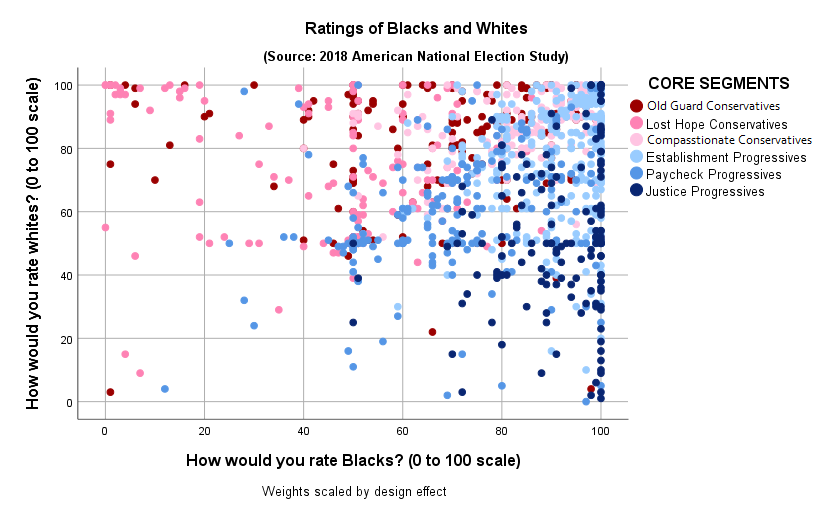 Data Source: 2018 National Election Study (Pilot); Analytics and Segmentation by Kent R. Kroeger
Figure A.6: Ratings of the #MeToo Movement and the Transgender (Conservative and Progressive Sub-Segments)
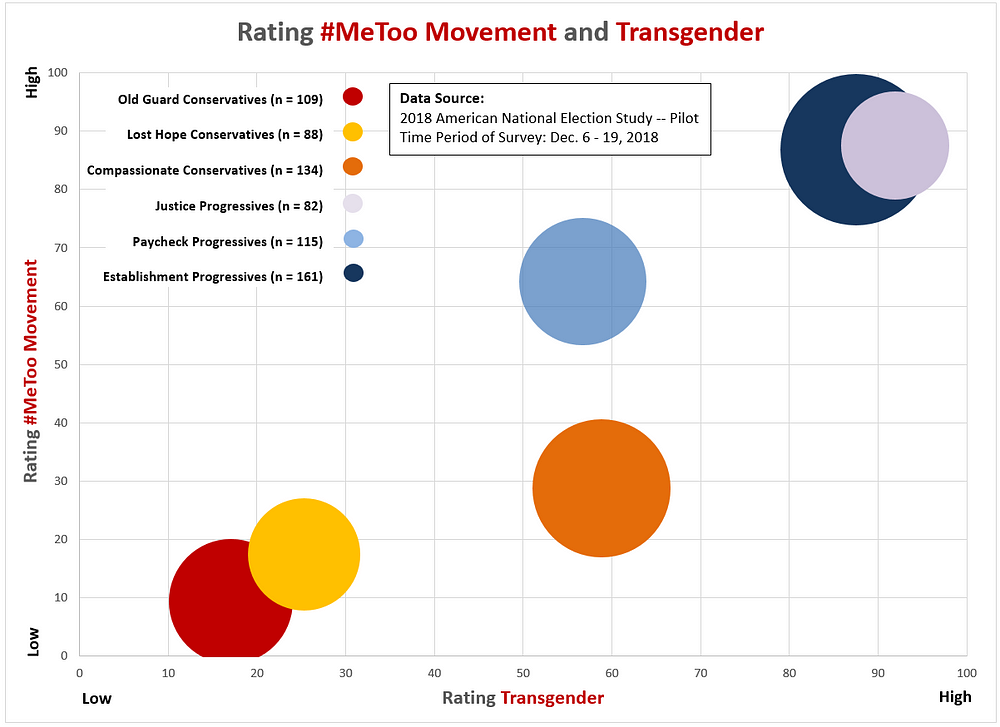
Data Source: 2018 National Election Study (Pilot); Analytics and Segmentation by Kent R. Kroeger


 Data Source:
 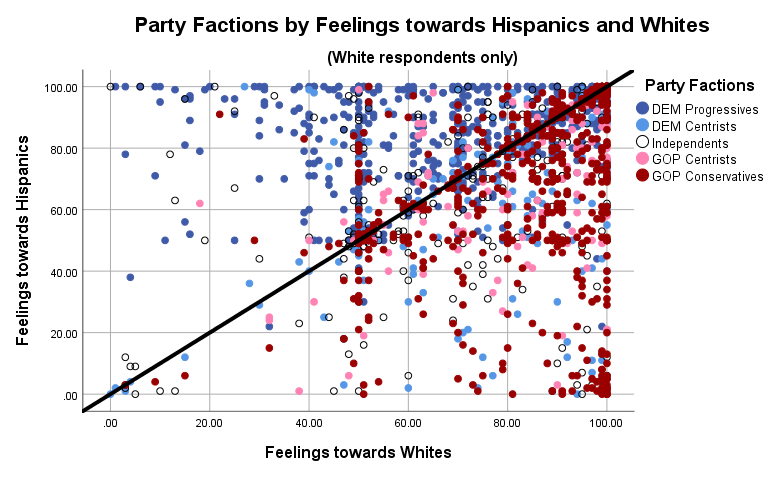 Data Source:
  Data Source:
  Data Source: