
By Kent R. Kroeger (Source: NuQum.com, July 13, 2017)
The late (great) comedian Sam Kinison was famous for a bit he did about African hunger where he suggested — in primal scream tones — the starving people should just “MOVE TO WHERE THE FOOD IS!!!”
Kinison was often crass and his African hunger bit wouldn’t survive the filtering and obligatory over-analysis of today’s 24-7 media, but its core logic would nonetheless survive: If things aren’t working for you, maybe its time to change what you are doing.
That piece of common sense is what I took away from Mark Penn and Andrew Stein’s July 6th New York Times op-ed piece: Back to the Center, Democrats. And their sentiment is hardly new or controversial. But, judging from the reaction on social media, you would of thought they had just endorsed Ivanka Trump for President in 2020.
Here is a just a sampling from Twitter:
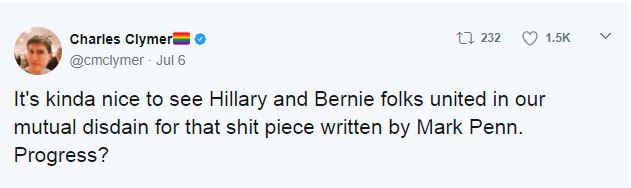
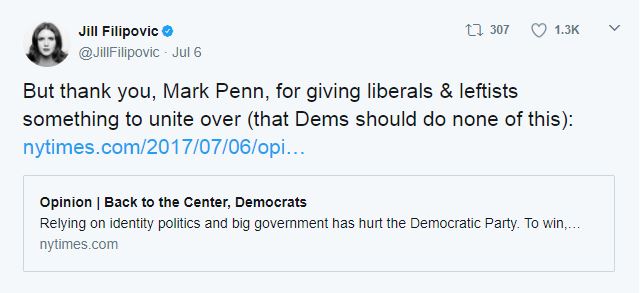
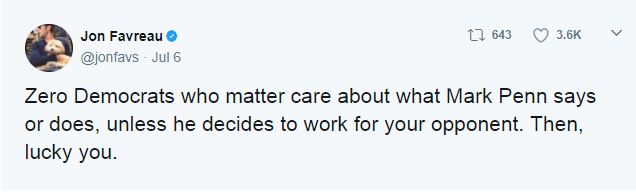
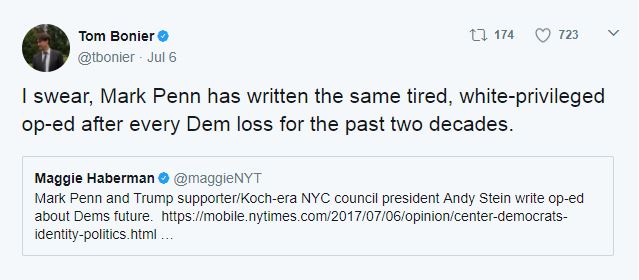
Beyond the name-calling and careless misrepresentations of the Penn and Stein piece (Keith, do you really think Hillary could have run as the “Change” candidate in 2008? Seriously?), there is an intellectual dishonesty on display among these Democrats that I fear presages what could become the greatest ‘missed opportunity’ in U.S. political history. If the Democrats do not regain control of the U.S. House in 2018, they can look back at how they reacted to advice like that offered by Penn and Stein (and pollster Doug Schoen and many others, frankly).
I have some issues with the Penn-Stein thesis, but the Stephen Pimpare complaint that they lack sources, reference and data is a weapons-grade level of wrong. If anything, Penn and Stein are too gentle in urging the Democratic Party to take their foot off the progressive-agenda pedal. In suggesting the Democratic Party needs to re-engage with the nation’s political center — where most voters reside — Penn and Stein have the data overwhelmingly on their side.
THE MAJORITY OF AMERICANS LIVE IN THE POLITICAL CENTER
First, as documented by this blog (here), it is those calling for the Democrats to move more definitively towards the progressive Left that are ignoring or misreading the data.
The two common mistakes made by political writers (such as Wired’s Issie Lapowsky and The Atlantic’s Peter Beinart) are: (1) cherry-picking the polling data to highlight those issues where the progressive Left is aligned with the majority opinion (gun control, abortion rights, civil rights, increasing the minimum wage), and (2) relying too much on demographic determinism to forecast future electoral outcomes (e.g., Hispanics vote overwhelming for Democrats, as Hispanics increase as a percentage of the voting population, Democrats will be the primary benefactor).
The “Emerging Democratic Majority“-thesis is an example of this second error as it ignores significant opinion diversity within the identity groups most often associated with the Democratic voting base (African-Americans, Hispanics, LGBTQ community, Millennials). More importantly, these analyses under appreciate the opinion dynamics that often accompanies changes in people’s life-stage, income, and age. As we detail below, recent opinion data from African-American and Hispanic voters reveals significant distance between these voters and the ideological Left on a number of Democratic-core issues (Abortion rights, LGBTQ rights, immigration, Syrian refugees).
In the past year, NuQum.com has looked across hundreds of opinion surveys and forecast models related to political attitudes, beliefs and voting behavior in the U.S., and there is one clear conclusion: The average American voter doesn’t fit well into either the liberal or conservative ideological camps.
Yet, they are not apolitical either. They care about politics (when they need to), even if they don’t adhere to any strict ideological rules like those followed by activists from the left or right. While our elected leaders are more partisan than ever in their voting patterns, it is debatable as to whether the American voting population has grown more partisan. Pew Research cites polling data that suggests voters today are, in fact, more partisan. But other academic studies point out the extraordinary consistency over time on the centrist-leanings of American voters.
Our recent analysis of The University of Michigan and Stanford University’s 2016 American National Election Study (ANES) provides more current data on what Americans believe and how it relates to their political choices.
It is not good news for ideologues of the political Left or Right. But for the current discussion, we will concentrate on what the data suggest for the Left.
THE METHODOLOGY
First, It is helpful to understand the analytic approach we employed with the 2016 ANES data. As noted above, cherry-picking issues for analysis is one of the most common errors committed by political pundits and researchers. While we recognize that some issues are more important than others, in our analysis we chose to summarize voters’ opinions on over 100 equally-weighted issues measured in the 2016 ANES. Our goal was to group voters into relatively homogeneous ideological clusters based on their survey responses on a wide range of social and political issues. We, therefore, did not rely on respondents’ self-reported location on a binary ideological scale (liberal versus conservative).
We do recognize that in choosing some issues and not others in their survey questionnaire, the 2016 ANES researchers engaged in another type of analytic ‘cherry-picking.’ Our response is, ‘You have to work with what you are given.’
For clustering voters, we employed a K-means clustering method using SAS’s JMP 13.1.0 statistical software. For clustering variables, we employed JMP’s Cluster Variable procedure. (Our 2016 ANES dataset and analytic algorithms are available by sending a request to: kkroeger@nuqum.com )
THE RESULTS
After clustering the 3,649 respondents to the 2016 ANES, we found that only 14 percent of respondents could be classified as consistently “Left” in their opinions (see Figure 1 below). If we include respondents with mostly Liberal/Leftist opinions, 35 percent of American voters can be considered part of the ideological Left in this country.
In contrast, the ideological Right accounts for 15 percent of the voting population, and 33 percent if you include people that are mostly Conservative/Rightist in their opinions. That leaves the remaining third of voters in the ideological center.
Figure 1: The Six Voter Clusters
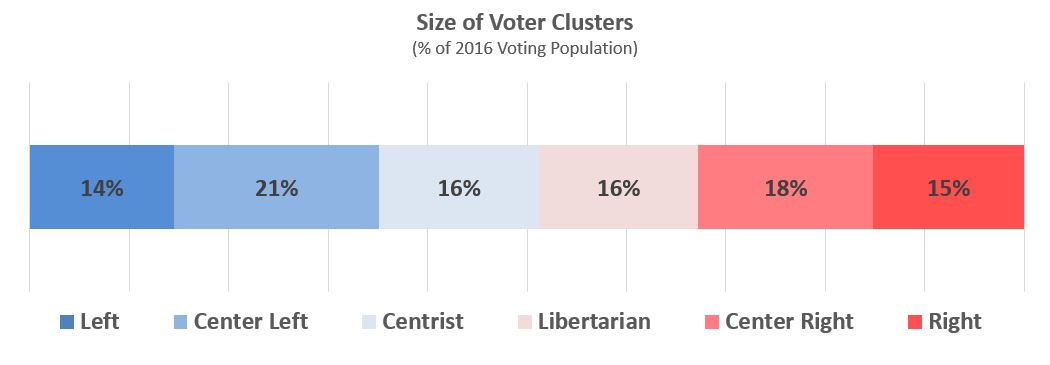
(Source: 2016 ANES; 3,649 respondents; max. MoE = +/- 4.3%; analytics by NuQum.com)
The clusters, by construction, are distinct in their opinions. It is no surprise therefore that the Left is most supportive of civil rights issues (LGBTQ, abortion), immigration, increased government spending on social programs and climate change. In contrast, the Right is less supportive of government spending on social programs and climate change, and more supportive of government action on security, terrorism and stopping illegal immigration.
Table 1 below provides the descriptive highlights of the opinion orientations for each cluster:
Table 1: Opinions of Voter Clusters
| Opinion Mix | |
|---|---|
| LEFT | Pro-choice, pro-amnesty, support LGBTQ rights, support increased gov't spending on social programs, support gov't role in climate change. |
| CENTER-LEFT | Similar to LEFT, except they are more concerned about security issues (crime, illegal immigration). |
| CENTER | Similar to LEFT, except much less supportive of LGBTQ rights, abortion rights, and allowing more Syrian refugees into U.S.. |
| LIBERTARIAN | Similar to RIGHT, except are generally opposed to foreign military interventions, are much more supportive of civil rights issues (LGBTQ, immigrants) and are concerned that fighting terrorism will compromise civil liberties |
| CENTER-RIGHT | Similar to RIGHT, except they see a stronger role for the government in addressing poverty and income inequality and are more concerned about climate change than either the Right or Libertarian clusters. This cluster contains is the populist wing of the Republican Party. |
| RIGHT | Support strong military, support increased intervention in Syria/Middle East to fight terrorism, oppose amnesty, oppose abortion, oppose increased social spending, favor less government, favor lower taxes, oppose gov't role in climate change |
When we look at the demographics and voting patterns of these six clusters, America’s political factions are recognizable. The Left, Libertarian, Center-Right and Right are each over 70 percent white (see Figure 2 below). Centrists, conversely, are a majority-minority cluster. In fact, a plurality of African-Americans and Hispanics are Centrists. If that doesn’t shake the foundations of the Democratic National Committee (DNC), nothing will. This is a remarkable conclusion, though hardly the first time this feature of African-American and Hispanic public opinion has been observed. The 2008 passage of California’s Proposition 8, a law that — had it not been struck down by the federal court — would have made it illegal for same-sex couples to marry, occurred in part due to strong support within the African-American and Hispanic communities.
This disconnect on some social issues between the DNC platform and minority voters does not suggest the Republicans have a chance to win a majority of African-American and Hispanic votes anytime soon. They do not. However, the vote turnout among these groups can change election outcomes in many localities and that is where the DNC should be concerned.
Figure 2: Voter Clusters by Race/Ethnicity
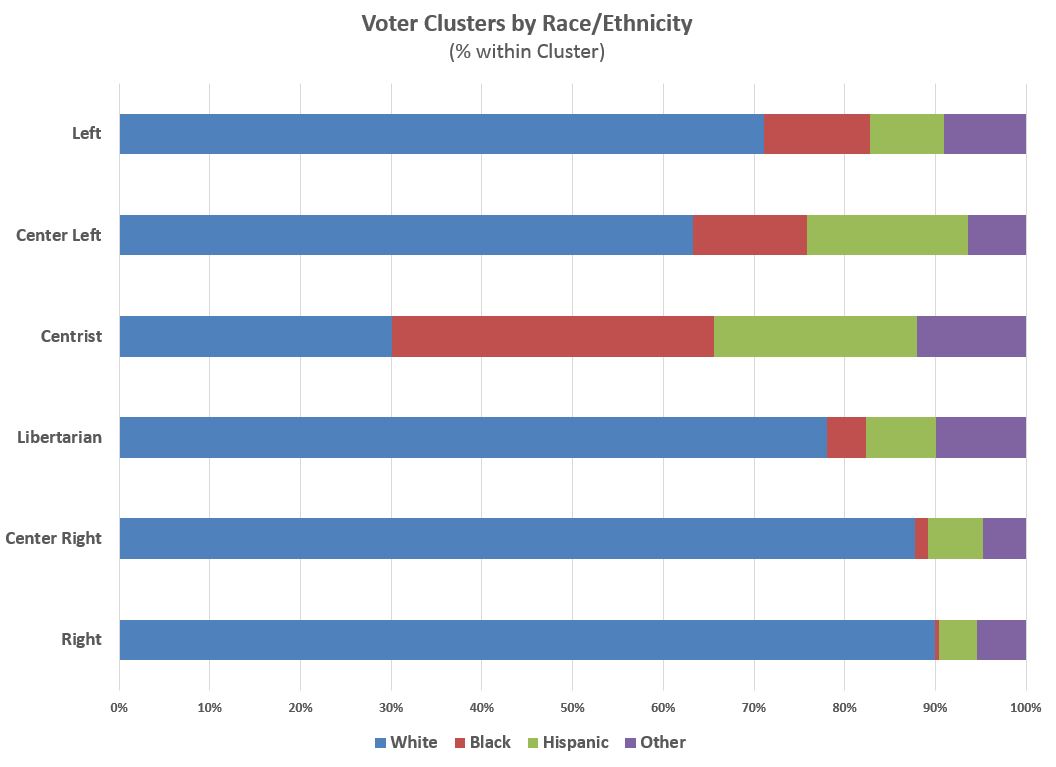
(Source: 2016 ANES; 3,649 respondents; max. margin of error = +/- 4.3%)
In terms of education, the Left is by far the most educated voter cluster with just over 30 percent of its members having an advanced college degree (see Figure 3 below). Centrists are the least educated; however, this a partly a function of this cluster being one of the youngest of the six voter clusters (see Figure 4 below). The Center-Right cluster is similar to Centrists in education with less than 20 percent having a 4-year college degree. The Right has the oldest members and are more likely to be married (see Figure 5 below). Centrists are the least likely to be married.
Figure 3: Voter Clusters by Highest Level of Education
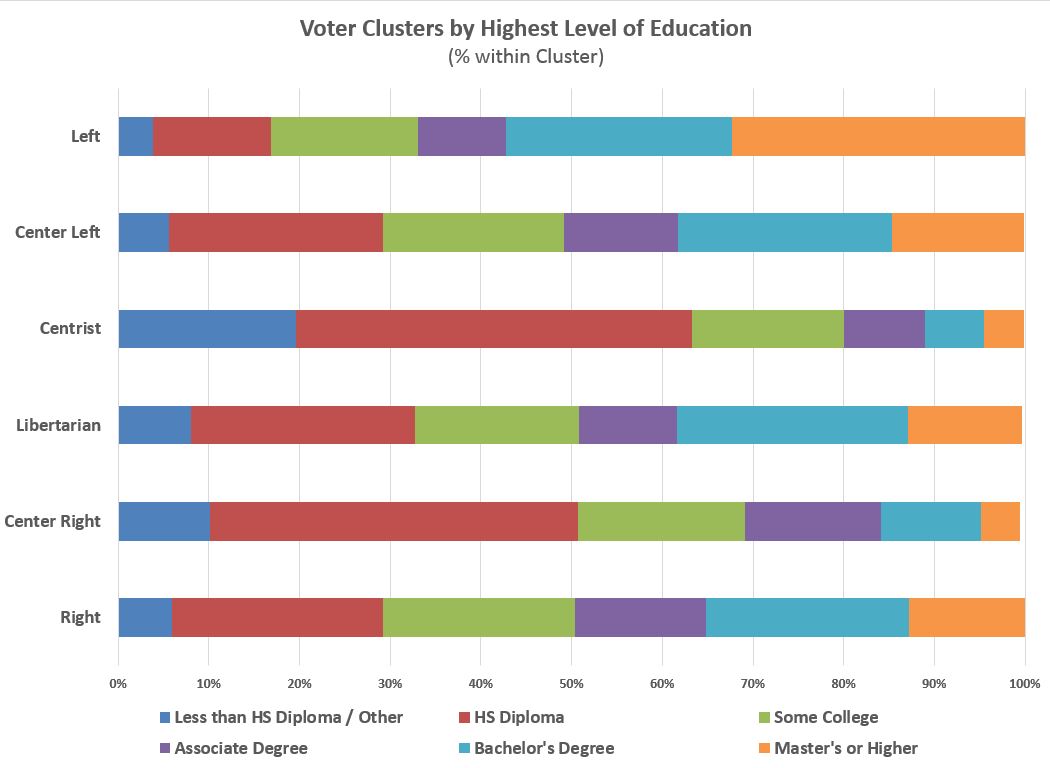
(Source: 2016 ANES; 3,649 respondents; max. margin of error = +/- 4.3%)
Figure 4: Voter Clusters by Age Group
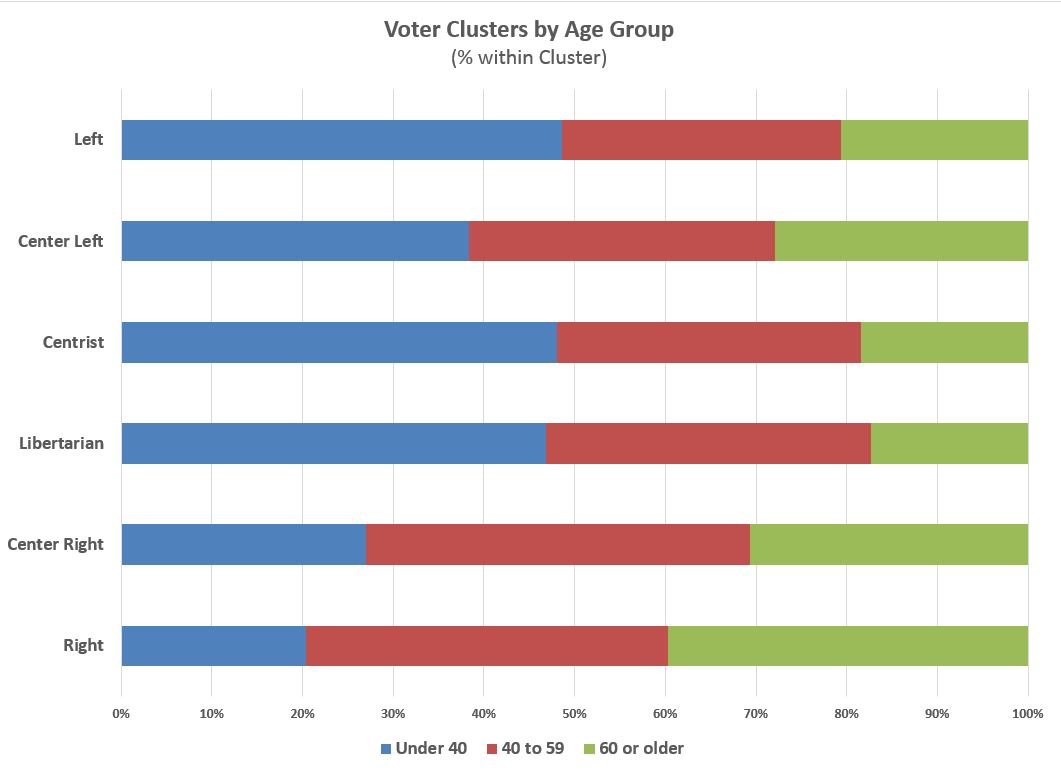
(Source: 2016 ANES; 3,649 respondents; max. margin of error = +/- 4.3%)
Figure 5: Voter Clusters by Marital Status
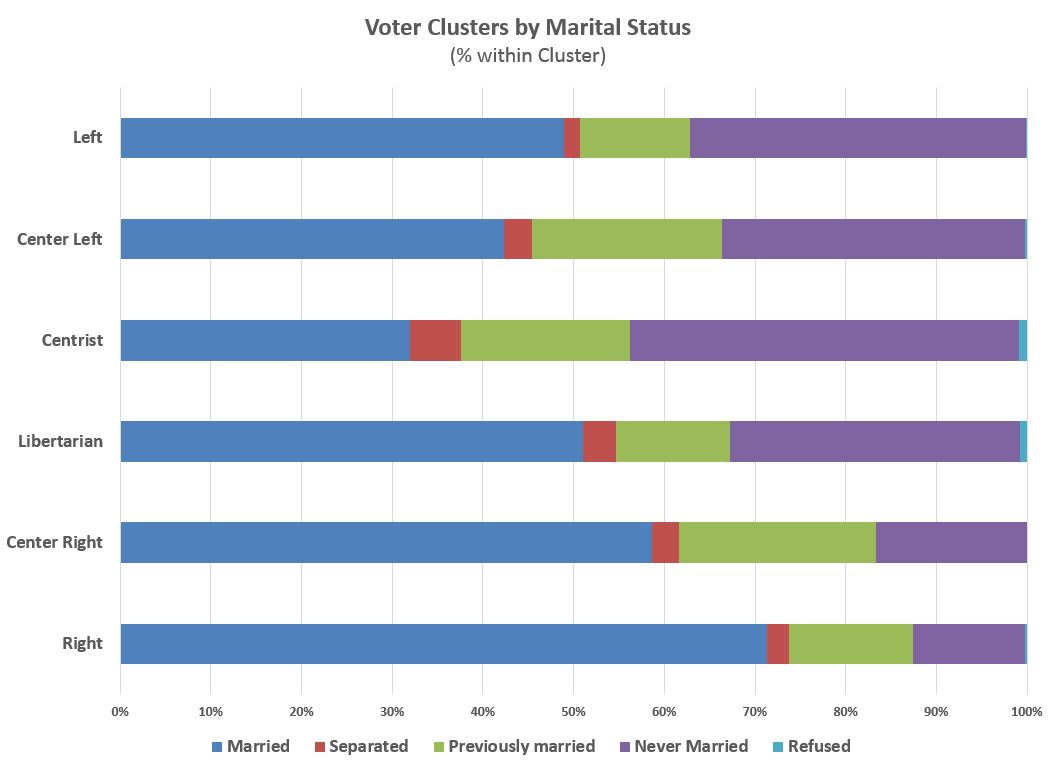
(Source: 2016 ANES; 3,649 respondents; max. margin of error = +/- 4.3%)
Figure 6 (below) shows the partisan makeup of the voter clusters and provides some validation to the clustering segmentation itself. Over 75 percent of the Left are registered Democrats and over 20 percent are independents. Almost 30 percent of the Center-Right are registered Democrats. Along with the Center-Left cluster, this the segment where we find many of the infamous white, working-class Trump voters. But, based on their self-reported attitudes, it shouldn’t surprise us that these voters would lean toward Trump. They are conservative.
Over 80 percent of the Right are registered Republicans. Not surprisingly, a plurality of independents are in the Libertarian cluster, however four of the six segments are comprised of 20 percent or more independents. Centrists are the second most likely to be registered as Democrats. Obama did much better than Clinton in poaching Center-Right and Libertarian voters from the Republican candidate and he defended his core (Left, Center-Left and Centrist) much better as well.
Figure 6: Voter Clusters by Party Registration
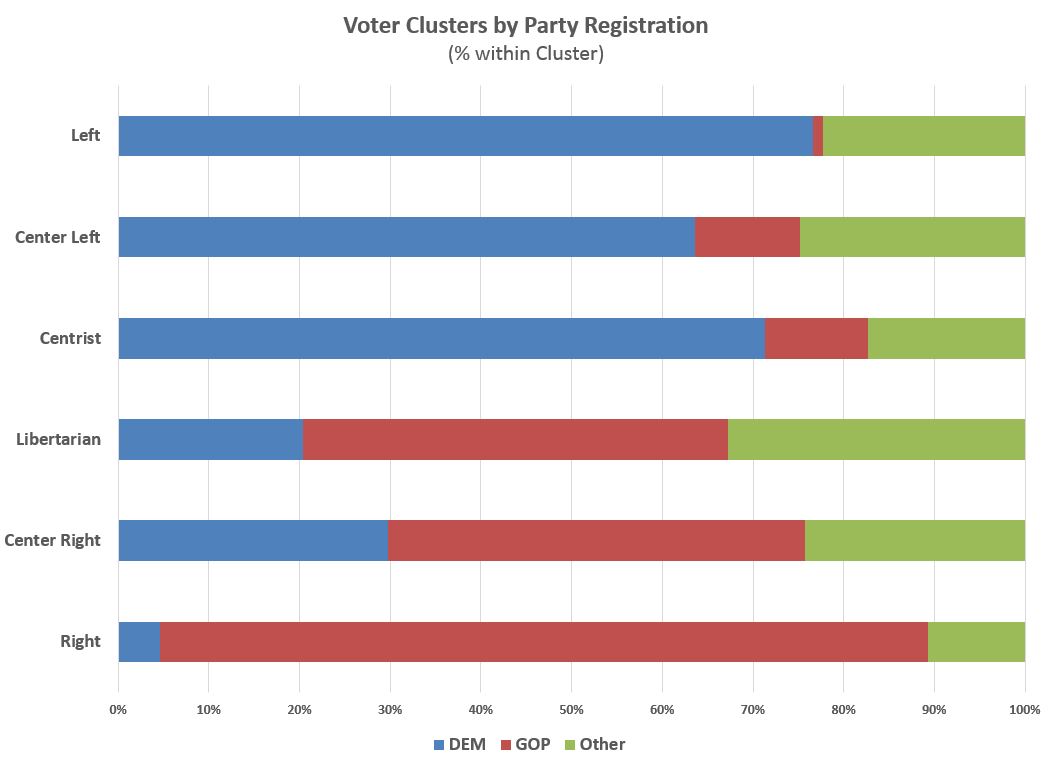
(Source: 2016 ANES; 3,649 respondents; max. margin of error = +/- 4.3%)
Figure 7 (below) further validates our segmentation and shows why Trump did as well as he did. Almost 20 percent of Centrists voted for Trump – a critical inroad for him given the closeness of the election — even though Clinton did even better among Libertarians than Trump did with Centrists. This was a close election and small marginal shifts affected its outcome.
When you look at these same clusters and how they voted in 2012, you see why Obama won in 2012 and Clinton lost in 2016 (see Figure 8 below). Obama held the center together much better than Clinton.
Figure 7: Voter Clusters by Presidential Vote (2016)
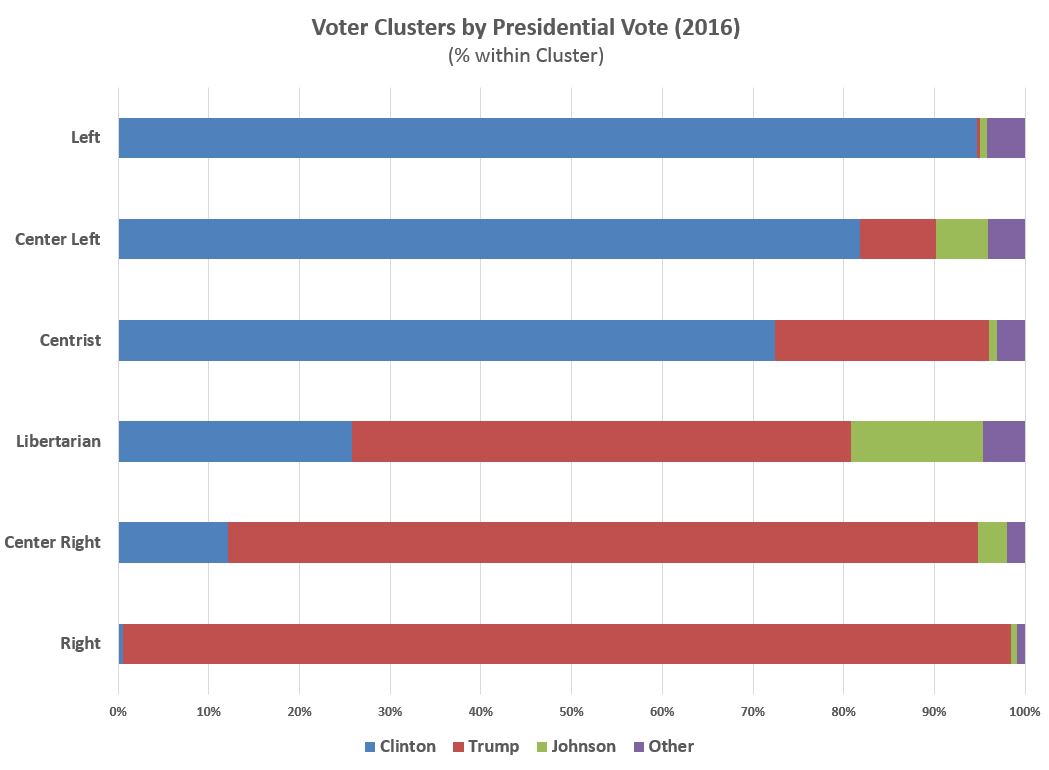
(Source: 2016 ANES; 3,649 respondents; max. margin of error = +/- 4.3%)
Figure 8: Voter Clusters by Presidential Vote (2012)
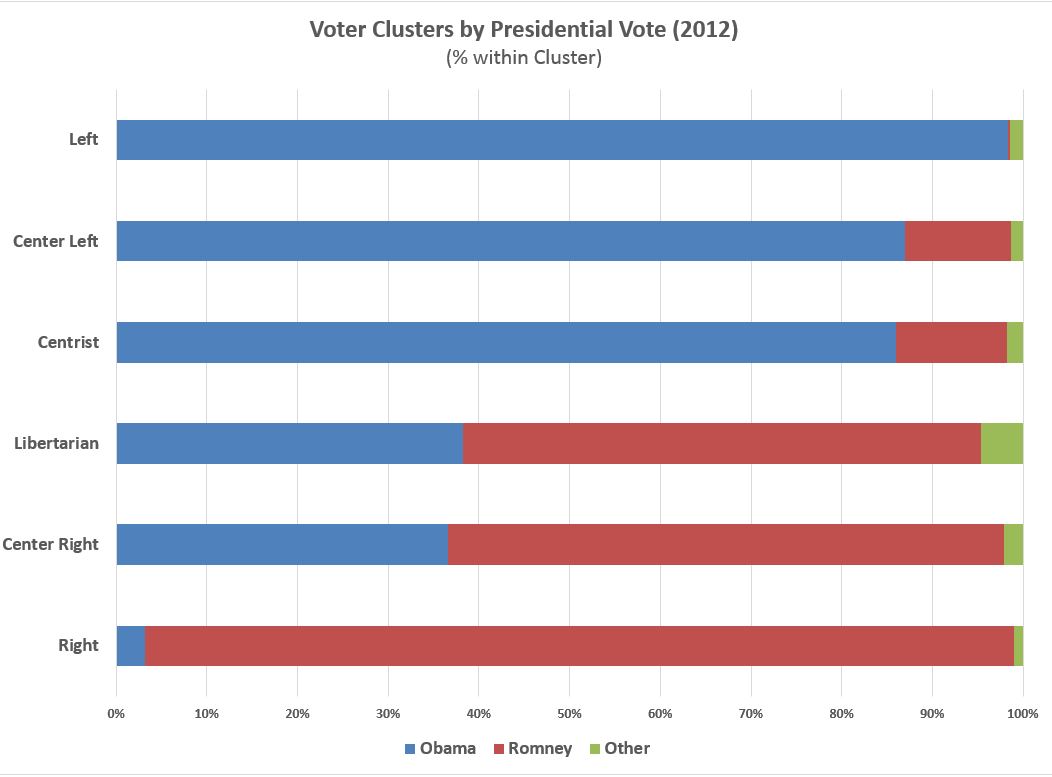
(Source: 2016 ANES; 3,649 respondents; max. margin of error = +/- 4.3%)
WHY DEMOCRATS MAY LOSE EVEN MORE CENTRISTS IN FUTURE ELECTIONS
Four issues addressed in the 2016 ANES highlight the significant risk facing the Democrats in future elections: Transgender bathroom law, abortion, marriage equality and immigration.
At risk is the support of Centrists, the majority of whom are African-American or Hispanic. No, they are not going to vote majority Republican. But their enthusiasm, which drives their voter turnout probabilities, is crucial to future Democratic victories. This fact cannot be over-emphasized: African-American and Hispanic voters are not liberals on social issues – they are centrists. In the aggregate, they hold too many opinions outside the acceptable parameters of the activist Left.
Figures 9 through 12 (below) give support to this conclusion. On the issues of transgender rights, abortion, marriage equality and Syrian refugees, Centrists have more in common with the Center-Right populists than they do with the Left. And its not close.
On the issue of transgender bathroom laws (Figure 9), 50 percent of centrists strongly support laws that say people should use the bathroom of the gender they were born with. That is comparable to the Center-Right (58%) opinion. Libertarians, in contrast, are closer to the Center-Left‘s opinion on the issue.
Figure 9: Voter Clusters by Attitudes Regarding Transgender Bathroom Issue
![]()
(Source: 2016 ANES; 3,649 respondents; max. margin of error = +/- 4.3%)
On marriage equality (Figure 10), a similar pattern emerges. Roughly 35 percent of Centrists say there should be no legal recognition of gay or lesbian marriages. That is similar to the Center-Right (27%) and Right (38%). And, again, Libertarians show more congruence with the Center-Left and Left on this issue.
Figure 10: Voter Clusters by Attitudes Regarding Marriage Equality
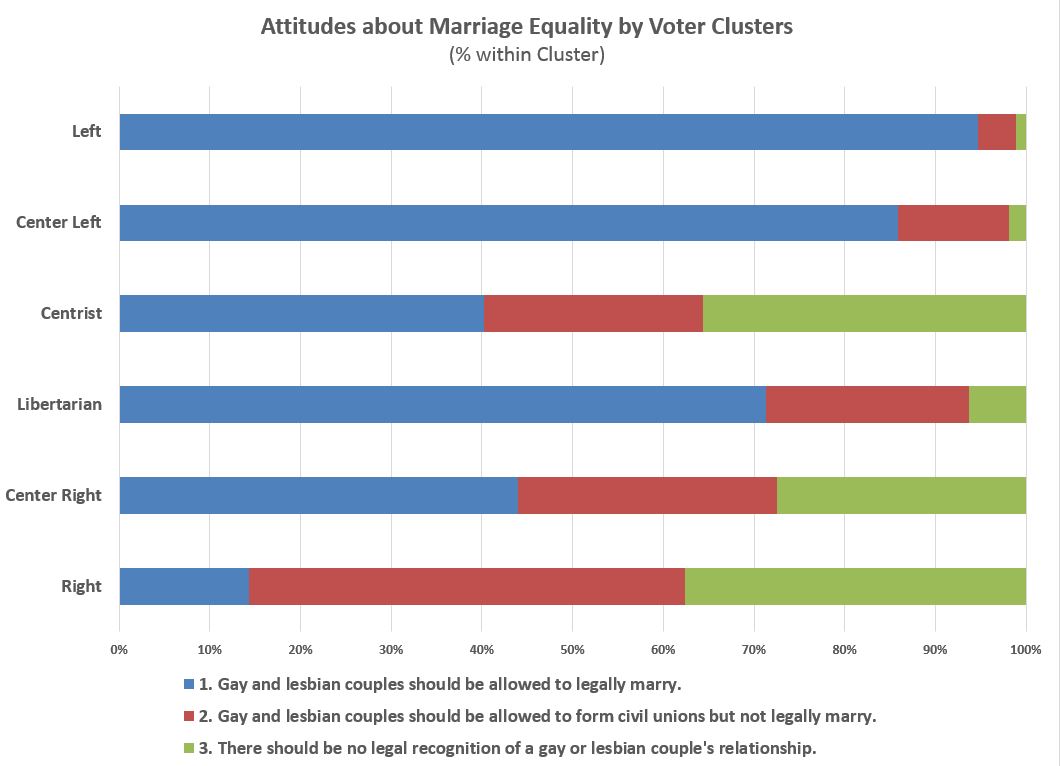
(Source: 2016 ANES; 3,649 respondents; max. margin of error = +/- 4.3%)
Abortion is an issue that some have argued has reached a consensus in this country. Americans, if they personally don’t approve of abortion, are not inclined to outlaw the practice. On the contrary, American’s generally support safe and affordable access to the procedure in most cases. Yet, there is a clear disconnect between the Left and Center-Left with Centrists where 25 percent say abortion should never be permitted. That level is closer to the Right‘s position (30% oppose abortion in all cases) than it is to even Center-Right position (15% oppose in all cases).
Are Hispanic Catholics going to split from the Democratic Party over this issue? We don’t think so. But given the party’s recent treatment one of Omaha’s Democratic mayoral candidates, Heath Mello, who had a mixed record on abortion rights, it also appears the party doesn’t tolerate diversity of opinion within its own ranks.
Figure 11: Voter Clusters by Attitudes Regarding Abortion
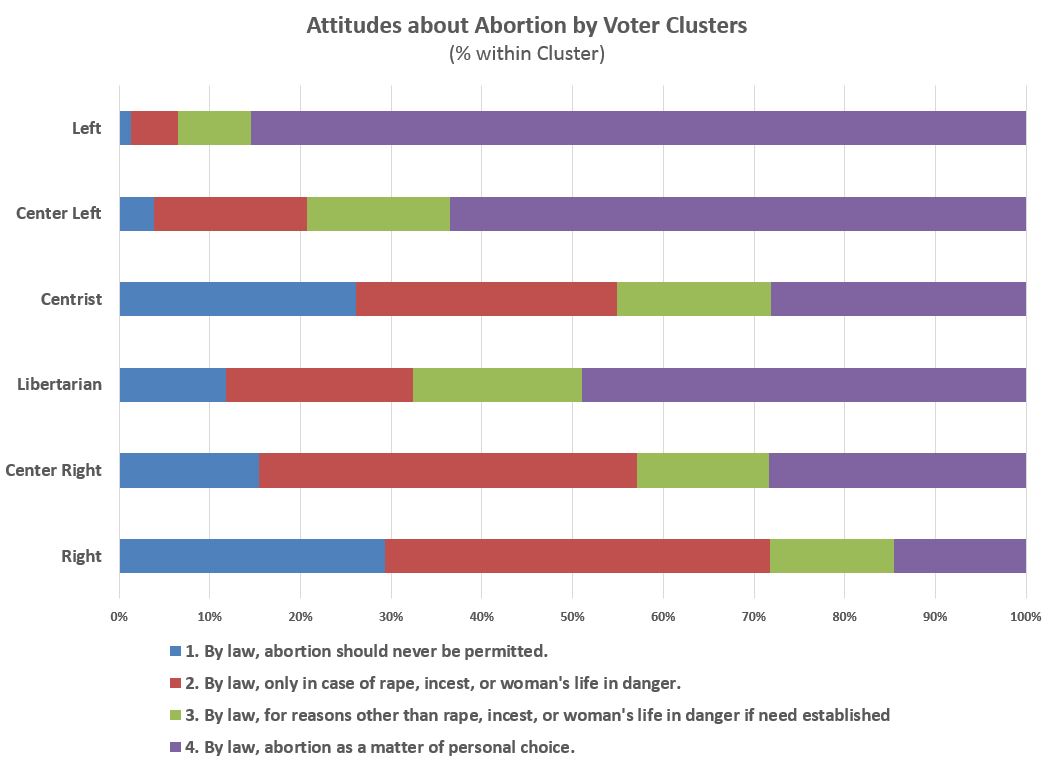
(Source: 2016 ANES; 3,649 respondents; max. margin of error = +/- 4.3%)
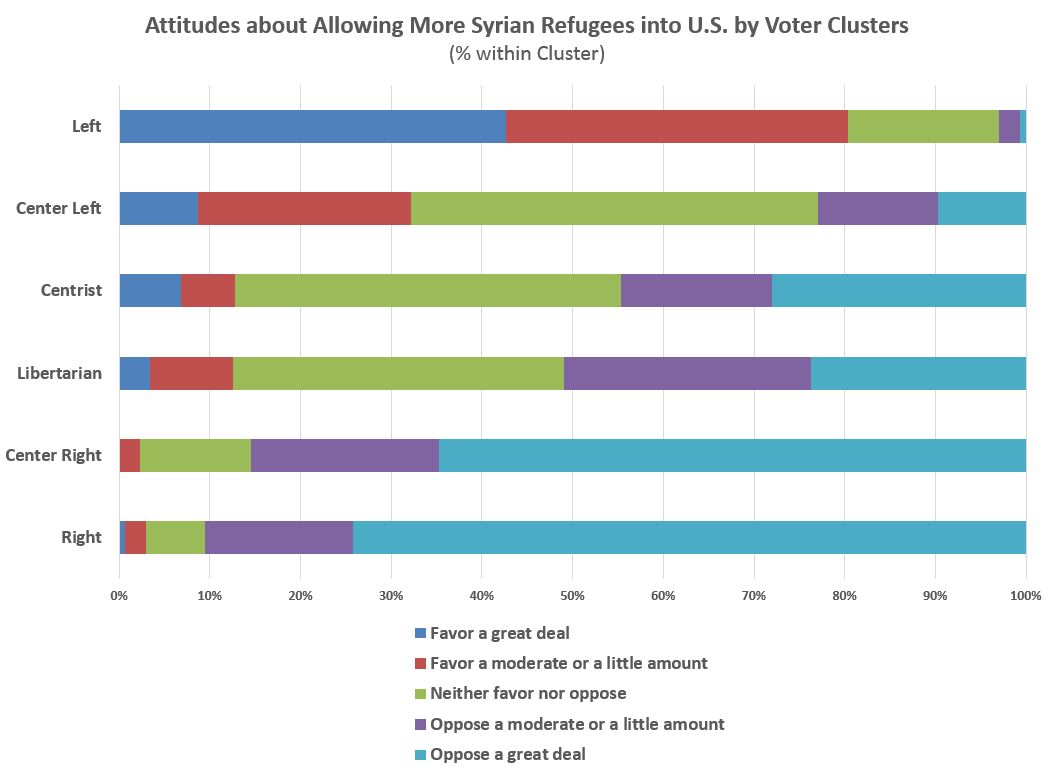
No issue demonstrates how disconnected the Left is from the rest of America as does the willingness to accept more Syrian refugees into the U.S. Eighty-percent of the Left supports allowing more Syrian refugees into the U.S. (see Figure 12). Only 32 percent of Center-Left voters and 12 percent of Centrists share that opinion. And I’ll let you guess where the Center-Right and Right come down on this issue.
Understand. I am not making an argument that the U.S. should stop accepting more Syrian refugees. This author absolutely is willing to stand against the majority opinion on this issue. Sometimes, right is right. George W. Bush, Barack Obama and Hillary Clinton (among others) created that mess and, in my opinion, it is our moral obligation to take on its consequences. That opinion, however, is not the opinion of most Americans. Its not even close.
The exercise presented here is to objectively assess the degree to which the ideological wing of the Democratic Party is in aligned with its own partisans and the American people in general. Since persuasion has become a lost art within both parties, assessing the party’s alignment with its core constituencies is critical to its future electoral success.
Figure 12: Voter Clusters by Attitudes Regarding Allowing More Syrian Refugees into U.S.
IS THE LEFT REALLY DISCONNECTED FROM MAINSTREAM OPINION?
Should the Democrats move to the Center? To answer this question, so far, we’ve grouped people with similar opinions on a wide range of issues and looked at their demographics, their voting behavior, and their opinions on a selection of issues.
But the Penn-Stein thesis requires more rigorous testing. First, does a two-dimensional ideology construct (Left-Right) represent the real world? That is, does it even make sense to talk about ‘moving to the center’?
Second, if the two-dimensional construct does offer some value, is the distance between the Left and the other voter segments large enough to suggest the Left needs to move closer to the center. Figures 13 to 17 are a preliminary attempt to address these two questions.
Third, do voters really choose candidates based on issues, or are other factors such as trust and likeability more important in their vote calculus? On this question, we will rely on previous research but NuQum.com’s own analysis of the 2016 ANES shows trust was the most powerful predictor of vote choice in the 2016 presidential race — though factors such as a voter’s party identification, presidential approval, economic assessments, and attitudes regarding Syrian refugees and transgender bathroom laws were also significant predictors.
MAPPING THE VOTER CLUSTERS BY MAJOR CAMPAIGN ISSUES
As mentioned earlier regarding our methodology, we clustered not only the voters in the 2016 ANES (6 clusters), we also clustered the issues into 18 sub-clusters that we further combined into five major issue clusters:
- Role of Government (social spending, deficits, role of gov’t in health care)
- Security (national defense, terrorism, crime, spending on police)
- Immigration (building a border wall, amnesty, importance of English)
- Civil Rights (marriage equality, gender equality, race relations)
- Climate change (belief in global warming, fracking, regulation)
If the Left-Right ideology spectrum is meaningful, we would expect the six voter clusters to fall predictably within the issue indexes, particularly the most ideologically consistent voter clusters (Left and Right). And that is what we find in the graphs below — though, with respect to Libertarians and Centrists, there was more variability in their mapping locations. On some issues (Role of Government), the Libertarians are more aligned with the Right. On other issues (Civil Rights), they are more aligned with the Left.
The Libertarian example suggests it takes more than two-dimensions to summarize public opinion. Nonetheless, if we look at Figure 13 as an example, two-dimensions still work pretty well. On immigration (the y-axis), the Left is far removed from the next closest cluster (Center-Left) on this issue. In this case, high scores on the y-axis indicate strong support for immigration policies that give illegal immigrants a path to citizenship and allow for more open immigration policies in general. The same is true for the security issue (x-axis), except now the Libertarians are closest to the Left, which is still far removed from the other five voter clusters.
Notice that the Right and Center-Right are very close to each other on both immigration and security, and both are far removed from the Libertarians, Centrists, and Center-Left. For the Republicans to gain a consensus on either issue, they will need significant support from Libertarians (and maybe even Centrists). The Left, on the other hand, has a tougher road ahead in building a consensus position on immigration and security.
Figure 13: Voter Clusters by Immigration and Security Dimensions
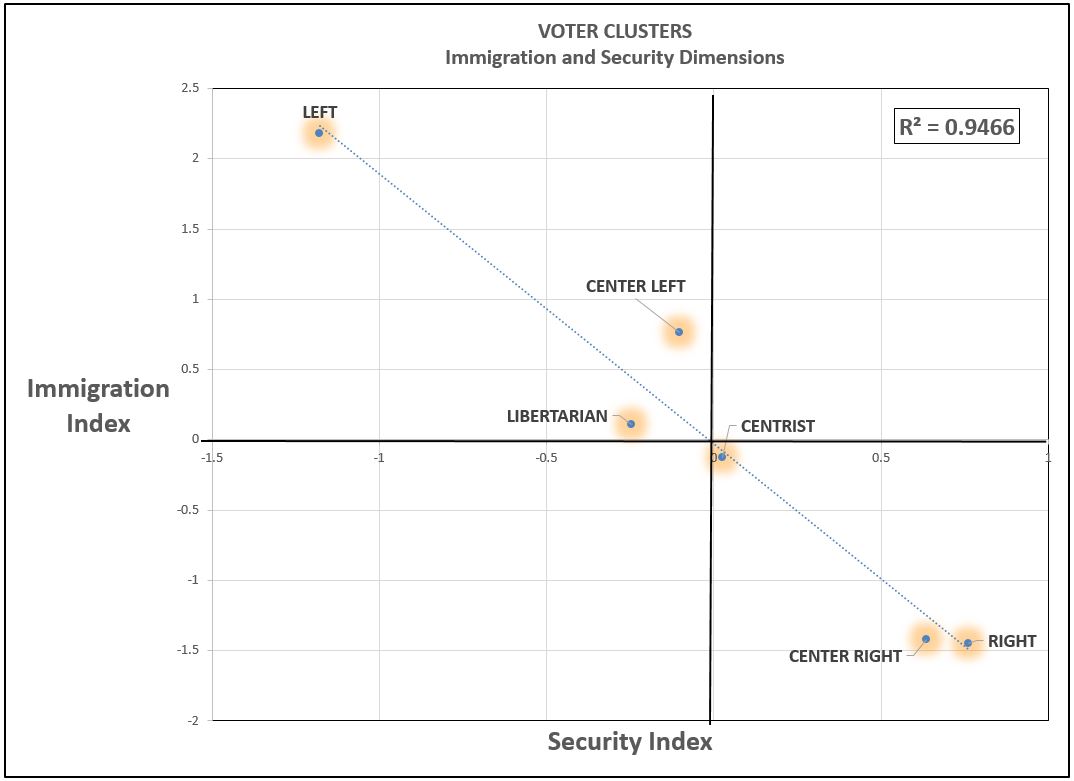
(Source: 2016 ANES; 3,649 respondents; analytics by NuQum.com)
Figure 14 is similar to Figure 13, only the Security Index has been replaced with the Civil Rights Index. It shows that the Right and Center-Right are still in alignment on civil rights issues and immigration and the Left is far removed from even the Center-Left on both indexes. The correlation of the voter clusters plotted by the Immigration and Civil Rights Indexes is 0.94, indicating support for the utility of the two-dimensional ideology construct.
Figure 14: Voter Clusters by Immigration and Civil Rights Dimensions

(Source: 2016 ANES; 3,649 respondents; analytics by NuQum.com)
Figure 15 looks at the relationship between the Role of Government and Civil Rights Indexes. Though the correlation remains high (0.76), there is a bit more scatter and the Libertarians are closer to the Right on the Role of Government Index. In contrast, the Center-Right, Centrists, and Center-Left are closer to the Left than they are to the Right.
This is good news for the Democrats.
Figure 15: Voter Clusters by Civil Rights and Role of Government Dimensions
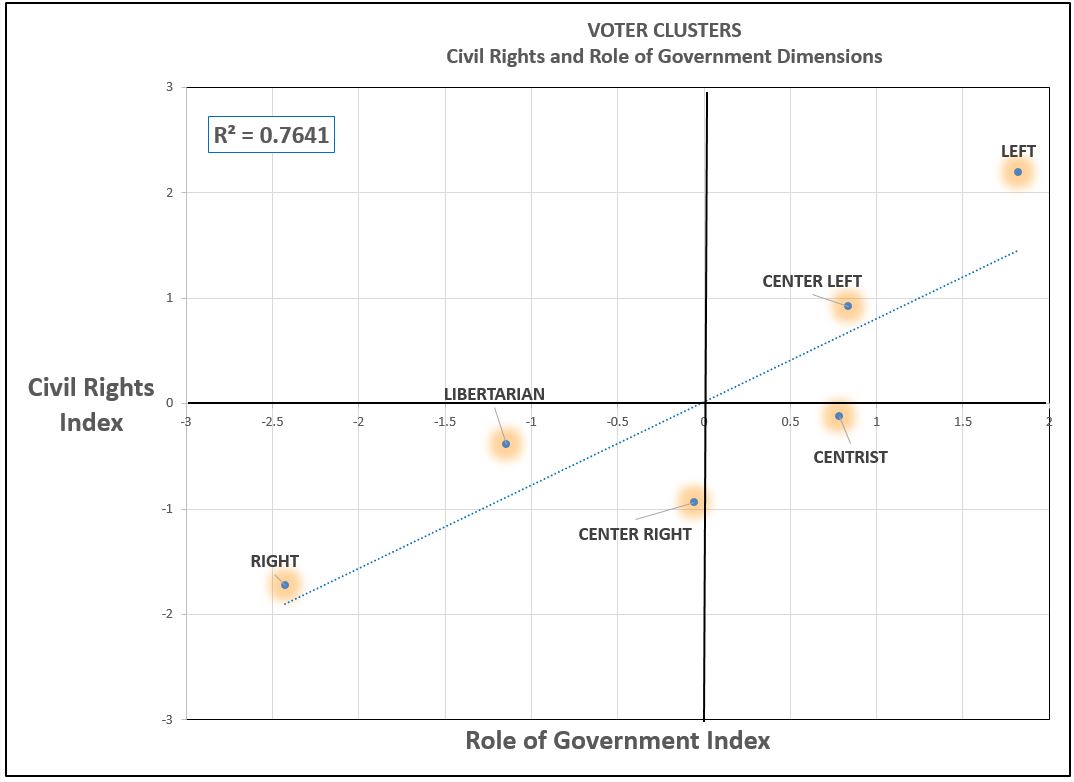
(Source: 2016 ANES; 3,649 respondents; analytics by NuQum.com)
Figure 16 may be the most intriguing of these bi-plot graphs as it shows the potential contradictions between security issues and the role of government. For many voters, it requires some intellectual gymnastics and perhaps a little temporary amnesia to rationalize support for big government with respect to security but dismiss its relevance on most other issues. Its certainly not impossible to believe the government is good at national defense, but not much else. But Figure 16 implies that rigid ideological arguments breakdown somewhat with respect to the guns versus butter debate.
Figure 16: Voter Clusters by Role of Government and Security Dimensions
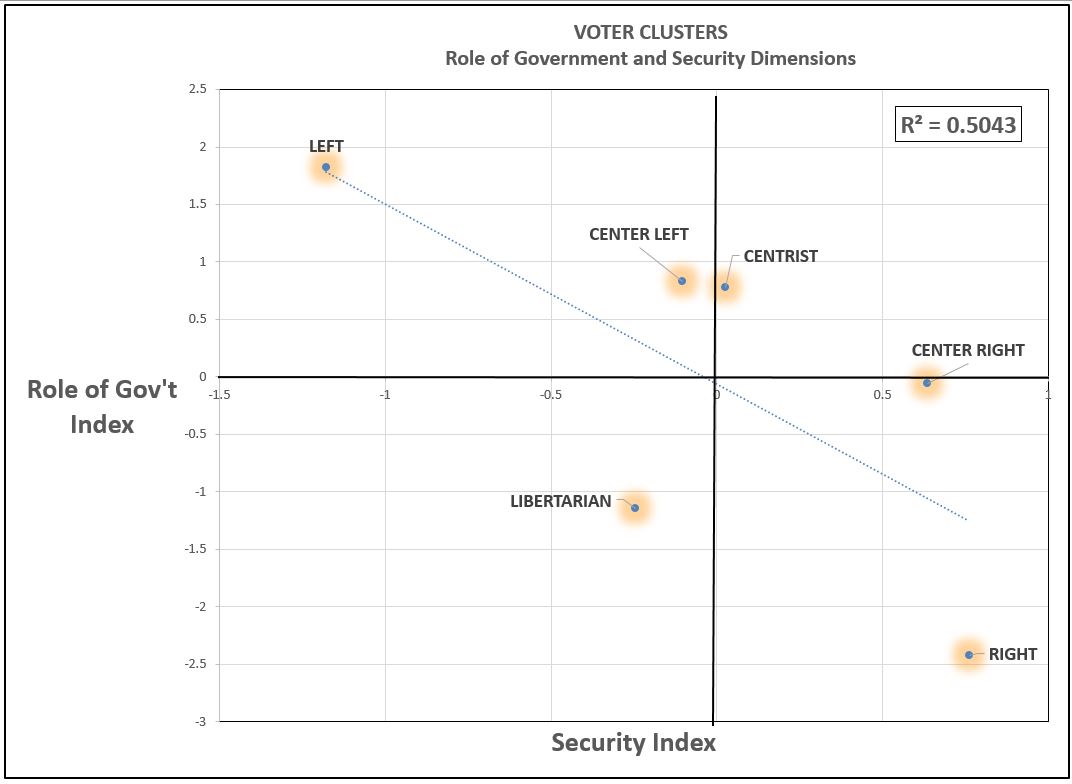
(Source: 2016 ANES; 3,649 respondents; analytics by NuQum.com)
Finally, ideological consistency returns in Figure 17 which plots the voter clusters by the Role of Government and Climate Change Indexes. The good news for Democrats here — and it really is good news — is that the Right is the most distant cluster from mainstream opinion on climate change. Now, if only the Democrats can make climate change policy an important factor in how people vote.
Figure 17: Voter Clusters by Role of Government and Climate Change Dimensions

(Source: 2016 ANES; 3,649 respondents; analytics by NuQum.com)
Though we haven’t addressed the relative importance of the various issues on how people vote, The Gallup Company provides a nice summary over time on that question. You can access their data here.
Generally, economic issues (jobs, economic growth) and national defense tend to emerge near the top of voters’ lists of most important issues. But those lists do vary by election year and the value of predicting what those “most important” issues will be cannot be underestimated. Ironically, with the current strong economy and significant progress in fighting ISIS, the 2018 midterms may see post-materialist issues like civil rights and climate change rise up on voters’ agenda, potentially benefiting the Democrats in addition to the likely importance of the ongoing Trump-Russia investigation and the effects of the health care debacle the Republican Congress is about to unleash on the American public.
WHAT ARE THE RISKS IN CENTRISM?
The Penn and Stein thesis carries a large assumption about the relationship between candidate’s issue positions and voters. This is called the ‘representative democracy’ model of voting. In making their vote decision, do voters line up the candidates’ issue positions with their own and choose the candidate closest to them on the most important issues?
It appears the answer is ‘yes’ — for most voters.
Political scientist Jon Krosnick, a leading expert on American voting behavior, says the political psychology research on American voters offers an optimistic conclusion about the American democracy. “Most Americans vote according to the principles of representative democracy,” says Krosnick. “but guardianship democracy and performance appraisal are (voting) approaches alive and well, too.”
A guardianship democracy is where voters vote for the most competent or intelligent candidate. In this case, trustworthiness and experience are drivers of vote decisions and, for some voters, their policy preferences may not be well-aligned with their preferred candidate. Performance appraisal voting is similar in that voters keep incumbents in office when things are going well (e.g., the economy) and vote for challengers when things aren’t going well.
So, can we conclude that Penn and Stein’s advice to the Democrats is built on the valid assumption that voters seek candidates they agree with on the most important issues?
Not so fast.
Recent research by Stanford’s Toni Rodon (here) offers evidence from European voting data that centrist voters are less likely to vote when the parties don’t show clear ideological differences. If the parties aren’t different enough, why vote? Though Rodon presents his conclusion as debunking conventional wisdom, Ronald Reagan’s pollster, Richard Wirthlin, discovered something similar over 40 years ago when Reagan was preparing to run against President Gerald Ford, a moderate Republican.
In his 1975 speech to Young Americans for Freedom, Reagan urged Republicans to “raise a banner, not of pale pastels, but bold colors.” His prescient observation rose from Wirthlin’s research showing many undecided voters, all else equal, are more attracted to candidates with a clear policy agendas.
If this voting dynamic is prevalent with a significant number of voters (and we think it is), it would argue against running centrist candidates and support the conclusion that the Democrats need to be the clear progressive alternative to the Republican Party.
This is a seductive argument and may help explain why “moderate” Democratic presidential candidates (Dukakis, Gore, Kerry, Hillary Clinton) failed to capture the imagination of enough American voters.
That is the challenge the Democrats will face if they choose to follow Penn and Stein’s advice. To make that move poorly could make the Democratic Party and its candidates appear indecisive and triangulating. That is not an attractive position to be in. Ask Hillary Clinton or John Kerry.
However, talented communicators like Bill Clinton and Barack Obama have proven the centrist strategy can work for Democrats. Americans will vote for candidates they disagree with on some important issues if that candidate presents a clear vision of where they want to lead this country.
But we have not seen any data that supports the conclusion that a political party can be too far outside mainstream opinion and consistently win elections at all levels of government. Unfortunately, that is where we think the Democrats stand today. They are out-of-sync, not just with independents, but with some of their core constituencies (African-Americans, Hispanics, and the working-class). On some issues, such as national security, abortion, and LGBTQ rights, these core constituencies are closer to the Republicans in their attitudes and policy preferences.
Should the Republicans ever learn how to exploit this fact, even the advantage the Democrats have going into the 2018 midterms could be in jeopardy. The good news for Democrats is that the Republicans have shown no ability or commitment to make this adjustment. If anything, the Trump presidency has set the Republican Party back in this regard.
Regrettably, too many Democrats are showing a similar disinterest in appealing to the moderate predispositions of a large proportion of their core supporters. It makes me think…somewhere…in some other dimension…Sam Kinison is screaming at the Democrats, MOVE TO THE VOTERS!
The 2016 ANES dataset, data dictionary, and computer codes (SAS JMP) used in this article are available upon email request to: kkroeger@nuqum.com
About the author: Kent Kroeger is a writer and statistical consultant with over 30 -years experience measuring and analyzing public opinion for public and private sector clients. He also spent ten years working for the U.S. Department of Defense’s Office of the Under Secretary of Defense for Personnel and Readiness and the Defense Intelligence Agency. He holds a B.S. degree in Journalism/Political Science from The University of Iowa, and an M.A. in Quantitative Methods from Columbia University (New York, NY). He lives in Ewing, New Jersey with his wife and son.