Category Archives: Opinion

Did analytics ruin Major League Baseball?

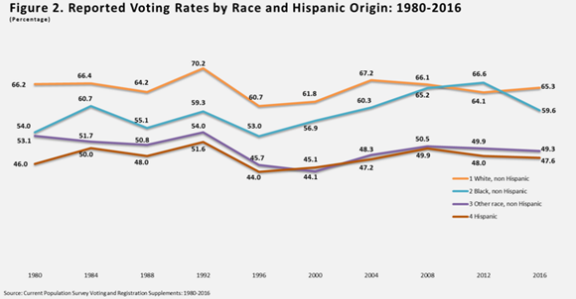
[Headline graphic: Billy Beane (left) and Paul DePodesta (right). The General Manager and assistant General Manager, respectively, for the 2002 Oakland A’s and who inspired Michael Lewis’ book, “Moneyball.” (Photo by GabboT; used under the CCA-Share Alike 2.0 Generic license.)]

By Kent R. Kroeger (Source: NuQum.com; November 25, 2020)

As he announced his resignation from the Chicago Cubs as that organization’s president of baseball operations in November, Theo Epstein, considered by many the High Priest of modern baseball analytics, made this shocking admission about the current state of baseball:

“It is the greatest game in the world but there are some threats to it because of the way the game is evolving. And I take some responsibility for that because the executives like me who have spent a lot of time using analytics and other measures to try to optimize individual and team performance have unwittingly had a negative impact on the aesthetic value of the game and the entertainment value of the game. I mean, clearly, you know the strikeout rates are a bit out of control and we need to find a way to get more action in the game, get the ball in play more often, allow players to show their athleticism some more and give the fans more of what they want.”

Epstein’s comments were painful for me on two fronts. First, he was leaving the only baseball team I’ve ever loved, having helped the Cubs win the only World Series championship of my lifetime. Second, he put a dagger in the heart of every Bill James and sabermetrics devotee who, like myself, have spent countless hours pouring through the statistical abstracts for Major League Baseball (MLB) and the National Football League on a quest to build the perfect Rotisserie league baseball team and fantasy football roster.

There is no better feeling than the long search and discovery for those two or three “value” players who nobody else thinks about and who can turn your Rotisserie or fantasy team into league champs.

In a direct way, sports analytics are the intellectual steroids for a generation of sports fans (slash) data geeks who love games they never played beyond high school, if even then.

Epstein’s departure was not entirely a surprise. The Cubs have not come close to their glorious World Series triumph in 2016—though it has to pin that on Epstein. The Cubs still have (when healthy) one of the most talented rosters in baseball. Instead, the surprise was Epstein’s targeting ‘analytics’ has one of the causes of baseball’s arguable decline.

Like many baseball fans, I’ve assumed baseball analytics—immortalized in Michael Lewis’ book “Moneyball” about the 2002 Oakland A’s and its general manager Billy Beane, who hired  a Yale economics grad, Paul DePodesta, to assist him in building a successful small market (i.e., low payroll) baseball team—helped make the MLB, from top-to-bottom, more competitive.

In the movie based on Lewis’ book, starring Brad Pitt and Jonah Hill, this scene perfectly summarizes the value of analytics in baseball (and, frankly, could apply to almost every major industry):

Peter Brand (aka. Paul DePodesta, as played by Jonah Hill):

“There is an epidemic failure within the game to understand what is really happening and this leads people who run major league baseball teams to misjudge their players and mismanage their teams…

…People who run ball clubs think in terms of buying players. Your goal shouldn’t be to buy players. Your goal should be to buy wins, and in order to buy wins you need to buy runs.

The Boston Red Sox see Johnny Damon and they see a star who’s worth seven-and-a-half million dollars. When I see Johnny Damon what I see is an imperfect understanding of where runs come from. The guy’s got a great glove and he’s a decent lead-off hitter. He can steal bases. But is he worth seven-and-a-half million a year?

Baseball thinking is medieval. They are asking all the wrong questions.”

While Beane and DePodesta may have lacked world championships after they introduced analytics into the process, the A’s did have nine winning seasons from 2002 to 2016 during their tenure, which is phenomenal for a small-market, low-payroll team.

At the team-level, the 21st-century A’s are the embodiment of how analytics can help an organization.

But is Epstein still right? Has analytics hurt baseball at the aggregate level?

Let us look at the facts…

Major League Baseball has a Problem

Regardless of the veracity of Epstein’s indictment of analytics for its net role in hurting the game of baseball, does professional baseball have a problem?

The answer is a qualified ‘Yes.’

These two metrics describe the bulk of the problem: (1) Average per game attendance and (2) World Series TV viewership. Since the mid-1990s, baseball game attendance relative to the total U.S. population has been in a near constant decline, going from a high of 118 game attendees (per 1 million people) in the mid-1990s to 98 game attendees (per 1M) in the late 2010s (see Figure 1). At the same time, the long-term trend is still positive. That cannot be discounted.

Figure 1: MLB per game attendance (per 1 million people) (Source: baseball-reference.com)

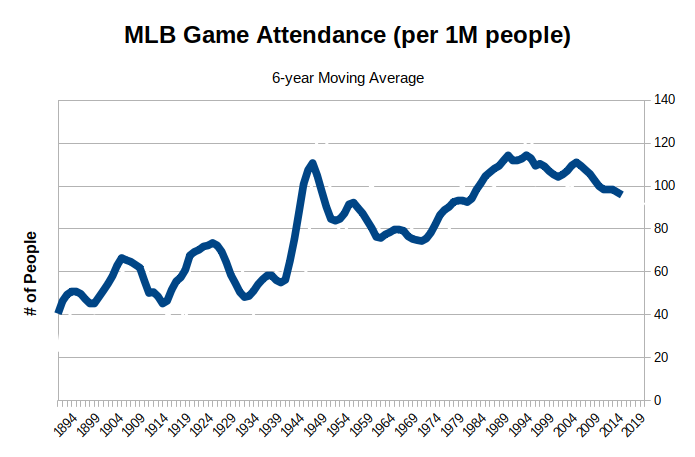
While the relative decline is significant, the real story of MLB attendance since the league’s inception in the late-19th century is the surge in attendance after World War II, a strong decline after that until the late-1960s, and a resurgence during the 1970s and 80s. In comparison, the attendance decline per capita since the mid-1990s has been relatively small.

Consider also that despite a per capita decline in game attendance since the 1990s, total season attendance has still grown. In 1991, 56.8 million MLB tickets were sold; by 2017, 72.7 million tickets were sold. This increase in gross ticket sales has been matched by a steady rise in MLB ticket prices as well. The average cost of an MLB baseball game in 1991 was $142, but by 2017 that figure increased to $219 (a 176 percent increase). In that context, the 15 to 20 percent decline in game attendance (per capita) seems more tolerable and far from catastrophic. In fact, if it weren’t for this next metric, baseball might be in great shape, even if its relative popularity is in decline.

The TV ratings and viewership for MLB’s crown jewel event, the World Series, has been in a near straight-line decline since the mid-1970s when Billy Martin’s New York Yankees and the Tommy Lasorda-led Los Angeles Dodgers were the sport’s dominant franchises, and happened to be in this nation’s two largest cities. Big market teams in the World Series is always good for TV ratings.

As seen in Figure 2, average TV viewership for the World Series (the orange line) has declined from a high of 44.3 million in 1978 (Yankees vs. Dodgers) to just under 9.8 million in the last World Series (Dodgers vs. Rays).

Figure 2: The TV Ratings and Viewership (average per game) for the World Series since 1972 (Source: Nielsen Research)

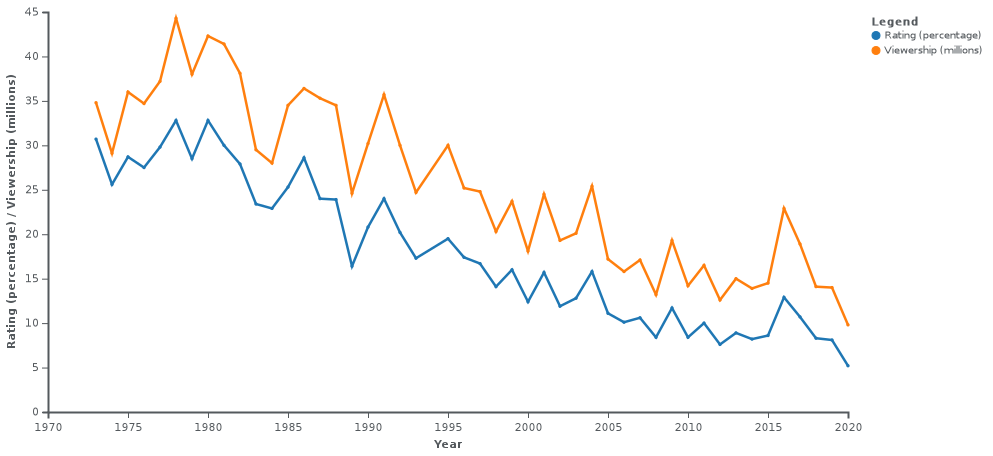
Even with the addition of mobile and online streaming viewers—-which lifts the 2020 World Series viewership number to 13.2 million—the decline in the number of eyeballs watching the World Series since the 1970s has been dramatic.

In combination with the trends in game attendance, the precipitous decline in live viewership offers one clear conclusion: Relatively fewer people are going to baseball games or watching the them on TV or the internet. That’s a formula for an impending financial disaster among major league baseball franchises.

While stories of baseball’s imminent death are exaggerated, baseball does have serious problems. But what are they exactly? And how has analytics impacted those probable causes?

Are baseball’s problems bigger than the game itself?

Before looking within the game of baseball itself (and the role of analytics) to explain its relative popularity decline, we must consider the broader context.

Sports fans today demand something different from what MLB offers

Living with a teenage son who loves the NBA and routinely mocks my love of baseball, I see a generational divide that will challenge any attempt to update a sport once considered, without debate, to be America’s pastime. Kids (and. frankly, many of their parents) don’t have the patience or temperament to appreciate the deep-rooted intricacies of a game where players spend more time waiting than actually playing. Only 10 percent of a baseball game involves actual action, according to one study. For kids raised on Red Bull and Call of Duty, baseball is more like a horse and buggy than a Bugatti race car.

And the in-game data supports that assertion. In 1970. a nine-inning major league baseball game took, on average, two-and-a-half hours to complete. In 2020, it takes three hours and six minutes. By comparison, a World Cup soccer match takes one hour and 50 minutes from the moment the first whistle blows. An NBA game takes about two-and-a-half hours.

Baseball is too slow…and getting slower.

[For a well-constructed counterargument to the ‘too slow’ conclusion, I invite you to read this essay.]

In contrast, the NBA and World Cup soccer possess near constant action. Throw in e-games (if you consider those contests a sport) and it is reasonable to conjecture that baseball is simply a bad fit for the times. Even NFL football, whose average game takes over three hours, has challenges in that regard.

Did analytics lead to longer baseball games? Let us examine the evidence.

Figure 3 shows the long-term trend in the length of 9-inning MLB games divided into baseball ‘eras’ as defined by Mitchell T. Woltring, Jim K. Rost, Colby B. Jubenville in their 2018 research paper published by Sports Studies and Sports Psychology. They identified five distinct eras in major league baseball: (1) “Dead Ball” (1901 to 1919), (2) “Live Ball” (1920 to 1941), (3) “Integration” (1942 to 1960), (4) “Expansion” (1961 to 1976), (5) “Free Agency” (1977 to 1993), (6) “Steroids” (1994 to 2005) and (7) “Post-Steroids” (2006 to 2011). However, for this essay, I relabeled their ‘post-Steroids era’ as the ‘Analytics era’ and extended it to the present.

(Note: MLB game length was not consistently measured until the “Integration era.”)

Figure 3: Average length of a 9-inning MLB game since 1946.

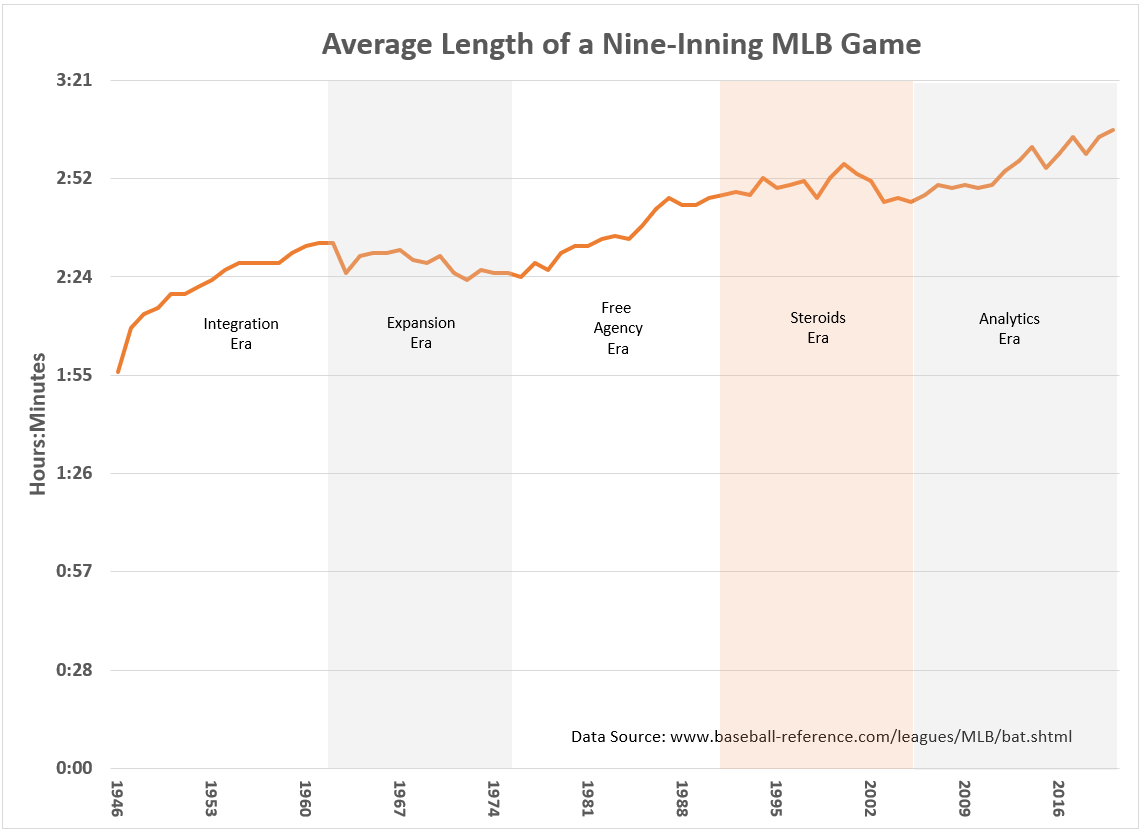
Though I will share upon request the detailed statistical analysis of the intervention effects of the baseball eras on the average length of MLB games, the basic findings are straightforward:

(1) The average length of 9-inning MLB games significantly increased during the ‘Integration,’ ‘Free Agency,’ and ‘Analytic’ eras, but did not increase during the ‘Expansion’ and ‘Steroids’ eras.

(2) The long-term trend was already pointing up before the ‘Analytics era’ (+50 seconds per year), though analytics may have had a larger marginal effect on game length (+78 seconds per year).

As to why the ‘Analytics era’ saw an increase in game times, one suggested explanation is that the ‘Steroids era’ disproportionately rewarded juiced-up long-ball hitters who tended to spend less time at the plate. In contrast, though the ‘Analytics era’ also has emphasized home run hitting, the players hitting home runs are now more patient. According to baseball writer Fred Hofstetter, pitchers have also changed:

“This (increase in game times) won’t surprise anyone who follows the game closely. The general demographic change trending into 2020:

  1. Patient hitters are replacing free swingers
  2. Hard-throwing strikeout-getters are replacing pitch-to-contact types

Pitchers who throw harder tend to take more time between pitches.9 Smart hitters take more pitches. There are more pitches with more time between them. The result is a rising average of time between pitches.”

Are these changes in the game related to analytics? It is hard to know given the concurrent (and assumed) decline in steroid use in the 2000s MLB, but the apparent consensus is that the pitcher-batter dynamics since 2000 have been more sophisticated and time-consuming than during the ‘Steroid era.’

My conclusion on the impact of analytics on the length of MLB baseball games: Unclear.

Are there other aspects of baseball affected by analytics?

Investigating the role of analytics in 21st century baseball is complicated by the confounding effects of other changes going on in the game around the same time — the most obvious being MLB’s increased enforcement of its performance enhancing drug policies. But sports writer Jeff Rivers notes another ongoing trend: this country’s best athletes are increasingly choosing football and basketball over baseball, though this trend may have been going on for some time.

“Major League Baseball used to offer its athletes the most prestige, money and fame among our nation’s pro team sports, but that hasn’t been true for decades,” writes Rivers. “Consequently, Major League Baseball continues to lose in the competition for talent to other major pro team sports.”

It is also possible analytics have exacerbated this supposed decline in athlete quality by discouraging some of baseball’s most exciting plays.

“The focus on analytics in pro sports has led to more scoring in the NBA…but fewer stolen bases and triples, two of the game’s most exciting plays, in pro baseball,” asserts Rivers.

Is there really a distinct ‘Analytics era’ in baseball?

Another problem in assessing the role of baseball analytics is that the ‘Analytics era’ (what I’ve defined as 2006 to the present) may not be that distinct.

Henry Chadwick invented the baseball box score in 1858 and, by 1871, statistics were consistently recorded for every game and player in professional baseball. In 1964, Earnshaw Cook published his statistical analysis of baseball games and players and seven years later the Society for American Baseball Research (SABR) was founded.

In the early 1970s, as statistics advanced as a topic among fans, Baltimore Orioles player Davey Johnson was writing FORTRAN computer code on an IBM System/360 to generate statistical evidence supporting his belief that he should bat second in the Orioles lineup (his manager Earl Weaver was not convinced, however).

In 1977, Bill James published his first annual Baseball Abstracts which, through the use of complex statistical analyses, argued that many of the popular performance metrics — such as batting average — were poor predictors of how many runs a team would score. Instead, James and other SABRmetricians (as they would be called) argued that a better measure of a player’s worth is his ability to help his team score more runs than the opposition. Instead, the SABRmetricians initially preferred metrics such as On-Base Percentage (OBP) and Slugging Percentage (SLG) to judge player values and would later prefer combining those metrics to create the On-base Plus Slugging (OPS) performance metric.

[Note: OBP is the ratio of the batter’s times-on-base (TOB) (which is the sum of hits, walks, and number of times hit by pitch) to their number of plate appearances. SLG measures a batter’s productivity and is calculated as total bases divided by at bats. OPS is simply the sum of OBP and SLG.]

Batting averages and pitchers’ Earned-Run-Averages (ERA) have been a systematic part of player evaluations since baseball’s earlier days. Modern analytics didn’t invent most of the statistics used today to assess player value, but merely refined and advanced them.

Nonetheless, there is something fundamentally different in how MLB players values are assessed today than in the days before Billy Beane, Paul DePodesta and Moneyball.

But when did analytics truly take over the talent acquisition process in major league baseball? There is no single, well-defined date. However, many baseball analysts point to the 2004 Boston Red Sox, whose general manger was Theo Epstein, as the first World Series winner to be significantly driven by analytics.

Something unique and profound was going on in major league baseball’s front offices from the time between Billy Beane’s 2002 A’s and the Boston Red Sox’ 2007 World Series win, their second championship in four years.

By 2009, most major league baseball teams had a full-time analytics staff working in tandem with their traditional scouting departments, according to Business Administration Professor Rocco P. Porreca.

So, why did I pick 2006 as the start of the ‘Analytics era’? No definitive reason except that is roughly the halfway point between the release of Lewis’s book Moneyball and 2009, the point at which most major league baseball teams had stood up a formal analytics department. It would have been equally defensible to set 2011 or 2012 as the starting point for the ‘Analytics era’ as many of the aggregate baseball game measures we are about to look at changed direction at around that time.

The Central Mantra of Baseball Analytics: “He get’s on base”

Lewis’ book Moneyball outlined the baseball player attribute 2002 A’s assistant general manger Paul DePodesta’s sought after most when evaluating talent: Select players that can get on base.

This scene from the movie Moneyball drives home that point:

As the 2002 A’s scouting team identify acquisition prospects, the team’s general manger, Billy Beane singles out New York Yankees outfielder David Justice:

A’s head scout Grady Fuson:  Not a good idea, Billy.

Another A’s scout:  Steinbrenner’s so pissed at his decline that he’s willing to eat a big chunk of his contact just to get rid of him.

Billy Beane:  Exactly.

Fuson: Ten years ago, David Justice—big name. He’s been in a lot of big games. He’s gonna really help our season tickets early in the year, but when we get in the dog days in July and August, he’s lucky if he’s gonna hit his weight…we’ll be lucky if we get 60 games out of him. Why do you like him?

[Beane points at assistant general manager Peter Brand (aka. Paul DePodesta)]

Peter Brand: Because he get’s on base.

This was the fundamental conclusion analytic modelers started driving home to a growing number of baseball general managers after 2002.  Find players that can get on base.

And Theo Epstein was among the first general managers to drink the analytics Kool-Aid and he did it while leading one of baseball’s richest franchises — the Boston Red Sox. Shortly after the 2002 World Series, the Red Sox hired the 28-year-old Epstein, the youngest general manager in MLB history, to help them end their 86-year World Series drought. Two years later, the Red Sox and Epstein did just that, and one of the reasons cited for the Red Sox success was Epstein’s use of analytics for player evaluations. Eventually, Epstein would take his analytics to the Chicago Cubs in 2011, who then ended their 108-year championship drought five years later.

Until Epstein’s departure from the Cubs, there has been scant debate within baseball about the value of analytics. Almost every recent World Series champion– the Red Sox, Cubs, Royals, Astros, and others — has an analytics success story to tell. By all accounts, its here to stay.

So why on his way out the door in Chicago did Epstein throw a verbal grenade into the baseball fraternity by suggesting analytics have had “a negative impact on the aesthetic value of the game and the entertainment value of the game.” And he specifically cited the responsibility of analytics for the recent rise in strikeouts, bases-on-balls, and home runs (as well as a decline in stolen bases) as the primary cause of baseball’s aesthetic decline.

Is Epstein right? The short answer is: It is not at all clear baseball analytics are the problem, even if it did change the ‘aesthetics’ of the game.

A brief look at the data…

As a fan of baseball, I find bases-on-balls and strike outs near the top of my list of least favorite in-game outcomes.

But when we look at the long-term trends in walks and strike outs, its hard to pin the blame on analytics (see Figure 4). Strike outs in particular have been on a secular rise since the beginning of organized baseball in the 1870s, with only three periods of sustained decreases — the ‘Expansion era,’ ‘Live Ball’ and ‘Steroid’ eras. The ‘Analytics era’ emphasis on hard-throwing strike out pitchers over slower-throwing ‘location’ pitchers may be working (strike outs have gone from 6 to 9 per team per game), but it is part of baseball’s longer-term trend — baseball pitchers have become better at striking out batters since the sport’s beginning. The only times batters have caught up with pitching is when either the baseball itself was altered (“Live Ball era”), pitching talent was watered down (“Expansion era”) or the batters juiced up (“Steroids era”).

As for the rise in bases-on-balls, there is evidence of a trend reversal around 2012, with walks rising sharply between 2012 and 2020, the heart of the ‘Analytics era.’ At least tentatively, therefore, we can conclude one excitement-challenged baseball event has become more prominent, but even in this case, the current number of walks per team per game (= 3.5) is near the historical average. At the bases-on-balls peak in the late-1940s, baseball was at its apex in popularity and MLB attendance declined as bases-on-balls plummeted through the 1950s (see Figure 1).

Figure 4: Trends in Bases-on-Balls and Strike Outs in Major League Baseball since 1871.

It is difficult to blame baseball’s relative decline in popularity on increases in strike outs and walks or the role of analytics in those in-game changes.

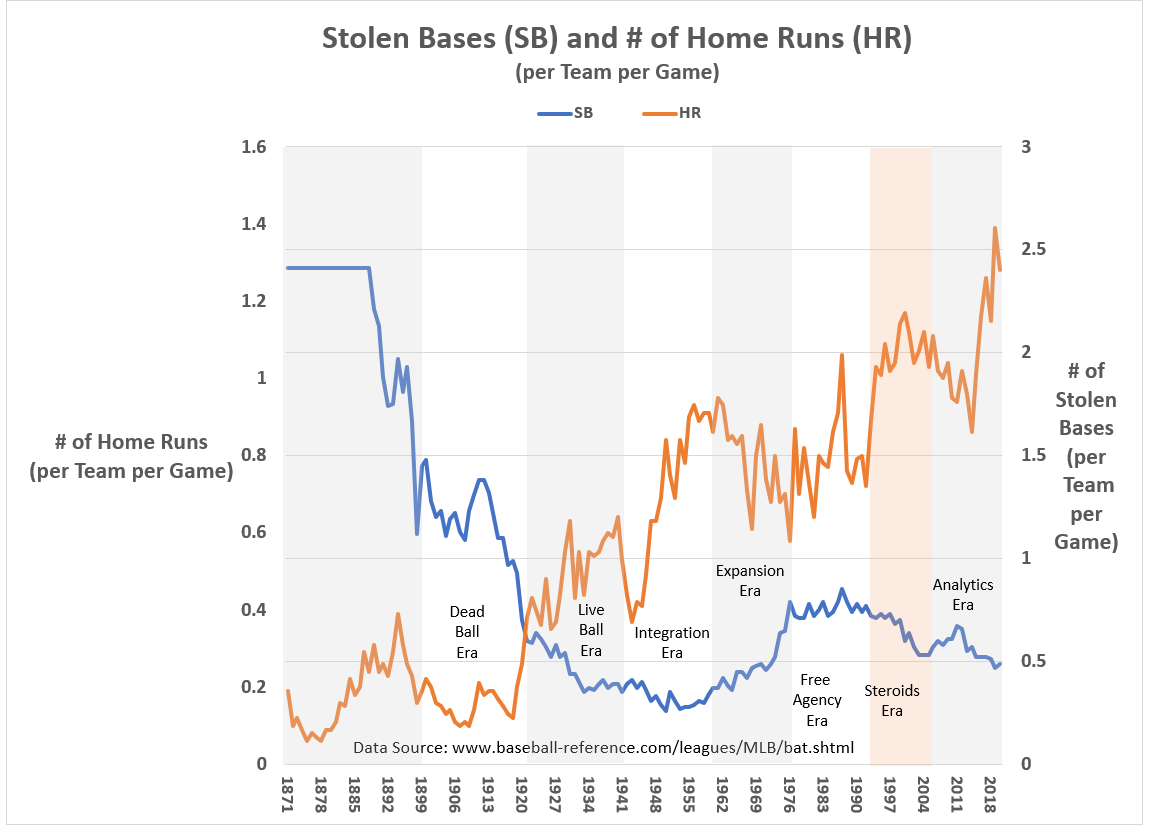
But what about two of baseball’s most exciting plays — stolen bases and home runs? According to Epstein, the analytics-caused decline in stolen bases and concomitant rise in home runs has robbed the game of crucial action which help drive fan excitement.

As shown in Figure 5, there is strong evidence that the ‘Analytics era’ has seen a reversal in trends for both stolen bases and home runs. Since 2012, the number of home runs per team per game has risen from 0.9 to 1.3, and the number of steals per team per game has fallen from 0.7 to 0.5.

Stolen bases may be a rarity now in baseball, but they’ve never been common since the ‘Live Ball era,’ having peaked around 0.9 per team per game in the late 1980s. In truth, stolen bases have never been a big part of the game.

Home runs are a different matter. Epstein’s complaint that there are, today, too many home runs in baseball is a puzzling charge. In 45 years as a baseball fan, I’ve yet to hear a fan complain that his or her team hit too many home runs.

Yes, home runs eliminate some of the drama associated with hitting a ball in play — Will the batter stretch a single into a double or a double into a triple? Will the base runner go for third or for home? — but do those in-game aesthetics create more adrenaline or dopamine than the anticipation over whether a well hit ball will go over the fence? I, personally, find it hard to believe that too many home runs are hurting today’s baseball.

But is Epstein right in saying analytics may have played a role in the recent increases in home runs. The answer is an emphatic yes.

As the MLB worked to remove steroids from the game in the late 1990s, the number of home runs per game dropped dramatically…until 2011. As the ‘Analytics era’ has become entrenched in baseball, home runs have increased year-to-year as fast as they did during the heyday of steroids, rising from 0.9 per game per team in 2011 to 1.3 in 2020. In an historical context, professional baseball has never seen as many home runs as it does today.

However, again, in the long-term historical context, the ‘Analytics era’ is just continuing a trend that has existed in baseball since its earliest days. Most batters have always coveted home runs and all pitchers have loathed them — analytics didn’t cause that dynamic.

Figure 5: Trends in Stolen Bases and Home Runs in Major League Baseball since 1871.

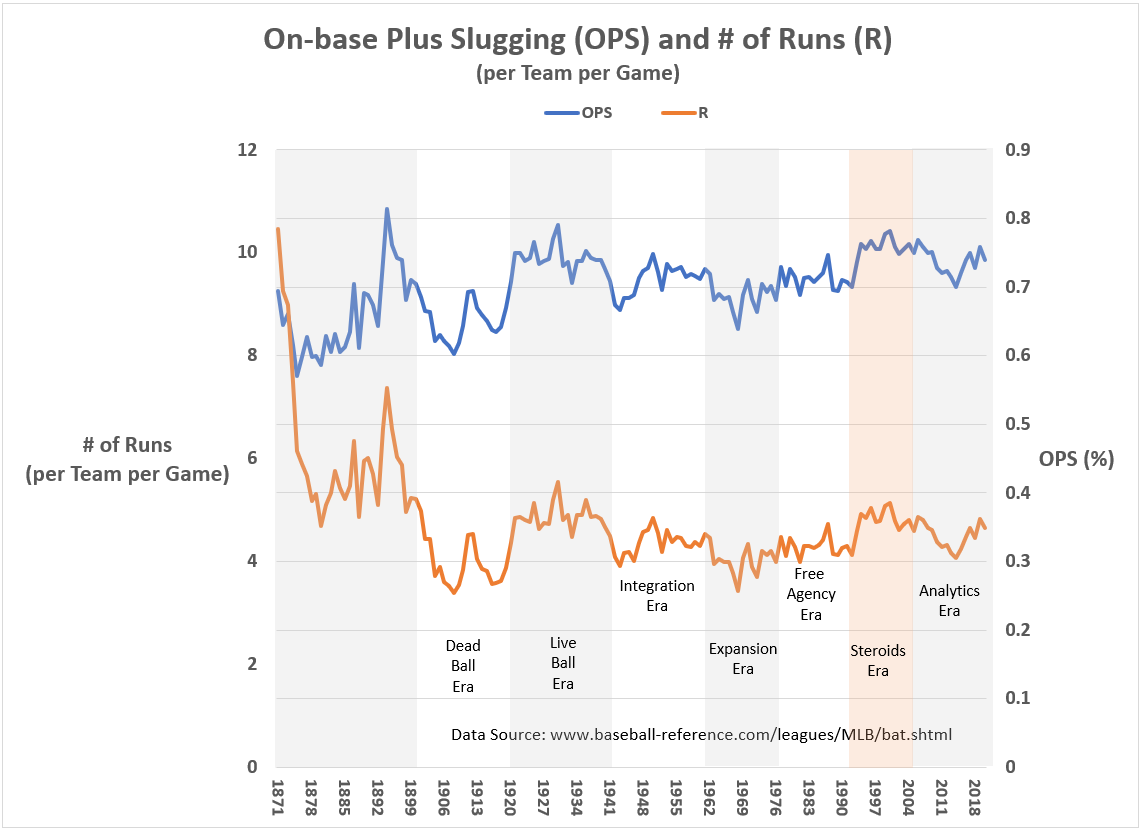
The holy grail of baseball analytic metrics is On-base Slugging (OPS) — a comprehensive measure of batter productivity that incorporates more information about how often a batter has multiple base hits.

(and from a defensive perspective, an indicator of how well a team’s pitching and fielding lineup stunts batter productivity).

The highly-regarded OPS is important to baseball analytic gurus because of its strong correlation with the proximal cause of why teams win or lose: The number of runs they score.

Since 1885, the Pearson correlation between OPS and the number of runs per game is 0.56 (which is highly significant at the two-tailed, 0.05 alpha level). And it is on the  OPS metric that the ‘Analytics era’ has made a surprisingly modest impact, hardly large enough to be responsible for harming the popularity of baseball (see Figure 6). If anything, shouldn’t a higher OPS in the aggregate indicate a more exciting type of baseball, even if it includes a larger number of home runs?

Prior to the ‘Analytics era,’ the ‘Steroids era’ (1994 to 2005) witnessed a comparable surge in OPS (and home runs) and the popularity of baseball grew, at least until stories of steroids-use became more prominent in sports media.

Figure 6: Trends in On-base Plus Slugging (OPS) and # of Runs in Major League Baseball since 1871.

Epstein’s pinning baseball’s current troubles on analytics begs the question of what other factors could also be explaining some of the recent changes in the game’s artfulness. These in-game modifications cannot all be dropped at the feet of analytics. The slow pruning out of steroids from the game, shifts in baseball’s young talent pool, the changing tastes of American sports fans, and the growth in other sports entertainment options cannot be ignored.

Final Thoughts

Baseball has real problems, particularly with the new generation of sports fans. The MLB should not under-estimate the negative implications of this problem.

However, the sport is not dying and analytics is not leading it towards a certain death. Analytics did not cause baseball’s systemic problems.

For those who assume major league baseball is a sinking ship, analytics has done little more than re-arrange the deck chairs on the Titanic. However, for those of us who believe baseball is still one of the great forms of sports entertainment, we must admit the sport is dangerously out-of-touch with the modern tastes and appetites of the average American sports fan.

And though analytics may not have helped the sport as much as Moneyball suggested it would, neither has it done the damage Epstein suggests.

  • K.R.K.

Send comments to: nuqum@protonmail.com

Postcript:

This is my favorite scene from Moneyball. It is the point at which head scout Grady Fuson (played by Ken Medlock) confronts Billy Beane (Brad Pitt) over his decision-making style as general manager. Most Moneyball moviegoers (and readers of Lewis’ book) probably view Fuson as the bad guy in the film — a dinosaur unwilling to change with the times. As a statistician whose faced similar confrontations in similar contexts, I see Fuson as a irreplaceable reality check for data wonks who believe hard data trumps experience and intuition. In my career, I found all of those perspectives important.

Fuson asks Beane into the hallway so he can clear the air. Fuson then says to Beane:

“Major League Baseball and its fans would be more than happy to throw you and Google boy under the bus if you keep doing what you’re doing here. You don’t put a team together using a computer.

Baseball isn’t just numbers. It’s not science. If it was, anybody could do what we’re doing, but they can’t because they don’t know what we know. They don’t have our experience and they don’t have our intuition.

You’ve got a kid in there that’s got a degree in economics from Yale and you’ve got a scout here with 29 years of baseball experience.

You’re listening to the wrong one now. There are intangibles that only baseball people understand. You’re discounting what scouts have done for a hundred and fifty years.”

Years later, Fuson would react to how he was portrayed in Lewis’ book and subsequent movie:

“When I was a national cross-checker, I raised my hand numerous times and said, ‘Have you looked at these numbers?’ I had always used numbers. Granted, as the years go on, we’ve got so many more ways of getting numbers. It’s called ‘metrics’ now. And metrics lead to saber-math. Now we have formulas. We have it all now. But historically, I always used numbers. If there’s anything that people perceived right or wrong, it’s that me and Billy are very passionate about what we do. And so when we do speak, the conversation is filled with passion. He even told me when he brought me back, ‘Despite what some people think, I always thought we had healthy, energetic baseball conversations.’”

At times I think people want to believe analytics and professional intuition are mortal enemies. In my experience, one cannot live without the other.


Wake up, America! The U.S. is not going bankrupt

[Headline graphic: Photo downloaded flickr.com/photos/68751915@N05/6793826885 (This image is used under the CCA-Share Alike 2.0 Generic license)]

By Kent R. Kroeger (Source: NuQum.com; November 25, 2020)

The recent Twitter exchange by Democratic congresswoman Alexandria Ocasio-Cortez (AOC) and Nikki Haley, the former U.S. Ambassador to the U.N., over whether the U.S. can afford direct payments to U.S. households to help with the economic damage caused by the coronavirus pandemic is a shining example of how our two major political parties can unite in constructive dialogue to solve our nation’s most pressing problems.

I’m just kidding.

The AOC-Haley debate over direct financial aid to Americans suffering due to the pandemic was a poopfest.

AOC and Nikki basically told Joe Biden and his call for national unity to go screw themselves.

The AOC-Haley Twitter exchange lasted only a few snarky tweets:

AOC: To get the (corona)virus under control, we need to pay people to stay home.

Haley: AOC, Are you suggesting you want to pay people to stay home from the money you take by defunding the police? Or was that for the student debts you wanted to pay off, the Green New Deal or Medicare for All? #WhereIsTheMoney

AOC: Nikki, I’m suggesting Republicans find the spine to stand up to their corporate donors & vote for the same measures they did in March, except without the Wall St bailout this time.

And I know you’re confused abt actual governance but police budgets are municipal, not federal.

AOC: Utterly embarrassing that this woman was a governor & still doesn’t have a grasp on public investment. Wonder if she says federal financing works like a piggy bank or household too?

All this faux-seriousness from folks who worship Trump for running the country like his casino.

And if you allow me to judge the winner of the AOC-Haley Twitter spat, AOC won in a first period knockout. It was the 1986 Mike Tyson-Marvis Frazier fight, only with more attractive combatants.

But before I give AOC too much credit, her rebuttal to Haley’s assertion that the U.S. can’t afford to solve America’s most serious problems (i.e., health care costs, student debt, climate change, etc.), realize that AOC is simply repeating an economic argument developed by advocates of Modern Monetary Theory (MMT).

In an over-simplified summary, MMT describes currency as a public monopoly and economic problems such as unemployment as evidence that a currency monopolist is overly restricting the supply of the financial assets needed to pay taxes and satisfy savings desires.

Stony Brook University Professor Stephanie Kelton, a former Bernie Sanders economic advisor, is among MMT’s most visible current advocates.

And, in truth, MMT is not that new. The theory’s core ideas ate not far removed from 100-year-old Chartalist Theory and similar economic arguments have been offered by U.S. economists and bankers for decades.

In a 1993 Harvard Business Review published dialogue, William A. Schreyer, Chairman of the Board Emeritus, Merrill Lynch & Co., Inc., New York, New York, a sharp critic of MMT, still concurred to one of its principle conclusions:

“The federal budget deficit is not the most important threat facing the U.S. economy. When policymakers focus narrowly on the budget deficit, they ignore what truly drives rising prosperity and long-term economic growth, that is, saving and investment. There is real danger in Washington’s myopic fear of the deficit. As we have seen too often in recent years, a focus on deficit-driven government accounting can place growth-oriented economic policy in a straitjacket.”

But there is also no doubt that politicians like Bernie Sanders and AOC are probably most responsible for helping propel MMT-thinking into mainstream political debate.

But before you think I’m a doughy-eyed lefty, think again. I voted for Trump twice, label myself ‘pro-life,’ believe ‘woke’ politics has more to do with politicians finding a new way to milk Americans for more campaign donations than anything else, and remain a healthy skeptic of the doomsday predictions surrounding climate change (though, I am convinced the earth is warming due to human activity and its consequences are real).

AOC would never ask someone like me for my vote.

Nonetheless, AOC’s logic on helping American households deal with the economic consequences of the pandemic is far more coherent than anything Haley or any other major politician have said on the subject. And that includes Nancy Pelosi and Joe Biden.

No country has ever gone bankrupt spending money on solving its most serious problems — and the coronavirus pandemic is that type of problem.

As Prof. Kelton likes to ask, “Did we spend too much money on World War 2?”

All that being said, I remain sensitive to the question: “Can large, long-term federal deficits be a bad thing?”

And my understanding of Prof. Kelton and MMT is that, of course, federal deficits are bad if the government spends the money poorly. Imagine if our $27 trillion national debt had been obtained entirely through the government purchase of solid gold bathtubs for every American street corner. Our currency would be worthless and our economy in a shambles. Buying U.S. debt would be the worst investment option on the planet.

But that’s not how this country has spent the money it has printed. Not even close. Past spending and investment decisions (public and private) have made the U.S. economy the best long-term investment around. Admittedly that could change. A twenty-year military occupation of country with little impact on the world economy or U.S. strategic interests might do that if we give it a chance. But even that questionable investment comes with economic upsides, particularly if you are a military contractor or an MSNBC military “analyst.”

The fact is, simplistic notions of what policies the U.S. can and cannot afford are rooted in, as AOC puts it, a flawed understanding of public investment. Financing the federal deficit is not like a piggy bank or household budget. To treat it as such is to risk doing real and lasting harm to the U.S. economy and the American people.

Therefore, it is time we collectively wake up to the con that the U.S. cannot sustain deficit spending, a deception engineered out of self-interest by politicians from both parties who gain more power by perpetuating it.

The reality is that the U.S. can sustain deficit spending as long as the money is spent wisely and solves real problems.

AOC — 1 … Nikki Haley and the U.S. Political Establishment — 0.

  • K.R.K.

Send comments to: nuqum@protonmail.com

A Elegy for Donald Trump

[Headline graphic: President Donald Trump speaking at the 2018 Conservative Political Action Conference (CPAC) in National Harbor, Maryland (Photo by Gage Skidmore; used under the CCA-Share Alike 2.0 Generic license.)]

By Kent R. Kroeger (Source: NuQum.com; November 6. 2020)

I am a Bernie Sanders-supporting registered Democrat (check the voter databases in Iowa and New Jersey); yet, I never hated Donald Trump, even as everyone around me did. My wife and I stopped talking politics on the morning of November 9, 2016 and my mother-in-law to this day only refers to him as “Number 45” or “Turdface.”

But I see beyond his fake tan and broken syntax and recognize some of the good things Trump did over the past four years: He reset some bad trade agreements. Told our European allies it was time they chipped in their share for mutual defense. Oversaw an unprecedented surge in small business growth. And, most importantly, helped expose the falsehood of the Washington, D.C. trope that large, ceaseless federal budget deficits are inflationary and need to be dealt with through deep cuts in entitlement and discretionary spending. If there is one thing Donald Trump is good at, it is running up debt and still being rich.

Finally, I always knew Trump wasn’t a Russian tool (as that whole three-year, media-fueled hullabaloo was the Oxford Dictionary definition of ‘fake news’). The Washington establishment wanted to discredit Trump from the moment he was elected and the Russiagate story was the perfect pulp fiction to do it.

Truth be told, I was entertained watching Trump annoy the news media. They kept telling me Trump was a liar but that’s not what I saw. Trump was not a fabricator of facts — he was simply a CEO who could only regurgitate new information after he had dumbed it down to a point where it was unrecognizable as discernible fact. That’s not lying. That’s called being wrong. There’s a difference. A big difference.

Kevin Weinberg, a 30-something computer programmer, writer and anime aficionado, posted on social media one of the most honest postmortems I’ve yet seen for soon-to-be former President Donald Trump:

If you love Trump as much as I do, don’t riot. Don’t loot (not that I need to say it, as our side never does this). Accept Trump’s sacrifice for us. He destroyed his life, his business, and his future for his country, so that we could save our Constitution by ending the attack on our courts. I am so sad to see President Trump lose (which he probably will). But we should honor his sacrifice. He changed politics forever.

Republicans are now trending ‘big tent.’ Hispanics are rapidly switching teams. Each election we (the Republicans) gain more Hispanic and Black support. Liberals will eventually be the party of white women with college degrees in gender studies.

Sure, I could quibble with a couple of assertions in Mr. Weinberg’s elegy, but his basic point mirrors the central sentiments I’m hearing and reading across the Trump universe today (for which I now paraphrase): We are sad, but we believe Donald Trump stood for something that is not fairly represented in the national media or among political and economic elites: The American economic and political system is designed for the benefit of the few, not the many.

If I may interject, Donald Trump utterly failed in changing that inequity dynamic, even as I remain sympathetic to the guiding belief that I believe motivates most Trump voters: The American political and economic system doesn’t work for most Americans.

The election of Joe Biden fails to address that problem on every meaningful level. In fact, I think he will significantly set that project back. A Biden administration is a regression-to-the-mean that will re-empower the same forces in the Barack Obama presidency that engineered that fastest growing wealth gap since the Reagan years. Every problem can be solved by government-funded tax credits, block grants, or low-interest loan programs that do more for the balance sheets of corporate America (and the value of stock holdings among corporate executives) than for the household budgets of average Americans.

I am too cynical, but experience tells me, for most of at least, happy days will not be here again under a Biden administration.

Joe Biden is the autonomic reflex reaction of the American people to the perpetually embattled Trump presidency. However, the realities that created the Trump phenomenon in the first place –increased wealth inequality, anxieties over immigration, unbalanced trade agreements, the continued economic marginalization of working class Americans of all races and ethnicities, and a growing sense that the U.S. is in decline relative to the rest of the world — are stronger than ever.

The November 3rd election was an anti-Trump vote, but it in no way represented an endorsement of the Democratic Party, its ideas, or its desire to return to “normal times.”

To the contrary, the Republican Party’s core values remain the ideological fulcrum points for most policy debates in Congress — federal budget deficits are bad, what is good for corporate America is good for Main Street, U.S. military interventions are always motivated by good intentions, etc. — and is in an ideal position to stop any substantive legislation the Biden administration might propose.

As I said in a recent column, “The status quo won in a landslide on Tuesday.” Under Biden, the U.S. will keep bombing the same seven countries we bombed under Obama and Trump. The wealth gap will continue to grow. The U.S. will continue to have an inadequate health care system that denies millions of Americans access to needed health care and leaves millions more vulnerable to financial bankruptcy. And the planet will continue to warm at an alarming rate (see Figure 1 below), even after the U.S. rejoins the Paris Climate Accords.

Figure 1: UAH Satellite-Based Temperature of the Global Lower Atmosphere (through Oct. 31, 2020)

Nobody that cares about this country should be happy about with the status quo.

I will not miss Donald Trump as I am sick of the network news’ daily diet of “What stupid thing did Trump say today?

However, if we are ever going to face the real problems in this country — the problems that gave rise to Trump in the first place — the ‘Chicken Little’-hysteria that surrounded the Trump administration will need to be replaced by something more nuanced and intellectually honest — and, therefore, less attractive to news audiences.

Which is why I have no illusions that anything will actually get better under the next presidential administration, even if the news network anchors (not on the Fox News Channel) insist otherwise.

  • K.R.K.

Send comments to: nuqum@protonmail.com


The status quo won in a landslide on Tuesday

[Headline graphic: The Triumph of Caesar: Trumpeters by Jacob of Strasbourg and Benedetto Bordone; Used under the CC0 1.0 Universal Public Domain Dedication license]

By Kent R. Kroeger (Source:  NuQum.com; November 4, 2020)

Conservative pundit George Will said after Barack Obama’s 2008 election victory that the loss was good for the Republican Party: “Republicans are a bad governing party, but an exceptional opposition party.”

Which soon will be evident as the Republicans spend the next four years calling into question the validity of this election and the president and Congress it elected.

And why shouldn’t they? Republicans and their wealthiest constituents win whenever their party can so badly muck up the legislative system nothing substantial or transformative ever gets passed. Doing nothing–the status quo–serves them as well as when they are in power and bear the aggravating responsibility of governing.

While the news networks are saying the final results for Tuesday’s election may not be known for days or even weeks, the actual result was hard-coded into the Constitution, monetary system, federal budget process and U.S. tax code years ago. America’s political and economic elites win every election. Its not necessary to count all of those unprocessed mail-in ballots. We already have our outcome: Hail, Caesar!

Also clear is that the biggest losers on Tuesday were progressives who think their progressive policies will ever get a fair hearing within the U.S. halls of power.

A Green New Deal? You’ll have to wait another four years. Address the looming student debt crisis? Not anytime soon. Shrink the nation’s growing wealth gap? Not gonna happen.

At a unique time in history when no Republican incumbent’s seat should have been safe, Kentucky Senator Mitch McConnell crushed his well-funded opponent by 20 points. One of my close Iowa friends insisted in the weeks before Election Day, Iowa Senator Joni Ernst was doomed. “She’s toast.” Supposedly, Theresa Greenfield, her Democrat opponent, was generating enthusiasm unlike anything they’d ever seen since a young Senator from Illinois traversed the state as he ran for president. Ernst won by almost seven points.

Joe Biden will be the next president, but any expectation of a mandate was crushed Tuesday night. Biden, similar to Trump in 2017, will limp into the presidency, already damaged goods–and that’s after every major news network (less Fox News) was basically a 24/7 Biden ad over the last five or six months. [Yes, there is data to support that charge; you’ll find it here. And don’t get me started on how bad journalism has become in this country. IMHO, we have propaganda outlets, not news organizations.]

If you are a progressive, do not despair, no matter how easy it is at the moment. Instead, now is the time to spiritually free yourself from the shackles of a one-party system that poses as a two-party system. It has failed, again, to give anyone hope for real change…and it will fail in the future as well. Cartoonist Charles Schultz warned us 50 years ago of this reality with his iconic bit where Lucy Van Pelt never lets Charlie Brown kick the football–yet Charlie never loses faith that ‘next time’ he will succeed. Spoiler alert: He doesn’t.

[In this analogy, think of Nancy Pelosi or Charles Schumer as Lucy and Bernie Sanders or Alexandria Ocasio-Cortez as Charlie Brown.]

Do you want an economically rational, universal health care system? Do you want an economic system where our best and brightest aren’t operating under the oppressive cloud of student debt for half of their working life? Do you want to end our pointless forever wars? Do you want to reduce the wealth inequality gap?

If you do, consider abandoning the Democratic Party. They are working for the same entrenched elite interests as the Republican Party. And I suggest a similar consideration for the populists in the Republican Party.

Progressives and populists joining forces? Now that would be an interesting political party.

  • K.R.K.

Send comments to: nuqum@protonmail.com

The 8 things President Biden could do to gain the respect of progressives

[Headline photo by Gage Skidmore; use licensed under licensed under the CCA-Share Alike 2.0 Generic license.]

By Kent R. Kroeger (Source: NuQum.com; November 3, 2020)

No más. I can’t take it anymore.

If you thought the 2016 election was unwatchable, welcome to 2020 —an election where our main choices for president are two de facto Republicans.

Guess which party will win?

Sure, the “official” Republican Party lost control of the presidency and the U.S. Senate, but at the end of the day, its the Democratic Party that has moved to the right. And it is unlikely, based on the last Democratic presidency, that the new president will ever move credibly back to the left.

I predict more government spending disproportionately benefiting corporate balance sheets over American households, an expansion of U.S. military involvements across the globe, our inefficient health care system will stay inefficient, and our

Through their presidential nominee, Joe Biden, the “official” Democratic Party is the living definition of a status quo political organization. Their candidate defends the interests of health insurance and pharmaceutical companies while economically vulnerable Americans disproportionately die from the coronavirus. As our planet continues to warm at an alarming rate, he plays coy on the issue of fracking — does he support it or not?

He defends the interests of the big tech companies even as they’ve been shown to censor content produced by dissenting voices from the left and right. He defends maintaining current troop levels in Afghanistan despite the 18-year war having done little to bring sustainable democratic institutions or economic prosperity to the country; and, instead, has witnessed the Taliban expand its areas of control. In fact, there is no current U.S. military occupation or attempt at regime change that Joe Biden hasn’t promised to maintain or expand and said he would continue the current military budget levels (Recent Biden statements on U.S. military policies are here, here and here).

Joe Biden isn’t an outlier within the Democratic Party. He is a perfect representation of what that party has become since the rise of Bill Clinton.

The last 12 months of media-fueled propaganda attacking Trump (and indirectly supporting Biden) has worked. Like good propaganda, a lot of it is based on fact. Donald Trump has royally bungled the coronavirus crisis. Yet, at its core is a dishonest project to suggest Trump is the cause of America’s ills, when, in fact, he is merely a symptom.

Unsurprisingly, disaffected Democratic and Republicans are not so easily deceived. They remain as disillusioned as ever about the direction of the country under a Biden administration.

In 2016 they wanted to tear down the status quo and in 2020 they are getting it back in a more arrogant form than ever.

Our political system is broken relative to the average American and the people that helped make it that way are about to return to power.

Yes, the Trump experiment mostly failed. He did fulfill some of his promises: renegotiated bad trade agreements, spurred small business growth and employment on a historical level (particularly in minority communities), funded his wall (thanks to a secretively compliant Nancy Pelosi), tore up the Iran Nuclear Deal (which was actually a good agreement), and rolled back environmental regulations on the coal industry (which won’t change the fact that coal is still a dead man walking).

But when the final numbers are tallied, Donald Trump wasn’t the change-agent many thought he would be. He never ended our endless wars. He didn’t force the pharmaceutical companies to face real price competition. He didn’t even fulfill his 2016 campaign pledge to close the carried interest tax loophole for hedge fund managers.

Trump can blame the Democrats in Congress for some of these failures, but just as I was a harsh critic of Barack Obama and his inability to negotiate with a hostile Congress, I hold Trump to the same standard.

In business it is often said, ‘You have to give something to get something.’ Our current dysfunctional political system is incapable of such reciprocity. We are all to blame for that.

Nonetheless, I sit here today forced to accept the fact that Joe Biden — a self-described ‘deficit hawk’ and proud military ‘interventionist’ —is going to sit in the Oval Office for four years (health willing).

I try to keep my spirits up by believing that Biden will be a better president than he was as a U.S. Senator and vice president. I’d like to believe there are instances in history when a politician’s past performance did not predict his or her performance as president. If you can think of one, please let me know.

The evidence is overwhelming that our next president, in the recent past, willfully turned a blind eye to his own son’s capacious appetite for profiting from his father’s political office. That ain’t Russian propaganda, folks. That is a cold, hard fact.

Still, with my expectations planted in reality, I want to believe there is a sluggers chance that a Biden administration could do some socially progressive things.

Hence, I have come up with 8 policies that, should a Biden administration implement them, would lead me to reconsider my attitude towards him.

For each of these 8 policies, I’ve included my guess as to the probability they could be achieved. Additionally, I’ve tried to include mostly policy ideas that are currently supported by a majority of Americans based on recent opinion survey data (e.g., the 2019 and 2020 Pilot Surveys conducted by the American National Election Studies).

The following are mainstream policy ideas.

Let us get started…

(1) Remove American combat troops from Syria, Iraq, and Afghanistan.

It is hard to believe after over a decade of U.S. combat forces in Iraq, Afghanistan (and oil and gas generating portions of Syria) that we are still having this debate. Apart from removing the Saddam Hussein and the Taliban from power, the U.S. and its allies have accomplished little by remaining in these countries.

“The Taliban controls more territory than at any time since the U.S.-led invasion in 2001 toppled the fundamentalist group from power,” says Middle East-based journalist Frud Bezhan.

So why are we still there? The cynical answer is: U.S. contractors are enriched by these occupations. The more polite answer is that the costs in keeping of U.S. troops in Afghanistan are not large enough to force a withdrawal.

The Biden campaign’s cryptic statements on Syria are the most chilling of his military policy ideas. According to his campaign website, Biden promises in Syria to stand “with civil society and pro-democracy partners on the ground…and ensure the U.S. is leading the global coalition to defeat ISIS and use what leverage we have in the region to help shape a political settlement to give more Syrians a voice.”

Biden and U.S. military leaders always fail to mention that Iran and Bashar al-Assad’s Syrian forces have killed more ISIS fighters in the world than any other military force. In fact, the rise of ISIS can firmly be laid at the feet of the Obama administration.

According to writer Robert Morris, who has written extensively on U.S. foreign policy in the Middle East, one of the most pernicious and widespread myths is that the Obama administration’s reduction of combat troops in Iraq led to the rise of ISIS.

“Those who are trying to keep U.S. troops in Syria rely heavily on this myth,” says Morris. “It is central to the foreign policy ideas of both parties, and the ideology and future plans of the entire U.S. foreign policy establishment.”

The problem is that this myth about ISIS’ rise is “95 to 99 percent bullsh*t,” says Morris. “Obama’s Iraq withdrawal did not create the Islamic State (ISIS), but his intervention in Syria almost certainly did.”

Biden’s infrequent campaign mentions of Syria indicate he’s prepared to reimpose an interventionist, anti-regime policy that failed to overthrow Assad the first time, but successfully destabilized Syria and led to the death of almost 400,000 Syrians.

If establishment Democrats like Biden are consistent on anything, it is in their unwillingness to upset the military-industrial complex and our country’s foreign policy brain trust, even when they are demonstrably incompetent, as they have been with respect to the Middle East.

The chance a Biden administration would end these military adventures in any one of these countries? Close to zero.

(2) End US military involvement in Saudi Arabia/UAE’s war in Yemen

On the surface, this may be the one international conflict in which a Biden administration could do the right thing. The U.S. (and other European allies) supply Saudi Arabia and the United Arab Emirates (UAE) with significant intelligence and logistical support in their nearly six-year effort to remove the Houthis, who are Shia Muslims, from power in northeast Yemen.

To date, according to the Yemen Data Project, Saudi-coalition air raids have killed nearly 9,000 Yemenis and have created one of the world’s most dire humanitarian disasters.

In an apparent response to this crisis, the U.S. House and Senate voted nearly two years ago to condemn and end the Trump administration’s support for the Saudi-coalitions efforts in Yemen (which, in fact, had started under the Obama administration).

Has the issue of Yemen been prominently raised in the 2020 presidential campaign?

Of course not. So don’t expect a Biden administration to do anything to upset the status quo in that region. Saudi Arabia and the UAE are close allies to the U.S. and the Iranian-allied Houthis are not.

The chance a Biden administration ends our support for the Saudi-UAE war on Yemen: 10%.

(3) Rejoin the Iran Nuclear Deal (as negotiated by the Obama administration) and end sanctions immediately.

I have little positive to say about the Obama administration, but when it comes to the Iran Nuclear Deal —known formally as the Joint Comprehensive Plan of Action (JCPOA) which was signed in July, 2015 —the previous administration hit a solid Texas League single. The JCPOA wasn’t perfect, but by bringing the Iranians into the constraints of an international agreement on nuclear weapons development, the Obama administration moved the ball forward on Middle East peace. Something the Clinton and G. W. Bush administrations did not do.

However, Trump’s short-sighted destruction of that deal has achieved nothing, except to move the region closer to a dangerous, full-scale ‘hot war’—which, though further enriching the U.S. defense contractors, sends shivers down the spine of global trading interests.

A war with Iran would likely be a far bigger foreign policy debacle than G. W. Bush’s unnecessary war with Iraq in 2004.

Thankfully, Biden (the candidate) has made rational statements about Iran during the 2020 campaign. “There’s a smarter way to be tough on Iran,” says candidate Biden. “This past month (August) has proven that Trump’s Iran policy is a dangerous failure. At the United Nations, Trump could not rally a single one of America’s closest allies to extend the UN arms embargo on Iran. Next, Trump tried to unilaterally reimpose UN sanctions on Iran, only to have virtually all the UN security council members unite to reject his gambit. Now there are reports that Iran has stockpiled 10 times as much enriched uranium as it had when President Barack Obama and I left office. We urgently need to change course.”

I don’t know what “reports” Biden is referencing, but I do believe Biden is prepared to reverse the significant damage Trump has done in the international community’s efforts to slow down Iran’s nuclear ambitions.

But not only should Biden recognize the dangers of Trump’s aggressive Iran policies, JCPOA was one of the Obama administration’s genuine foreign policy successes and reviving it would not require any contentious battles with Congress. Bringing the Iran Nuclear Deal back from the dead should be a no-brainer.

The chance the Biden administration rejoins the JCPOA and ends sanctions against Iran: An optimistic 75%.

(4) Pass a student debt relief program that forgives a substantial proportion of debt for the neediest students and reduces interest rates for others.

Student debt is a $1.6 trillion crisis waiting to happen and more than 30% of student loan borrowers are in default, late or have stopped making payments six years after graduation.

Forty-four million Americans are directly under the thumb of this debt burden, but all Americans feel the effects of this mess as more and more student debtors are delaying the traditional milestones of adulthood: marriage, children and home ownership.

A 2015 survey by Bankrate.com found that 21 percent of student debtors have delayed marriage, 26 percent have pushed back having children, and 36 percent have put off buying a home.

Those choices have measurable outcomes throughout the economy, and most of them are negative.

Where has candidate Biden stood on the issue of student debt? To my surprise, this is one issue where the Biden campaign has been fairly concrete.

For example, Biden proposes changing the Public Service Loan Forgiveness (PSLF) program, where currently the remaining debt is forgiven after 10 years of payments, to a program where $10,000 of federal student loan debt is forgiven each year for up to five years.

Biden has also proposed a income-based loan repayment program that would cut monthly loan payments in half compared to the Pay-As-You-Earn Repayment (PAYE), which was created under the Obama administration program and has the lowest monthly and total payments of any other income-driven repayment plans.

More broadly, Biden has proposed forgiving all tuition-related undergraduate federal student loan debt for borrowers who attended public colleges or Historically Black Colleges and Universities (HBCUs) and who earn less than $125,000 per year. Joe Biden has also said that he supports the $10,000 in federal student loan forgiveness proposal recently introduced by House Democrats.

Finally, Biden wants to restore bankruptcy discharge rights to student loans, which would allows debtors to stop paying their student loans if payments on those loans “impose an undue hardship” on the student and his or her dependents. [I’ll be nice and won’t mention that it was Senator Biden who helped rollback bankruptcy protection for millions of average Americans right before the 2008 recession. I won’t, but here is someone who will.]

All things considered, I believe Biden’s campaign rhetoric on student debt relief has been refreshingly specific and credible.

The chance the Biden administration passes a substantive student debt bill: a hopeful 50 percent.

(5) Decriminalize most drug possession offenses; stop using the justice system to help users and move treatment to the social services and mental health communities

Nowhere is Biden’s congressional record more disconnected from current public sentiment than when it comes to U.S. crime policy. From his first days as a House member through his Senate career, Biden has aggressively positioned himself as a “crime fighter.” In that effort, Biden frequently cites the 1994 “Biden” Crime Bill, as he once called it, as his greatest legislative achievement.

The 1994 Crime Bill, the largest crime bill in U.S. history, provided for 100,000 new police officers, $9.7 billion in funding for prisons and $6.1 billion in funding for prevention programs, which were designed with significant input from experienced police officers. The bill also eliminated Pell Grants for prison inmates, criminalized gang membership, established a three-strikes provision that mandated life sentences for people with two or more violent felony convictions, and gave states incentives to lengthen sentences, including for drug possession offenses.

However, not everyone who has suffered from drug addiction or lives in a minority community shares Biden’s love for the 1994 Crime Bill.

Leading into the 2016 election, activist Jeremy Haile, the federal advocacy counsel at the Sentencing Project, said, “Any Democrat that is interested in gaining support among the current electorate, particularly the progressive civil rights communities, is going to have to say that previous tough-on-crime policies were a mistake.”

The Black Lives Matter movement of 2020 only amplifies Haile’s earlier statement. “Many of us who grew up in the black community in the ’90s,” Patrisse Cullors, a political organizer and co-founder of the Black Lives Matter movement, told the New York Times. “We witnessed the wave in which the policies that came from both federal government but also local government tore our families apart.”

And what does Biden still say about the 1994 Crime Bill?

Asked recently in a televised town hall, Biden admitted the 1994 Crime Bill was a “mistake.” However, just a year ago he was still defending the bill.

To be fair, the most impactful crime bills were passed in the two decades prior to the 1994 Crime Bill (my analysis on that topic can be found here). Nonetheless, at every opportunity, both as a House and Senate member, Biden has proudly voted for tougher crime laws. That position may still serve him well with the majority of Americans, including populists, but to left-leaning progressives, Biden is not on their side of the issue.

And, as president, I think Biden’s legislative record will remain faithful to his ‘tough-on-crime’ past, even if his rhetoric will be all over the map.

The chance the Biden administration pushes for the decriminalization of most drug possession sentences and takes the criminal justice system out of the drug enforcement process: No chance.

(6) Substantive reform of the U.S. health care system, including at least one of the following policies: (a) reducing Medicare eligibility to 55 years of age, (b) extending Medicare to all dependent children, or (c) offering all Americans the option to buy into the Medicare program through “Obamacare” or their employer

Biden has been clear on this. He will work to restore those features of the Obama administration’s Affordable Care Act (“Obamacare”) that were rolled back by the Trump administration. Beyond that, he has promised only marginal changes to the U.S. health care system and has rejected any call for universal health care. Biden does not support “Medicare for All” and will oppose any effort coming close to it.

That said, he has coyly suggested “a public option like Medicare” could be added to “Obamacare” (though the details of this public option are thinly described on his campaign website) and he has proposed lowering the Medicare age eligibility to 60 years of age (down from the current 65).

However, the coronavirus has revealed the deep, systemic flaws in the U.S. health care system and the disproportionate burden this pandemic has placed on low- and middle-income households who cannot afford potential out-of-pocket expenses related to coronavirus treatment.

Biden is right when he says Americans are dying because of current U.S. health care policies under Trump. What Biden doesn’t tell you is that most of those policies have been a joint, 70-year project by the Democratic and Republican parties to protect health insurance companies, health care providers, and pharmaceutical companies from universal health care. Tweaking our ailing health care system, as Biden proposes to do, will not significantly improve U.S. health outcomes related to the coronavirus or any other health problem.

In the end, Biden will never support policies moving the U.S. significantly closer to a universal health care.

The chance the Biden administration passes substantive health care legislation: While there is a fair chance (25%) that the Medicare age eligibility standard will be lowered, the offering of a genuine “public option” or universal health care for all child dependents is not going to happen on Biden’s watch.

(7) Give U.S. households a federal tax credit for purchasing an all-electric vehicle; and an additional tax credit or cash incentive for a household to simultaneously trade in an existing combustion engine vehicle

I had to put one easy chip shot for Biden on this list. This is it: Restoring and expanding a federal tax credit for purchasing an all-electric vehicle, as well as reviving the “Cash for Clunkers” program.

Biden has already endorsed these ideas that are aimed at helping move the U.S. towards a green economy and help meet the UN’s Intergovernmental Panel on Climate Change’s goal of global net human-caused carbon dioxide (CO2) emissions reaching ‘net zero’ by 2050.

Electric cars alone won’t get us to that goal, but with the continued decline of coal-based electricity generation, the increased greening of U.S. corporate energy consumption and recent advancements in carbon-capture and sequestration technologies, the U.S. is going to significantly move the ball forward on combating climate under a Biden administration. [Yes, I know Biden supports fracking, but that is small turnips compared to an all-electric U.S. vehicle fleet.]

The chance these two electric vehicle policies become law in a Biden administration: A strong 90%.

(8) Pardon Wikileaks Founder Julian Assange

Just when it seemed like I was warming up to the incoming Biden administration, the topic of press freedom and the U.S. government’s current effort to prosecute news publisher Julian Assange for publishing classified U.S. documents related to the Iraq War, brings those good feelings to an abrupt halt.

Sadly, I don’t need to single out Joe Biden on this issue. I can’t name a single U.S. politician, apart from Hawaii Representative Tulsi Gabbard, who has stood firmly by our First Amendment and consistently supported the release of Assange. If he is tried and convicted in a U.S. court of crimes under the 1917 Espionage Act, the First Amendment rights of all Americans will be diminished.

What has Biden said about Assange? He called Assange a “high-tech terrorist.”

As is so often the case with Biden, he takes a meager understanding of the facts and exploits our worst instincts and biases to gain cheap political points.

All Americans, not just Biden, would benefit by learning the facts surrounding Assange. [You can find a good, balanced summary of the Assange case here by former New York Times reporter James Risen.]

The facts, as they are known today, show that Assange did not conspire with the Russians to defeat Hillary Clinton in 2016 (which, by the way, has nothing to do with the charges that keeps Assange in a U.K. prison, but does have a lot to do with why establishment Democrats are willing to damage our First Amendment protections for petty political purposes). He did not offer assistance to Chelsea Manning on how to anonymously infiltrate classified U.S. intelligence systems (which is among the charges against him). Finally, Assange and Wikileaks did not expose U.S. intelligence assets in the Middle East (or elsewhere) to harm, as often charged in the mainstream media. To the contrary, the facts consistently show how diligent and thorough Assange and Wikileaks were in redacting the names of intelligence assets from the Wikileaks-released documents.

What Assange did do is publish accurate information that exposed potential U.S. war crimes in Iraq and, most certainly, revealed facts about the U.S. military occupation of Iraq that reflected negatively on the U.S. government. What Assange and Wikileaks did is fundamentally no different than the New York Times and Washington Post publishing The Pentagon Papers almost 50 years ago. How ironic is that those two news organizations have been largely silent on the First Amendment implications of the his case?

The central character in The Pentagon Papers drama, former Pentagon intelligence officer Daniel Ellsberg, offers a biting analysis of the Assange case that you can watch here from The Jimmy Dore Show. [And is there any bigger indictment of today’s mainstream journalism than the fact that you can get better, more accurate information on the Assange case from watching the podcast of a jagoff nightclub comedian?]

The chance the Biden administration will pardon Assange: Negative zero.

Final Thoughts

One of the most demoralizing features of Joe Biden is how his 2020 campaign rhetoric contradicts much of his legislative record. He voted for harsher drug penalties before he came out against them as a presidential candidate. As a candidate, Biden said he wouldn’t touch Social Security or Medicare, even though as a ‘deficit-hawk’ Senator he spoke repeatedly about his support for putting those programs under the budgetary knife in the name of lowering the national debt. He opposed fracking before he recently came out for it — a stance he then clarified to mean he was always for it even when he was against it.

The national media has pulled double-duty in protecting the American voter from knowledge of these numerous inconsistencies between candidate Biden and his legislative record.

Unfortunately, as president, it will be much harder (though not impossible) for Biden to hide those inconsistencies from the millions of progressives who are rightfully cynical towards him at the start of his new administration.

  • K.R.K.

Send comments to: nuqum@protonmail.com

Now that the election is essentially over, let us stop blaming others for the spread of the coronavirus

[Headline photo by Photo by futureatlas.com; used under the the CCA 2.0 Generic license]

By Kent R. Kroeger (Source: NuQum.com; October 29, 2020)

“Come to terms with death. Thereafter anything is possible”— scribbled by Albert Camus in one of his notebooks.

The U.S. presidential election is essentially over. Can we stop being afraid and have a serious discussion about the coronavirus and the next steps to address it?

During this dreadful election, watching the world’s news organizations post a daily coronavirus death counts has been one of the most depressing aspects of this pandemic. And not simply because of the figure’s size — 1,176,000 people worldwide have died from this virus as of October 28th (or about 0.015 percent of the total world population)— but because the news media uses it, not just to inform us, but to force us to stew in its political ramifications. Conservative commentator Steve Deace aptly coined a term for the news media’s coronavirus coverage: panic porn. I may disagree with Deace’s contrarian view about the virus’ threat, but he’s take on the news media is spot on.

And its not just the news media failing us, its the politicians too.

“I hold Donald Trump responsible for every death in New York state from Covid, because Trump lied,” New York Governor Andrew Cuomo said in a recent conference call with reporters. “New York state had that big burst because it came from Europe and not China, and they never did a European travel ban because he was lying to the American people. He is the super-spreader that brought the virus to America.”

Never mind that Trump did impose a travel ban on European travelers entering the U.S. in early March at around the same time as other countries, or that U.S. governors have the executive authority to impose their own restrictions on international travelers into their state, blaming others is a time honored tradition among politicians. By doing so, unfortunately, politicians like Governor Cuomo and President Trump have been able to rationalize their own COVID-19 policy mistakes. And they’ve made many.

For his part, President Trump’s inability to take some responsibility for the federal government’s mistakes during the coronavirus pandemic has gravely hurt his chances at being re-elected, fair or not. The only consistent message he’s offered the American people is that he thinks China is to blame. Simply put, that political strategy hasn’t worked.

The blame game isn’t just an intellectual cop-out, it stunts the development and implementation of real solutions as the partisan fireworks devolve mostly into substance-free, unproductive exercises in moral posturing and bad public theater.

China is not to blame for these COVID-19 deaths. And neither is Donald Trump and his administration. And neither are the Democratic governors of New York, New Jersey, Rhode Island and Connecticut whose constituents so far have experienced some of the world’s worst coronavirus death counts per capita. [Though, it was probably a mistake early in the pandemic bythose governors to systematically move thousands of elderly COVID-19 patients from hospitals to nursing homes in an attempt to keep more hospital beds available. It was a policy disaster that will hopefully get more investigation once the elections are over.]

The reality is…the coronavirus has caused the COVID-19 deaths, which is not to say our medical experts, politicians, and inadequate health care system didn’t make some grave mistakes along the way — particularly early on— as they tried to limit its spread and lethality.

President Trump’s unfounded, dreamy optimism about how quickly the pandemic would end is no worse than the Democratic Party’s ignoring their own mistakes and, instead, opting for excessive moralizing and hyperbolic doomsday predictions.

The Spanish Flu of 1918–20 killed 50 million people (675,000 in the U.S.), which was about 2.7 percent of the world’s population. The Roaring Twenties followed closely on the heals of what had been one of the worst worldwide pandemics since the 1300’s bubonic plague.

There is little doubt that — regardless of who wins the upcoming election — the U.S. and world economies will recover from this pandemic.

Despite the current third wave of the coronavirus — which may exceed the other two in numbers of new cases —case fatality rates (see Figure 1 below) continue to fall or are stable in most countries (Iran being one tragic exception) and the prospects for a safe, effective vaccine by early next year have cautiously improved.

Figure 1: COVID-19 Cumulative Case Fatality Rates for Selected Countries

Image for post

Whether this drop in CFRs is a function of improved COVID-19 treatments, more testing, more healthy people catching the virus, a less lethal form of the virus or some combination of these and other causes, it is likely that getting COVID-19 today is less dangerous than it was just three or four months ago.

And there will be a vaccine in the foreseeable future — whether people are willing or able to get the vaccine will be the big questions.

In the meantime, we should rejoice at the good news when we get it, even as we continue to exercise extreme prudence in protecting ourselves and loved ones from the coronavirus.

Writing in the New York Timesscience writer John M. Barry, author of “The Great Influenza: The Story of the Deadliest Pandemic in History” echoed what many epidemiologists have been saying from the beginning on how to minimize the spread of the coronavirus while still allowing the world economy to be maintained at some level of normalcy:

To stop this virus without more general lockdowns, we need “social distancing, avoiding crowds, wearing masks, washing hands and a robust contact tracing system, with support for those who are asked to self-quarantine and for selected closures when and where necessary.”

In my opinion, if partisan politics hadn’t entered the public discussions at the pandemic’s outset, this excellent advice might have become habit for the vast majority of Americans much sooner. Instead, highly partisan Americans reflexively dove behind the stone walls of their respective political groups at the first sound of partisan sniping.

For that failure, I blame the news media and both American political parties. [And there I go, blaming people. What a hypocrite I am.]

  • K.R.K.

Send comments to: nuqum@protonmail.com

Dr. Michael Osterholm challenges the Great Barrington Declaration and the low herd immunity myth

[Headline Graphic: A Russian women wearing a mask during the 2020 Coronavirus Pandemic (Photo by https://www.vperemen.com; used under the CC BY-SA 4.0 license)]

By Kent R. Kroeger (Source: NuQum.com; October 24, 2020)

Today’s news that the U.S. reported a record number of new COVID-19 cases yesterday (83,000+) did not surprise anyone who has been listening to Dr. Michael T. Osterholm, Director of the Center for Infectious Disease Research and Policy (CIDRAP) at the University of Minnesota, since this coronavirus pandemic began.

When many politicians and news media celebrities in March and April were talking about the pandemic as a single surge as part of a one large wave, Dr. Osterholm and  his CIDRAP colleagues were warning that there would be multiple waves with the biggest likely occurring in the Fall.

Score one for Dr. Osterholm and CIDRAP.

When President Trump and more than a few media-selected experts were anticipating the fast development of a SARS-CoV-2 (COVID-19) vaccine, perhaps by summer’s end, Dr. Osterholm was on Joe Rogan’s podcast saying it would take many months, well into next year, before a vaccine could even conceivably be available for wide distribution.

Right again.

When Dr. Osterholm went on NBC’s “Meet the Press” last Sunday and said that the next few months with be the darkest of the pandemic and the country, I took it seriously, even as I am a skeptic about the utility of widespread or selective economic lockdowns and remain optimistic that falling case fatality rates are a sign that treatments are becoming more and more effective against this viral scourge.

Dr. Osterholm would probably classify my views as naive and potentially deadly.

So when Dr. Osterholm on his podcast last Thursday called out the public health and epidemiological professionals who signed the Great Barrington Declaration (GBD)—which, among other things, says that “current lockdown policies are producing devastating effects on short and long-term public health” and that “simple hygiene measures, such as hand washing and staying home when sick should be practiced by everyone to reduce the herd immunity threshold”—I listened.

Herd immunity is when so many people in a community become immune to an infectious disease that it stops the disease from spreading.

Where Dr. Osterholm takes greatest issue with the GBD is its suggestion that we can “reduce” the herd immunity threshold, which CIDRAP any many epidemiological experts estimate to be around 50 to 70 percent of the population.

Though no specific herd immunity threshold is cited in the GBD itself, some of its signers and a minority of epidemiological experts have suggested coronavirus herd immunity thresholds are much lower than 50 to 70 percent of the population, perhaps as lows as 20 to 30 percent.

What says Dr. Osterholm to those lower herd immunity estimates?

“That figure is the most amazing combination of pixie dust and pseudo-science I’ve ever seen,” says Dr. Osterholm. “Now matter how much information we supply, these myths still continue. If you look at the congregate living areas (e.g., prisons), you can see that once the virus gets into this tight space with enhanced capacity for transmission, it blows right through, well into the 60, 70 percent range.”

Unlike much of the questionable information being spread about the coronavirus, the GBD represents a genuine debate in the epidemiological community and is supported by a small, but highly credentialed group of public health experts—which is why Dr. Osterholm is so adamant in challenging some of the GBD’s ideas.

“I’ve seen studies come out that say, ‘Well, we had a house on fire and suddenly it got limited in terms of transmission and, so, herd immunity must be at 25 percent,” says Dr. Osterholm. “I’ve heard that for New York and Brazil’s Amazon region.”

Did they achieve herd immunity?

No, says Dr. Osterholm: “Enough suppressing activities were put into place and, in fact, transmission slowed down to the point that it was minimized. That didn’t mean you hit herd immunity. A place like New York City is just as ripe as ever for another outbreak.”

One of the central precepts of the GBD is that those people most vulnerable to the coronavirus can be isolated—“bubbled off” as some put it—from the general, healthier population.

Dr. Osterholm has an answer to that: “You can’t assume you can bubble off of people who are high risk. There are lot of people in our society who are of high risk. How do you bubble people who have increased BMIs (Body Mass Indexes) who are 35 years of age. How do you bubble if you live in a house where you are the essential worker and you come home to a multi-generational family of grandpa and grandma and your kids.”

And what is Dr. Osterholm’s view on the next best steps to combat the coronavirus?

“We want to keep everyone from getting infected until we have a vaccine available,” he says, noting that a safe and effective effective is still six to eight months away in his estimation.

But this herd immunity dispute isn’t just an exercise of the scientific method, it is a moral one in Dr. Osterholm’s opinion: “I think it is immoral, frankly, to think we should just let a lot of people get infected.”

Dr. Osterholm goes even further in his critique of the GDB and its signers: “The Barrington Declaration will go down as one of the worst moments that anyone who ever signed it will have in their public health career.”

Strong words by a man that has gotten far more right than wrong when it comes to making predictions about the coronavirus.

  • K.R.K.

Send comments to: nuqum@protonemail.com


There is substance in Trump’s distortions on mail-in voting

[Headline graphic: As long as I count the Votes, what are you going to do about it? A caricature of Boss Tweed by Thomas Nast in Harper’s Weekly, 1871. (This work is in the public domain in its country of origin.)]

By Kent R. Kroeger (Source: NuQum.com; October 20, 2020)

Over the past four years, the news media’s central, animating trope about Donald Trump has been accusations over his lying.

At least 66 more lies and misleading claims were uncovered over the weekend, according to a CNN report.

Admittedly, Trump’s willingness to spread unverified rumors does not help his reputation for honesty (Sorry, Mr. President, but there is, as yet, no irrefutable evidence that Hunter Biden pocketed a $3.5 million check from a Russian billionaire—though some genuinely inquisitive investigative reporting on that accusation and other Hunter Biden financial windfalls would be a refreshing chance of pace.)

However, scratch the surface of most of those 66 “lies” and we find that there is usually actual substance behind Trump’s words–even when the specific facts he cites are questionable.

The partisan dispute over the risks of mail-in voting is a prime example.

This weekend in Georgia, Trump told a crowd of supporters that mail-in voting was vulnerable to fraud, particularly in the nine states and District of Columbia where “unsolicited” ballots are allowed to be sent to all eligible voters. In Trump’s words, such ballot distribution methods are a “big con job” meant to encourage vote fraud.

CNN “fact-checkers” quickly slapped down Trump’s claim by noting that “fraud is exceedingly rare in U.S. elections — whether with in-person voting, mail voting in states where voters have to request ballots or mail voting in states where all eligible registered voters are sent ballots without having to make requests.”

But CNN’s fact-check claim is fraught with its own accuracy problem. Proven mail-in vote fraud, while rare, is hardly non-existent and one of its most egregious examples from a 2018 North Carolina congressional election stands as testament to how mail-in voting’s weaknesses can be exploited, even when limited “ballot harvesting” is allowed by state law.

“Ballot harvesting” is a process in which third parties with a potential stake in the election outcome gain unsupervised access to voters and their absentee ballots.

Yes, the accused in that North Carolina case, L. McCrae Dowless Jr., was a Republican operative whose stunningly reckless absentee vote tampering activities were well-documented by North Carolina state elections investigators and by The New York Times. But 18 other absentee voting fraud convictions have also occurred in the U.S. since the 2016 election, according to The Heritage Foundation’s Voter Fraud Database, which contains 1.298 proven cases of voter fraud occurring between 1979 and 2020. Relative to the total number of votes in those elections, the number of fraud cases is tiny. But the Heritage database nonetheless disproves any suggestion that mail-in vote fraud is non-existent or impossible.

However, it is not overt vote fraud that Trump and the Republicans are most afraid of in 2020—it is mail-in voting’s legal forms of vote-biasing that scares them. For example, systematically mailing multiple absentee ballots to some household types as opposed to others could significantly alter the composition of the voting electorate, which affects election outcomes. [I’ve already received two absentee ballots from the State of New Jersey. What could possibly go wrong with this approach to boosting voter turnout?]

Perhaps it takes a career survey researcher sensitive to response bias to recognize this feature of mail-in voting, but that is why this vote method most likely helps the Democrats in the current context. Mail-in voting disproportionately increases the chances of voting by previously low-turnout constituencies as it significantly reduces the effort required to vote.

What is wrong with that? Nothing, in my opinion, unless the vote choices made by mail-in voters are disproportionately influenced by those seeking and collecting those votes.

Historically, some of the Democrats’ most loyal constituencies generally register and turnout for elections at much lower rates than the typical Republican constituency (see Figure 1 below). Regrettably, but not surprisingly, the Republicans have done everything in their legal power to encourage these low turnouts (e.g., voter roll purges, increased barriers for voter registration, gerrymandering). Equally unsurprising, the Obama presidential campaigns most notably seized upon the potential for absentee (early) voting to lift those low response rates. Their belief that Democrats would be in a far superior electoral position than Republicans if Blacks and Hispanics voted at rates similar to whites is supported by the numbers.

Figure 1: Reported Voting Rates by Race and Hispanic Origin: 1980-2016 (Source: U.S. Census Bureau)

Prior to the current century, absentee voting was largely the domain of military members, the elderly and white, affluent Americans (i.e., people who are home-bound, live overseas or travel frequently), but with the John Kerry and Barack Obama  campaigns, the Democrats increasingly pursued a Get-Out-The-Vote (GOTV) strategy that placed more emphasis on absentee (early) voting over traditional in-person voting. To do that, they dramatically increased voter registration efforts and aggressively encouraged likely Democratic voters to apply for absentee ballots (in states where that was necessary). Every vote already counted as an absentee vote meant more money could be targeted late in a general election campaign on undecided and independent voters. The strategy worked in Obama’s two presidential elections (see the Black vote turnout in Figure 1)—though it failed to help down-ballot Democrats as much as expected.

Relevant to the current debate on mail-in voting, the Democrats’ increased preference for absentee voting does not require “vote-buying” or other types of ballot fraud to be effective, even if that voting method has fraud vulnerabilities not inherent to in-person voting. But going hand-in-hand with mail-in voting, unfortunately, is “ballot harvesting” where the potential increases for election outcomes to be determined by the organizational skills (and funding) of party apparatuses rather than by the genuine will of the people.

The 2020 election is all but lost for Trump and the Republicans, but we should prepare for a mail-in voting arms race in future elections. And if what’s past  is prologue (such as the election use of TV advertising, direct mail, micro-targeting, “Big Data” analytics), expect the Republican Party machine to become every bit as effective as the Democrats in exploiting mail-in voting and “ballot harvesting.”

It is a competition that I fear will do little to make our elected representatives more responsive to constituents’ interests but do a lot to ensure that the large donors who fund these mail-in and vote harvesting operations will maintain their stranglehold over U.S. public policy.

  • K.R.K.

Send comments to: nuqum@protonmail.com

The trade-off between economic growth and coronavirus containment

[Headline graphic: Components of the coronavirus: The Spike S protein, HE protein, viral envelope, and helical RNA; Graphic by https://www.scientificanimations.com; Used under the CCA-Share Alike 4.0 International license.]

By Kent R. Kroeger (Source:  NuQum.com; October 19, 2020)

Our World In Data (OWID), a non-profit organization that provides open-source access to worldwide economic and development data, recently asked a simple question on its website: Have the countries experiencing the largest economic decline performed better in protecting the nation’s health, as we would expect if there was a trade-off?

Using cross-sectional data for 38 countries on 2020-Q2 GDP growth and the number of COVID-19 deaths per capita (through June 30th), their answer was as straightforward as their question:

“Contrary to the idea of a trade-off, we see that countries which suffered the most severe economic downturns – like Peru, Spain and the UK – are generally among the countries with the highest COVID-19 death rate.

And the reverse is also true: countries where the economic impact has been modest – like Taiwan, South Korea, and Lithuania – have also managed to keep the death rate low. 

As well as saving lives, countries controlling the outbreak effectively may have adopted the best economic strategy too.”

OWID’s finding is consistent with other expert findings on the economic trade-offs associated with controlling the coronavirus:

“The coronavirus trade-off was always an illusion. Lockdown or not, there is no alternative to conquering the disease if economies are to recover,” Bloomberg economics writer John Authers concluded in June after comparing Denmark, a country that implemented a strict lockdown early in the pandemic, and Sweden, a country that eschewed stringent lockdown measures and instead sought to achieve ‘herd immunity’ as quickly as possible. According to Oxford University’s Coronavirus Government Response Tracker (OxCGRT), Denmark’s average stringency index score through June 30th was 41 (on a 0 – 100 scale where 0 = “No policy response” and 100 = “Maximum policy response.”). In contrast, Sweden’s average score was 25.

The current data for Denmark and Sweden bolsters Authers’ conclusion. As of October 18th, according to John Hopkins University’s coronavirus tracking website, Denmark has experienced 119 COVID-19 deaths (per 1 million people), compared to 581 for Sweden. In turn, their two economies shrank by similar amounts in this year’s second quarter (-8.5% for Denmark and -8.3% for Sweden). By any objective measure, Denmark has done better than Sweden in combating the coronavirus while protecting its economy.

Statistical simulation studies on the coronavirus-economic trade-off also support the general conclusion that strict containment policies (e.g., large-scale testing and quarantines) are superior to a “no policy” approach. Using simulation models combining economic and epidemiological behaviors, economists Martin Eichenbaum, Sérgio Rebelo, Mathias Trabandt recently summarized this trade-off:

“The results suggest that testing and quarantine policies should play a central role in minimising the social costs of the COVID-19 crisis.”

The authors further noted that “the optimal simple-containment policy makes the recession worse than the no-intervention equilibrium. But the policy improves welfare because it saves an enormous number of lives.”

However, the political pressure to abandon strict containment policies because of their economic costs has proven too powerful for many public officials. The authors specifically cite the U.S. experience where many states prematurely abandoned initial containment measures which led to “short-lived economic revival followed by a surge in infections, epidemic-related deaths and a subsequent second recession.”

Donald Trump is probably not going to be re-elected president largely because of that strategic error in judgment.

Are strict containment policies (e.g., lockdowns) the key to containing the coronavirus and saving the economy?

In the U.S. case, how long did those strict lockdown measures need to be maintained during the first wave in order to minimize the second wave? Until ‘zero new infections’ were recorded for a specific amount of time? Until hospital ICU utilization rates fell below a certain threshold? Until there was a vaccine?

One problem with making definitive statements in any direction regarding coronavirus containment policies is that the pandemic is ongoing (the world reported a daily record of 411 thousand new coronavirus cases on October 16th, according to Johns Hopkins University). Everything is a moving target right now. Furthermore, the economic costs of strict coronavirus policies are often felt immediately, while their benefits can be delayed for weeks, even months. In such a dynamic environment, relating specific policies to specific outcomes (e.g., economic growth, COVID-19 deaths) is not easy.

But despite these methodological problems, researchers do have the benefit of hundreds of test subjects (i.e., countries) employing different coronavirus containment strategies at different points in time; and though they cannot randomly assign countries to specific containment strategies, there are quasi-experimental controls to mitigate the downside of that problem.

In the midst of these challenges, evidence is emerging that suggests strict lockdown policies are not the only (or even the best) approach to coronavirus containment. This becomes apparent when we compare countries based on the strictness of their coronavirus policies (as measured by Oxford’s Stringency Index), their cumulative number of COVID-19 deaths (per 1 million people), and their economic health (as measured by changes in GDP).

An Analysis of Economic Growth and Coronavirus Containment in 38 Countries

Figure 1 lists the 38 countries OWID used in the following trade-off analysis of coronavirus containment policies and economic growth for the period from January 1st to June 30th, 2020. Each country was placed into one of four quadrants based upon their relationship to the sample average for COVID-19 cumulative death rates and the strictness of coronavirus containment policies. For example, Japan and Latvia have (so far) experienced below average COVID-19 death rates while implementing some of the least stringent coronavirus policies. In contrast, Belgium and Portugal have seen above average COVID-19 death rates while pursuing some of the strictest coronavirus policies.

Figure 1: The 38 countries in this study sorted by coronavirus policy strictness and COVID-19 cumulative death rates (from January 1 – June 30).

Recall the conclusion from OWID: There is a positive relationship between low COVID-19 death rates and GDP growth rates—the presumption being that effectively fighting the coronavirus is a necessary condition for a nation’s economic health.

You’ll get little argument from me on that conclusion, but the question remains, how does a country “effectively” fight the coronavirus?

Oxford’s Stringency Index (SI) is a semi-weekly index measuring the strictness of a country’s coronavirus policies (e.g., economic lockdowns, school closings, mandatory contact tracing, etc.). From January to June, using a daily average, the Stringency Index rated the policies in the Philippines (SI = 61.3) as the strictest in the world, followed by countries such as Peru (56.2) and Italy (54.9). This conforms with news media accounts in those countries (Philippines, Peru, Italy).

On the other side of the coin, the SI rated the coronavirus policies in Taiwan (23.0), Sweden (25.4) and Japan (29.8) among the least strict from January to June. This too conforms with media accounts (Taiwan, Sweden, Japan).

With this information, I calculated the average GDP growth rate (Q2) in each of the four quadrants in Figure 1 (Note: the average was not weighted by population). Figure 2 shows the Q2 GDP growth averages for the four country groups.

Figure 2: Average GDP Growth (2020-Q2) by Policy Stringency Index and COVID-19 Deaths (per capita) Categories (n = 38 countries; numbers on vertical bar represent upper and lower estimates)

Only the difference in GDP growth rates between the first quadrant (Least Stringent/Low Death Rate) and the fourth quadrant (Most Stringent/High Death Rate) is statistically significant (t-statistic = -2.45, p = 0.028). However, within the two High Death Rate quadrants (i.e., the two plots on the right in Figure 2), there is an indication of a negative relationship between strict coronavirus policies and GDP growth: In countries hard hit by the coronavirus, it is those countries with the strictest policies that have had lower economic growth.

For a further look at these relationships, I estimated a linear model of GDP growth rates for the 38 countries, with policy strictness (average Stringency Index over the period) and the cumulative COVID-19 death rate (per 1 million people) as independent variables (see Appendix, Figure A.1). Both independent variables are statistically significant (negative) correlates with GDP growth, and with similar strength. High coronavirus death rates are associated with lower economic growth. But so are strict coronavirus policies. It leaves policymakers with an apparent ‘Damned if I do, and damned if I don’t’ choice to make when combating the coronavirus. [Though, somehow, countries such as Japan and South Korea were able to keep their death rates low while simultaneously keeping their economies relatively open.]

Final Thoughts

Sweden may have opted for the wrong strategy in controlling the coronavirus, but the net result, economically, has been similar to other European countries that adopted much stricter policies.

It is not an accident that Germany Chancellor Angela Merkel has already indicated Germany will not implement strict lockdown policies during the current, second wave of the coronavirus in Europe. Germany will find alternative, presumably more economically friendly, policies to combat the coronavirus.

“We all want to avoid a second national shutdown and we can do that,” Merkel told a session of the German Bundestag.

If you want to find economic success stories during the 2020 coronavirus pandemic up to now, don’t look to Denmark or Germany, look in East Asia.

I have my theory as to why this may be true: Culture. Culture. Culture.

Viruses do not spread as fast in cultures where people self-isolate when they feel sick, and where masks in public out of habit and kindness. Any threat to their personal freedom and privacy from aggressive contact tracing is perceived as minor compared to the potential benefit to the societal collective. And it is not top-down, state-dictated collectivism at work in countries like South Korea and Japan, but the bottom-up variety: people didn’t need to be told wearing masks and keeping their social distance was the right thing to do, they already knew.

Personal liberty helped forge the great economies of Europe and North America in the 19th and 20th centuries, but the idea that collective (bottom-up) rationality may be the engine behind future economic growth is hard to swallow for many of us raised on the moral certitude of the Founding Fathers and American exceptionalism.

The coronavirus might be making that economic philosophical battle even more palpable.

  • K.R.K.

Send comments to: nuqum@protonmail.com
or DM me on Twitter at: @KRobertKroeger1


Research Postscript:

Along with estimating a linear model for GDP growth among the 38 selected countries, I also estimated a similar model for the 50 U.S. states (plus District of Columbia). That regression model is shown in the Appendix (Figure A.2). Compared to the world model and its two predictors of GDP growth (Figure A.2), the U.S. model was not a particularly good fit of the data, despite having five predictors. Surprisingly, the strictness of state coronavirus policies (as measured by Oxford’s Coronavirus Government Response Tracker [OxCGRT]) did not come close to statistical significance. Instead, three significant correlates with state-level GDP growth in 2020-Q2 were (in order of relative effect): (1) The state’s number of COVID-19 cases (per 1 million people), (2) the state’s number of COVID-19 deaths (per 1 million people), and (3) the average annual number of flu deaths in the state (per 1 million people).

The relationship between COVID-19 cases and GDP growth in 2020-Q2 was positive. That is, states with higher relative numbers of COVID-19 cases had higher GDP growth. Conversely, the relationship with COVID-19 deaths was negative. That is, states with higher relative numbers of COVID-19 deaths had lower GDP growth. Finally, annual flu deaths had a negative relationship to GDP growth: states with a relatively high number of annual flu deaths tended to have lower GDP growth rates, all else equal. My interpretation of this last relationship is that flu deaths represent a proxy measure of a state’s health care system quality (and health of its citizens). States with a high percentage of uninsured residents or unhealthy citizens may be experiencing significantly lower economic growth due to the coronavirus as a result.

APPENDIX: Regression Output

Figure A.1: Linear Model of Q2 GDP Growth % (n = 38 countries)


Figure A.2: Linear Model of Q2 GDP Growth % (n = 50 U.S. states + D.C.)


Catholics and the Coronavirus

[Headline graphic: St. Gertrude Catholic Church (Chicago, Illinois), April 2020 (Photo by: Paul R. Burley; Used under the CCA-Share Alike 4.0 International license.)

Data used in this article can be found on GITHUB

By Kent R. Kroeger (Source: NuQum.com, October 14, 2020)

In August I posted an article discussing the importance of culture in modeling cross-national variation in coronavirus case and fatality rates. Its basic premise was that some cultures are more amenable to the individual-level behavioral changes (e.g., wearing masks and social distancing) needed to stunt the spread of the virus (i.e., East Asian collectivist cultures), while other cultures are more prone to spreading the virus (i.e., American individualism).

One reader suggested another culturally-based explanation for some of the cross-national variation in coronavirus cases, particularly among European nations: Catholicism.

My initial reaction was that the suggestion was plausible given that Belgium, France, Italy, Spain, and Mexico are majority-Catholic countries (see Figure 1) and were among the countries with the highest infection and deaths rates at that time.

Figure 1: Percentage of Catholics in European and other selected countries

Writing in early August, researchers at Georgetown University’s Center for Applied Research in the Apostolate (CARA) noted in their research blog:
“Looking globally at the most recent COVID-19 death rates per 100,000 population in countries with available data, it becomes apparent that some Catholic countries have been hit harder than others. As of yesterday, 17 countries had more than 30 deaths per 100,000 people. More than three in four of these countries have Catholic majority populations (as measured by the Annuarium Statisticum Ecclesiae and Pew Research Center estimates).
The only countries that are not majority Catholic in the 17 hardest hit are the United States (47.93 deaths per 100,000), the United Kingdom, Sweden, and the Netherlands. The latter two countries have not embraced masks and lockdowns as other countries have.”

But why would Catholic countries be more susceptible to the coronavirus? Catholicism is being confounded with more logical causal factors, I surmised. For example, Catholic-majority countries in Southern Europe are generally poorer than Northern European countries. It is also true that practicing Catholics tend to be older (a subgroup more vulnerable to the coronavirus) and have slightly larger household sizes; but, when I included country-level measures for GDP per capita, median age and average size of household in my statistical models, none came close to statistical significance.

I subsequently dismissed Catholicism as a likely factor in explaining the spread of the coronavirus, despite the prima facie evidence in its favor. [If 30 years of statistical modeling has taught me anything, don’t get too attached to seemingly plausible explanations and theories.]

However, a few days ago a former colleague sent of me a link to a 2016 study published by the Public Religion Research Institute (PRRI): Race, Religion, and Political Affiliation of Americans’ Core Social Networks, by Daniel Cox, Juhem Navarro-Rivera, and Robert P. Jones, Ph.D.

The study took an in-depth look at Americans’ closest personal relationships and found that the average American (n = 2,317) has 3.4 people in their close social network (see Figure 2), with Black protestants (n = 166) having the most (3.7 people) and the religiously unaffiliated having the least (3.2 people). Catholics (n = 502) reported 3.6 people in their close social network.

Figure 2: Social Network Sizes by Religious Affiliation (Source: PRRI)

More discriminating is the percentage of respondents with more than seven people in their close social network. Twenty-four percent of Catholics reported seven or more people in their social network, more than any other religious affiliation.

Coincidently, as I began to search for cross-national data on social network sizes (I found little), the Centers for Disease Control and Prevention (CDC) posted in its Morbidity and Mortality Weekly Report a case study about a family reunion in June-July 2020 where 20 family members from five households, including one teen exposed to SARS-CoV-2 prior to the reunion, spent three weeks at a vacation retreat.

Subsequently, 11 family members contracted the coronavirus.

“There is increasing evidence that children and adolescents can efficiently transmit SARS-CoV-2, the virus that causes coronavirus disease 2019 (COVID-19),” says the CDC report. “This investigation provides evidence of the benefit of physical distancing as a mitigation strategy to prevent SARS-CoV-2 transmission. None of the six family members who maintained outdoor physical distance without face masks during two visits to the family gathering developed symptoms.”

While these findings aren’t surprising, it highlights a possible causal mechanism for linking cultural characteristics prevalent among Catholic families with the spread of the coronavirus.

The Data

In studying the relationship of Catholic-majority countries to the spread of the coronavirus, I controlled for other factors that should correlate with cross-national differences:

I obtained data on the percentage of Catholics in 40 highly-developed countries from Catholic-Hierarchy.org (see Figure 1). For the summary measure of health care system quality I created an additive index based on three health care system components relevant to the treatment of COVID-19: (1) the number of nurses per 1,000 people, (2) the number of hospital bed per 1,000 people), and the percentage of the country’s population with medical insurance (public or private). All three health care sub-measures were converted to z-scores before creating the index score. The health care system quality index scores for each country can be seen in the Appendix (see Figure A.1).

Finally, the national-level suppression and mitigation policy daily index scores (Oxford’s Stringency Index) were averaged within each country over a period from January 20 to April 30, 2020. The intent was to assess whether stringent S&M policies early in the pandemic were effective in reducing the cumulative number of COVID-19 cases (as of October 11, 2020). The Stringency Index scores for each country can be seen in the Appendix (see Figure A.2).

The Linear Model

Figure 3 shows the linear model output for this four-variable model. All four variables were statistically significant and in the expected direction. National testing levels appear most strongly associated with the relative number of COVID-19 cases (i.e., more testing = more positive cases) with a standardized Beta coefficient (β) of 0.643, followed by stringency measures (β = -0.365), percentage Catholic (β = 0.312), and the health care system quality index (β = -0.273). [Given the small sample sample size (n = 40), take these differences in parameter estimates with a grain of salt.]

Overall, this simple, four-variable model explains almost two-thirds of the variance in COVID-19 cases per capita for the 40 countries in the sample.

Figure 3: Linear Model Predicting Number of COVID-19 Cases per 1M People for 40 Selected Countries (Regression model was weighted by population; Data sources: Johns Hopkins University – CSSE, Oxford University, OECD, Catholic-Hierarchy.org; Analytics by Kent R. Kroeger)

When we plot the 40 countries in our sample by their model prediction and actual values, some interesting outliers appear. Among those countries with relatively fewer COVID-19 cases per capita than predicted by the model, New Zealand, Hong Kong (not a country!), Iceland, Australia, Latvia, Lithuania, Denmark and Luxembourg stand out. Apparently, in controlling the coronavirus, it helps to either be a highly-controlled border (particularly an island) or a Baltic state.

On the not-so-good list–that is, more COVID-19 cases per capita than otherwise predicted by the model–are countries like Ukraine, Czechia, Israel and the U.S.

Figure 4: Predicted versus Actual Number of COVID-19 Cases per 1M People (Data sources: Johns Hopkins University – CSSE, Oxford University, OECD, Catholic-Hierarchy.org; Analytics by Kent R. Kroeger)

I admit that this model is too simple and static. In the real world, parameter estimates are themselves variable over time, not to mention that data quality (e.g., measurement error by a country’s statistical office) limits our ability to explain much of the nation-level variation.

Variables that once had a strong relationship in my early models of the coronavirus (namely, population density), have ceased to show statistical significance. Likewise, S&M policies that were once insignificant or significant in an unexpected direction (e.g., lockdown policies), now appear significant in the expected direction. According to this latest model, stringent suppression and mitigation measures work when they are adopted early in a pandemic.

Still, there are countries like Japan that have not enforced draconian S&M measures, yet have effectively controlled the spread of the coronavirus.

Culture matters, such that, in the cases of Japan and South Korea, whose histories include significant periods of authoritarian rule, citizens appear much more compliant with strict coronavirus measures regarding the wearing of masks and social distancing. In contrast is the United States where a significant percentage of the population puts a high premium on individualism and personal freedom.

There is no simple policy solution for this virus, but there is concrete evidence that culture is a significant factor in explaining how well nations are handling the pandemic. Culture can either work with for or against national efforts to control this virus.

In the above model, countries with a higher percentage of Catholics have, all else equal, a relatively higher level of coronavirus cases. I suspect this statistical relationship is driven by Catholicism’s generally larger, closer family networks. But I’m using aggregate data to explain nation-level outcomes. To understand what is really going within Catholic populations and the coronavirus, individual-level data is needed.

Furthermore, there is anecdotal evidence that religion affiliations other than Catholicism are significant factors in other countries with respect to the coronavirus. In Israel, a significant number of COVID-19 cases can be linked to the ultra-Orthodox Hasidic community’s participation in large-group religious activities. Similar religious activities in the U.S. have also been linked to cluster outbreaks of COVID-19, including a Houston, Texas Catholic Church which experienced a major cluster outbreak of COVID-19.

Is it large, tightly-knit social networks or large-group gatherings driving a seemingly a high incidence rate of coronavirus cases in countries with large Catholic populations?

Or perhaps singling out Catholicism altogether, as I’ve done here, is a mistake? Maybe it is something about groups of people congregating for any reason that is the true causal factor at play? [Who in the hell in Texas thought filling up Kyle Field stadium with 24,700 fans at the Texas A&M-Florida game last weekend was a good idea?]

What is irrefutable in my view is that there is no threat to humans more addressable at the individual-level than a viral pandemic.

Wash your hands. Wear a mask. And keep your distance.

How hard is that? It shouldn’t take a president (or any leader) setting a good example to inspire such simple and effective behavior by a country’s citizens. The end of this pandemic is in our own hands.

  • K.R.K.

Send comments to: nuqum@protonmail.com
or DM me on Twitter at: @KRobertKroeger1


APPENDIX:

Figure A.1: Health Care System Quality Index


Figure A.2: Stringency Index (Daily Avg. from January 20 to April 30, 2020)


The Democrats and GOP ignore America’s massive political center at their own risk

(Headline graphic by Sagearbor; used under the CCA-Share Alike 4.0 International license.)

By Kent R. Kroeger (Source: NuQum.com; October 9, 2020)

Why is it that the two major U.S. political parties (but particularly the Democrats) make little effort to attract voters who are, for various reasons, detached from the two-party system?

Loosely called the ‘political center,’ when they do get attention it is mostly from academics who divide them up into “independents,” “undecideds,” and ideological “centrists,” and generally dismiss them as less-informed and prone to emotional  appeals from politicians.

Occasionally, a political campaign will spend some of its finite campaign funds on attracting “centrist” voters; but, for the most part, the modern U.S. political campaign today spends the vast majority of its money on rallying their partisans and getting them to vote.

But why so little attention to a political center that is presumably capable of changing the outcome in a tight election?

According to many in the political and media establishment, the reason is simple: There is no political center in the U.S. anymore. Eligible voters are either Democrats or Republicans, even if they don’t categorize themselves as such. And those who don’t fit neatly into the GOP vs. Democrat box are essentially irrelevant.

In October 2015, The New Yorker‘s Ryan Lizza  offered this analysis: “The center is dead in American politics.”

Two years later, New York Magazine’s Eric Levitz shared a similar epiphany with readers: “The Democrats can abandon the center—because the center doesn’t exist.”

If two New York-based writers can’t convince you that the political center is irrelevant, let New York-based data guru Lee Drutman take a stab:

“Stop me if you’ve heard this one before: Independent voters will decide the election. Or better yet: Moderate voters will decide the election. Or, wait for it … If Democrats can move to the middle, they will win in 2020.

These tropes conjure up a particular image: a pivotal bloc of reasonable “independent” voters sick of the two major parties, just waiting for a centrist candidate to embrace a “moderate” policy vision. And there’s a reason this perception exits: You see just that if you look only at topline polling numbers, which show 40-plus percent of voters refusing to identify with a party, or close to 40 percent of voters calling themselves moderates.1 But topline polling numbers mask an underlying diversity of political thought that is far more complicated.

Moderate, independent and undecided voters are not the same, and none of these groups are reliably centrist. They are ideologically diverse, so there is no simple policy solution that will appeal to all of them.”

Drutman’s data-driven argument is thick with condescension and contempt for segments of U.S. society (moderates, independents and undecided voters) for which he offers one insightful observation: “None of these groups are reliably centrist.”

Drutman’s observations, however, are not novel. Political scientists have been marginalizing the political center for over 60 years, starting with the seminal work, The American Voter, and reinforced more recently by Christopher Achen and Larry Bartels in their 2016 book,  Democracy for Realists: Why Elections Do Not Produce Responsive Government, in which they concluded the electorate neither understands nor particularly cares about policy, but instead are motivated by their group identities when making political choices.

“Most democratic citizens are uninterested in politics, poorly informed, and unwilling or unable to convey coherent policy preferences through ‘issue voting,'” write Achen and Bartels. “Voters, even the most informed voters, typically make choices not on the basis of policy preferences or ideology, but on the basis of who they are—their social identities.”

In summarizing  Achen and Bartel’s work, journalist Noah Berlatsky  concluded, “Voters’ policy choices typically demonstrate not thoughtful centrism, but galumphing ignorance and indifference.”

What is clear from the work of Drutman, Achen, Bartels and other political scientists, they have never worked in a competitive consumer environment. If a data analyst ever came to me and said, “We can’t build our customer base because our non-customers are too diverse and unpredictable,” that person would be re-assigned to accounting.

What political scientists are basically saying is that there is no policy solution to attract disengaged voters that fit their notion of what defines the political left and right.

As I will show below—and as Drutman actually finds but does not acknowledge in his own analysis–there is a large segment of the U.S. vote-eligible population with policy preferences out of alignment with elite assumptions on how someone’s policy views should relate to their self-ascribed ideology and partisanship.

For example, there are registered Democrats who are pro-gun control yet support strictly limiting immigration into the U.S; just as there are registered Republicans who are skeptical about the importance of climate change, but support increasing taxes on the wealthy. There is no stone tablet that says someone on the political left (or right) cannot be pro-life and also a strong supporter of Medicare-for-All.

Not only do people with hard to categorize opinions exist, there are a lot of them. And many of them vote—though not to the degree as strong partisans. Therefore, they may be an expensive vote to capture, but given their numbers, they may well be worth the effort.

When Drutman and his Manhattan happy hour companions dismiss the ideological inconsistencies of the political center, they are in fact describing and enforcing the artifice of a political system designed to marginalize a significant percentage of Americans.

Through their personal, day-to-day interactions with friends and family, as well as their regular diet of mainstream news, Americans have come to believe some issue positions are inherently incompatible with correct-thinking liberals or conservatives.

It’s a self-reinforcing feedback loop that serves the two major political parties and their corporate patrons very well. What better way to guarantee the American voter will only support one of the two establishment parties than to make the average American think there are only two rational choices on Election Day.

In reality, there is a significant percentage of Americans largely disconnected from the dominant narrative driving today’s political discussion about political ideology, partisanship and policy.

So why are so many in the national media so determined to convince Americans that the U.S. no longer has a political center?

Perhaps the Chinese philosopher Lao Tzu offers a clue:

“If you search everywhere, yet cannot find what you are seeking, it is because what you seek is already in your possession.”

I prefer the axiom’s complement, first articulated in my recollection by Sherlock Holmes:

“You can’t find what you aren’t looking for.”

An apparent consensus of political and media elites conclude that the political center doesn’t exist in the U.S. because they simply aren’t looking for it.

When one actually looks at the data, however, a large and politically relevant political center is impossible to miss.

The Data

For the following charts, I analyzed the American National Election Studies (ANES) 2019 Pilot Study, an internet-based survey of 3.000 U.S. adults conducted by YouGov.com from December 20-31, 2018. The data for the charts below are weighted to match national characteristics on gender, age, race/ethnicity, education, geographic region, and presidential candidate choice.

This survey, now over one year old, was chosen for its public availability and the wide range of policy questions it asked respondents in the month after our last nationwide election.

The Results

To facilitate this data presentation, I segmented the U.S. adult population into six policy clusters based on 43 attitudinal and policy-related questions in the ANES 2019 Pilot study and sorted these segments based on their relationship to respondents’ self-described ideology (see Figures 1a and 1b below). The policy clusters are as follows (from most supportive of Trump to least): Strong Conservative, Moderate Conservative, Center-Right, Center-Left, Moderate Liberal, and Strong Liberal.

The attitudinal and policy items used for the cluster analysis are listed in Appendix A below.

While my naming convention confounds the two distinct concepts of partisanship (Republican-Democrat) and ideology (Conservative-Liberal), it is important to emphasize that this attitudinal segmentation is based solely on policy attitudes and opinions.

Figure 1a: The Six Policy Clusters

Figure 1b: The Six Policy Clusters by Self-described Ideology

In December 2018, a month after the Democrats regained the U.S. House in the midterm elections, strong and moderate liberals far outnumbered strong and moderate conservatives (40 percent to 27 percent, respectively). The largest policy clusters were the Center-Left (22%, 50.6 million people) and Strong Liberal (21%. 48.3 million people) segments, and the smallest were the Strong Conservative (14%, 32.2 million people), Moderate Conservative (13%, 29.9 million people), and the Center-Right (11%, 25.3 million people).

The center of American politics may contain 76 million Americans. Even if only 40 percent vote (as in 2016), that represents about 30 million people.

Figure 2: The Six Policy Clusters by 2016 Presidential Vote Choice

Figure 2 (above) vividly shows why Hillary Clinton lost to Donald Trump. Though her policy-related base was probably larger than Trump’s at the time, she was unable to keep their loyalty. Only 79 percent of Strong Liberals voted for Clinton compared to the 94 percent of Strong Conservatives who voted for Trump. A similar picture emerges with Moderate Liberals and Moderate Conservatives.

More interesting, perhaps, is what happened with those Americans with hard to categorize policy views (i.e., Center-Right and Center-Left).  The majority of both segments voted, but while the Center-Left was evenly divided between Trump and Clinton, the Center-Right decisively preferred Trump over Clinton (36% to 24%, respectively).

If we account for the different sizes of these six policy clusters, we can infer from Figure 3 that there were enough Trump voters among the Center-Left that had Clinton persuaded one-sixth of them to vote for her instead of Trump, she would have gained around 2 million additional votes.

Remember she lost the Electoral College by around 70,000 votes in a handful of key states (MI, PA, WI).

Figure 3: The Size of the Six Policy Clusters and their 2016 Presidential Vote Choice

While many factors in 2016 assembled to create the perfect anti-Clinton storm, a contributing ingredient was her inability, in contrast to Trump, to attract voters in the political center.

Clinton’s failure is evident in the volumes implied in Figure 3:

  • Around 2 million Moderate Liberals voted for Trump.
  • Around 14 million Center-Left voters voted for Trump.
  • Around 4 million Moderate Liberals voted Third Party.
  • Around 4 million Strong Liberals voted Third Party.

Who is in the political center?

As Drutman found, categorizing the political center is not easy. They are a motley blend of various social backgrounds and attitudes. The center is far from homogeneous. But, according to data from the ANES 2019 Pilot Study, centrists do stand out from the other policy clusters across a number of key demographic measures.

Compared to the other policy segments, the two center clusters are younger, more female, less educated, and living in lower-income households (see Appendix B below for the detailed demographic charts).

The two center clusters do, however, differ substantially from each other on race/ethnic composition (see Figure 4). Fifty-five percent of Center-Left members are non-white, compared to only 23 percent of the Center-Right.

Figure 4: The Six Policy Clusters by Race/Ethnicity

The Center-Left is racially and ethnically diverse, and the Center-Right much less so (though the Center-Right is the most diverse of the three right-of-center clusters).

Notable also is that the three left-of-center clusters are substantially more diverse in terms of race/ethnicity than the three right-of-center clusters. There should be no doubt among political operatives that the growing racial/ethnic diversity of the American population currently works in the favor of the Democratic Party. But, as I will show next, that conclusion must include a recognition that there are policy issues—should they become election drivers—that could driver Center-Right voters to the left and, vice versa, drive Center-Left voters to the right.

The Democrats have been ceding the Center to the GOP

Arguably, at least since the 1990s, establishment leaders for both the Democrats and Republicans have eschewed compromise on their party’s core issues. For the Democrats, no issue is as central to the party’s ideology as abortion rights.

Prior to the 2016 campaign, Democratic Party platforms and presidential candidates had generally argued for making abortions “safe, legal, and rare.” With the 2016 and 2020 campaigns, however, the Democratic Party platform dropped that rhetorical pretense and opted, instead, for an uncompromising view of abortion rights:

Democrats believe that every woman should be able to access high-quality reproductive health care services, including safe and legal abortion…

…Democrats oppose and will fight to overturn federal and state laws that create barriers to women’s reproductive health and rights. We will repeal the Hyde Amendment, and protect and codify Roe v. Wade.

In practical terms, the national Democrats believe an abortion should face restrictions no greater than that for getting a tooth pulled. The national Republicans, for their part, have been consistently anti-abortion since the Supreme Court’s 1973 Roe v Wade ruling.

As for the Republicans, among their ideological blind spots, no issue activates their lizard brain faster than the concept of universal, single-payer health care.

‘Socialized medicine!’ the GOP cries anytime even modest health care reform measures–such as Obamacare–are considered in Congress. Obamacare–a reform whose core idea is to unleash the IRS on Americans who refuse to buy health insurance–is to ‘socialized medicine’ what former New Jersey Governor Chris Christie is to Olympic pole vaulting.

Given how polarized party leaders are on these two issues–abortion and universal health care–it is surprising the Democrats are choosing to ignore a large number of people they may be losing at election time because they are not consistently marketing their candidates to the political center.

For example, the 2016 Clinton campaign may have lost two million potential votes for failing to appeal more aggressively to Center-Right voters on abortion rights. According to data from the ANES 2019 Pilot Study, 33 percent of Center-Right say they would be at least “moderately upset” if abortion restrictions were increased (see Figure 5). That translates to 8.3 million people in a segment where only 6.1 million voted for Clinton in 2016.

Figure 5: The Six Policy Clusters by Attitudes Towards Abortion Restrictions

The Democrats make a similar mistake with the political center on universal health care (e.g., Bernie Sanders’ Medicare-for-All proposal). Thirty-two percent (i.e., over 8 million) Center-Right Americans at least moderately support Medicare-for-All (see Figure 5). That’s a higher level of support than among Center-Left Americans.

Figure 6: The Six Policy Clusters by Attitudes Towards Medicare-for-All

But wouldn’t a Medicare-for-All appeal by the Democrats turn off some of their core supporters? Of course that is the risk–which is why  persuasion still matters in American campaigns. Sometimes, to win elections, candidates need to lead their base as they try to expand their electoral coalition beyond their base.

It’s called strategic adjustment.

Given that health care is perennially among the most important issues to voters at election time, consider the vote potential squandered by the Democrats when they spend more time defending private health insurers and pharmaceutical companies than advocating for guaranteed, affordable universal health care. According to the ANES 2019 Pilot Study data, 48 percent of Center-Right Americans are at least “very” concerned about future medical expenses–the highest level of any of the six policy clusters (see Figure 7).

Figure 7: The Six Policy Clusters by Fear of Medical Expenses

And, conversely, the Republicans jeopardize their own electoral competitiveness when the continue to oppose universal health care proposals favored by almost half of Center-Right Americans.

Final Thoughts

Let me preface my last comments on the American political center by emphasizing what is NOT meant by “making appeals to the political center.”

Centrist voters are not necessarily attracted to centrist candidates or ideas. Quite the opposite, the research suggests they are more motivated by emotional appeals than specific policy ideas; such that, namby-pamby, wishy-washy “middle-of-the-road” rhetoric is not the optimal path for gaining centrist support.

That psychological reality, however, has not produced policy outcomes in the best interests of most voters, according to Achen and Bartels.

But their conclusion is just a sophisticated, data-driven form of  ‘victim-blaming.’

Ideologically hard-to-classify Americans (“centrists”) aren’t intellectually lazy, they just have more important things to worry about than partisan politics—things like affordable health care, housing, and education, etc.

It is not surprising to me that political strategists and pundits find centrists frustrating. They don’t fit it neat little boxes, which is why Get-Out-The-Vote (GOTV) tactics are far more appealing to them than any meaningful efforts at persuasion.

Unfortunately, the fundamental mistake political strategists make when they advocate for GOTV strategies at the expense of appeals to the political center is the assumption that voters can be owned by a political party more easily than they can be persuaded.

It is a recipe for disaster, for it also assumes political parties and campaigns are static, non-strategic actors.

If the 2016 presidential campaign taught us anything, it is that parties and candidates can make substantive and abrupt strategic adjustments for a net political gain (Trump’s call in the 2016 election for renegotiating international trade agreements, closing down tax loopholes for hedge fund managers and ending America’s forever-wars are prime examples of this type of ideological flexibility). [Yes, I know Trump failed spectacularly on two of those promises, and it may cost him dearly in the 2020 election.]

The Democrats may not own the African-American or Hispanic vote going forward. Its a dangerous assumption that, while not likely to backfire in 2020, could easily do so in subsequent elections, especially if the GOP can demonstrate the level of ideological flexibility our current president did in 2016.

Ignoring the America’s political center is always a bad idea.

  • K.R.K.

Send comments to: nuqum@protonmail.com
or DM me on Twitter at: @KRobertKroeger1

APPENDIX A:

Attitudinal and Policy Items used for Cluster Analysis

APPENDIX B:

Demographic Characteristics of Policy Segments

It should be noted that probability-based margin of error calculations with the ANES 2019 Pilot Study are not applicable given the non-probability sampling methods used to recruit the YouGov national online panel. If YouGov’s online panel had been selected on a probability basis, the effective sample size in the ANES 2019 Pilot Study (n = 2,453) would have a margin of error of ±2 percentage points at the total sample level.

The two center policy clusters skew more female than the other policy clusters. Sixty percent of U.S. adults in the Center-Right are female, compared to just 36 percent within the Strong Conservative cluster and 47 percent within the Moderate Conservative cluster (see Figure B.1).

Figure B.1: The Six Policy Clusters by Sex

The two center clusters are more similar to the Strong and Moderate Liberal clusters in terms of average age, with members of the Center-Left being particularly young at an average age of 39 years old (see Figure B.2). Not surprisingly, the two most conservative clusters are also the oldest.

Figure B.2: The Six Policy Clusters by Age Groups

The wealthiest clusters are the Strong and Moderate Conservative clusters, both averaging over $80,000 annually for family incomes (see Figure B.3). Conversely, Center-Right and Center-Left clusters have the lowest annual family incomes ($42,995 and $46,078, respectively).

Figure B.3: The Six Policy Clusters by Annual Family Income

As seen in Figure B.4, the Strong Liberal cluster is more educated (45% with at least a 4-year college degree), followed by Moderate Conservatives (35%), Moderate Liberals (33%) and Strong Conservatives (24%). Less than 20 percent of members in the two center clusters have at least a 4-year college degree.

Figure B.4: The Six Policy Clusters by Education

While the two center clusters are similar in age, gender, education and income, they differ in their race/ethnicity composition (see Figure B.5). Over 50 percent of Center-Left members are non-white, compared to only 22 percent of Center-Right members. The least diverse clusters are the Strong Conservatives and Moderate Conservatives (17% and 15% non-white, respectively).

Figure B.5: The Six Policy Clusters by Race/Ethnicity Categories

Ballot harvesting threatens the integrity of our democracy

By Kent R. Kroeger (Source: NuQum.com; September 27, 2020)

What is it about Democratic congresswoman Tulsi Gabbard (D-HI) that compels her to call out her own party every time it appears hypocritical?

In the age of #MeToo, America’s homodox-class in the news media saw no contradiction in cheering the French film “Cuties” for its vivid exploration into the sexual awareness of young girls growing up in today’s over-sexualized, social-media-driven culture. Alone among her liberal and progressive colleagues, Gabbard has been the only Democrat to point out that the making of “Cuties” involved adults coaching underage girls how to simulate sexual acts on stage. Though many think the film is a powerful critique of today’s over-sexualized society and its impact on children, other thoughtful people believe the film fits the definition of child pornography.

Predictably, Gabbard was accused by some in the mainstream media of being aligned with QAnon-sourced conspiracy theories. Smears and name-calling are the go-to-move for today’s media and political elites.

So what is Gabbard’s next move? Attacking the Democratic Party’s current sacred cow: ballot harvesting.

‘What could be wrong with ballot harvesting?” you ask, particularly at a time when a worldwide pandemic makes any kind of mass, in-person activity — like voting at your local polling station — a threat to one’s health.

Isn’t ballot harvesting just a fast and efficient way to collect absentee (mail-in) ballots?

Gabbard’s answer is not what Democrats want to hear.

“Nothing is wrong with absentee or mail-in voting,” says Gabbard. But underneath the Democrats’ push for mail-in voting for this upcoming election is pressure for states to allow ballot harvesting.

What could be wrong with something sounding so wholesome that it requires harvesting? Is Gabbard against corn and Halloween pumpkins too?

Of course not. Rather, Gabbard believes ballot harvesting threatens the fundamental integrity of our democratic system because it allows for third parties to collect and deliver voter ballots to the state agencies responsible for counting votes.

Unlike in-person and absentee voting, ballot harvesting puts someone between an eligible voter and their vote.

So what is wrong with third parties being involved in the process?

Pretty much everything.

Here is Gabbard’s view on ballot harvesting and the role of third parties in the electoral process:

According to Gabbard: “The strength of our democracy lies in the integrity of our elections that every one of us has to have faith that our vote will count. But right now there are still many states in our country that allow for something called ballot harvesting. This is a system that allows for third parties to collect and deliver ballots for other people, potentially large numbers of people. Unfortunately, ballot harvesting has allowed for fraud and abuse to occur by those who could tamper with or discard ballots to try to sway an election for or against a certain candidate or party.”

Gabbard continues…

“Our vote is our voice, so whether in the midst of a pandemic, as we are now where mail-in-voting is likely to drastically increase, no one should get in between a voter in the ballot box. And while some states have prohibited
vote harvesting or ballot harvesting, many have not — which again allows for
abuse from third parties collecting and mishandling ballots. This is something that we’ve actually seen happen in recent elections.”

In response to the drive to make mail-in-voting the norm for the 2020 national election, Gabbard and Congressman Rodney Davis (R-IL), have introduced a bill in Congress (H.R.8285) that will “protect the chain of custody for every one of our ballots by prohibiting funding from going to States that allow ballot harvesting to occur.”

For the most part, Democratic Party leaders and their media surrogates have ignored Gabbard’s latest fusilade against party orthodoxy, but the fact remains serious questions remain if ballot harvesting is allowed to persist going into the current election.

Ballot harvesting goes beyond the normal absentee voting process. In 27 states and Washington, D.C., it’s legal for residents to allow a non-family member to mail in or drop off their ballot, according to policies tracked by the National Conference of State Legislatures.

Ballot harvesting and absentee voting are not the same thing, yet they are routinely confounded in the media.

Absentee voting does not put a third party between your vote and its official tally (through state-run election boards), while ballot harvesting does.

What could go wrong if the Democrats get ballot harvesting allowed across the country?

Leave it to a crooked Republican operative to provide the answer.

In 2016, a Republican operative used ballot harvesting to help turn a congressional election in favor of a Republican candidate.

A coordinated, unlawful ballot harvesting scheme operated in the 2018 general election in rural Bladen and Robeson counties in North Carolina’s 9th congressional district, most likely, changed the outcome of an election.

At a basic level, what happened in North Carolina’s 9th congressional district was as follows:

Leslie McCrae Dowless Jr., a political operative paid by Republican congressional candidate Mark Harris, paid local people $125 for every 50 mail-in ballots they collected in Bladen and Robeson counties. That means they could have been altered before being counted — which is what appears to have happened. Democrat votes were most likely illegally discarded through the ballot harvesting system.

This is what fraud looks like when performed by someone with no understanding on how to avoid looking like a fraud.

Its vote fraud by those who know how to avoid looking like frauds that I most fear.

In the end, the congressional election in North Carolina’s 9th district had to be re-competed, but the lesson was clear: ballot harvesting is prone to fraud.

Fast forward to 2020 and the question of ballot harvesting is largely dismissed by the media and academics.

“The evidence presented does not make the case that voter fraud is a major problem in America,” concludes Elaine Kamarck and Christine Stengleinfrom the Brookings Institute.

The research says all forms of voter fraud are extremely rare.

Yet, in fact, in addition to the North Carolina case, there is concrete evidence from the past that ballot harvesting has resulted in, at at a minimum, questionable activities.

“People were carrying in stacks of 100 and 200 (ballots). We had had multiple people calling to ask if these people were allowed to do this,” said Neal Kelley, the registrar for voters in Southern California’s Orange County.

Who were the “multiple people”?

Political operatives.

If you are like me, you’d trust “political operatives” with your life and the life of your children.

But do you trust them with our electoral process?

In 2016, California Gov. Jerry Brown signed AB1921, a California law which legalized ballot harvesting. Prior to that law, only a family member or someone living in the same household was permitted to drop off mail ballots for a voter. But under but the new law, anyone — including political operatives — are allowed to collect and return ballots.

What could go wrong?

Failure to deliver ballots in a timely manner is probably where ballot harvesting is most vulnerable to vote fraud.

In the 2020 primary, 70,330 mail-in ballots were rejected by California election officials during the March presidential primary because they were not postmarked on or before Election Day, according to the California Secretary of State.

Based on what we’ve seen in practice, ballot harvesting invariably includes cases where some ballots are delivered too late to be counted. But suppose this tardiness has a systematic (even if inadvertent) bias favoring one party over another? Worse yet, suppose a ballot harvester decides to slow-walk completed ballots from households perceived to be hostile to their preferred candidate or party?

As Gabbard points out, once a state puts third parties between the voter and the vote tallying process, the possibility of fraud grows considerably.

The direct manipulation of a ballot is not as likely an avenue for vote fraud, but hard to dismiss as a possibility.

More than 1,000 ballots were disqualified in Fresno County because the signature didn’t match the one on file with election officials. The same problem nixed over 1,300 ballots in San Diego County — and over 14,000 statewide. In some of those cases, voting experts say, a family member might have signed for others in the household, which is illegal.

In California (as in every other U.S. state), it is a felony for anyone to tamper with a ballot, which is why election officials check the signature on all mail-in ballots against the voter’s signature on record.

In some states allowing ballot harvesting, official ballots are mailed proactively to addresses known to have had eligible voters, but there is no guarantee the voter still lives there.

In cases where the voter has moved or doesn’t receive their mail directly, someone besides the voter could possess their official ballot.

Again, there is no existing evidence of systematic ballot fraud in such cases, but the possibility cannot be ignored, particularly if this method for delivering ballots becomes industrialized on a national scale.

Long delays in election outcomes will erode our nation’s already declining confidence in vote results.

Similar to what happened in California’s 2020 primary, in a New York congressional primary, election officials discarded thousands of ballots for lack of postmarks. The election result was not certified until six weeks after the election. Were the discarded ballots random or systematic? Don’t ask the State of New York, they’d rather not know.

Arizona’s 2018 senatorial election took weeks after Election Day to determine the outcome. And why? Apparently, Arizonans like to vote early, by mail, and that requires significantly more work for Arizona elections officials.

Arizona state law requires a mail-in ballot to be sealed and signed, and elections officials must match each signature to the one on file with the voter’s registration before even opening the envelope.

In 2018, that meant 1.7 million individual signatures that had to be confirmed by hand.

This tedious process is exacerbated in the final days of an election when mail-in ballots flood a state’s election officials, who on election day are dealing with the significant complexities of in-person voting.

Was the delay in the 2018 election indicative of an illegitimate election in Arizona? No, but did it invite multiple conspiracy theories suggesting as much? An undeniable, ‘Yes.’

And it is in that operational space where our democracy erodes with ballot harvesting.

Are there potential benefits to ballot harvesting?

Certainly, yes.

The 2018 midterm election was the first California election where the state’s Democratic party fully capitalized on ballot harvesting, which had been legalized in 2016.

As seen in Figure 1—which shows the change in California eligible voter turnout by county racial composition (i.e., % of county population that considers themselves ‘white only,’ according to the 2010 U.S. Census) — in California counties under 55 percent white, voter turnout increased between the 2014 and 2018 midterm elections by 18.7 percentage-points, compared to only 13.2 percentage-points for counties over 85 percent white.

Figure 1: Change in California Eligible Turnout by County Racial Composition (Source: California Secretary of State)

Image for post

This turnout increase cannot necessarily be attributed to ballot harvesting, as the numbers in Figure 1 are based on aggregate, county-level data. Furthermore, the turnout increases in California’s least-white counties were also a function of non-white voters being much more energized than white voters. Call it the Trump Effect if you will, but there is little argument that the Trump presidency, independent of loosened mail-in ballot procedures, drove a lot of Americans to the polls, many of whom wouldn’t have voted otherwise.

Still, according to a U.S. Census report the nationwide turnout increase for Hispanic and Black voters in 2018 was between 10.8 and 13.4 percentage-points over 2014. The significantly higher turnout increases in California’s least-white counties encourage fair speculation that ballot harvesting may have partially been responsible for those higher numbers.

The same U.S. Census report points out that non-Hispanic whites still turnout to vote at a higher rate than non-Hispanic Blacks, non-Hispanic Asians, and Hispanics (57.5%, 51.4%. 40.2%, and 40.4%, respectively).

Any improvement to our voting process that narrows racial and ethnic vote turnout gaps is a good thing. But there are better ways to increase voter turnout than ballot harvesting, which creates a security vulnerability that can’t be brushed off as a ‘conspiracy theory’ or ‘fake news.’

Journalists and political analysts at major media outlets — such as MSNBC, CNN, Slate.com and Politico.com — continue to say there is ‘zero evidence’ of vote fraud related to ballot harvesting, but that assertion is itself demonstrably false. Besides, within any system where a potential vulnerability is identified, waiting for the vulnerability to be exploited before addressing the problem is not good systems management. In fact, its a recipe for disaster.

And that is what could happen if ballot harvesting becomes a national norm for our future elections.

Tulsi is right again.

  • K.R.K.

Send comments to: nuqum@protonmail.com
or DM me on Twitter at: @KRobertKroeger1

Are China and Russia moving too fast on a coronavirus vaccine?

[Above graphic is a combined image from a 3D medical animation, depicting the shape of the coronavirus as well as the cross-sectional view. Image shows the major elements including the Spike S protein, HE protein, viral envelope, and helical RNA (Image by https://www.scientificanimations.com; used under the Creative Commons Attribution-Share Alike 4.0 International license.]

By Kent R. Kroeger (Source: NuQum.com, September 22, 2020)

In May, the University of Minnesota’s Center for Infectious Disease Research and Policy (CIDRAP) — one of the world’s leading research centers on infectious diseases — issued a warning about any expectations of a coronavirus vaccine being available soon or 100 percent effective once available.

Among CIDRAP’s recommendations for policymakers were these two warnings:

States, territories, and tribal health authorities should plan for the worst-case scenario, including no vaccine availability or herd immunity.

Risk communication messaging from government officials should incorporate the concept that this pandemic will not be over soon and that people need to be prepared for possible periodic resurgences of disease over the next 2 years.

Five months later, their cautious words remain relevant.

While the world may be closer than ever to its first regulatory-approved coronavirus vaccine — at least nine vaccines are already in Stage 3 testing — there is a concern among scientists that this first vaccine may not be effective enough to achieve herd immunity (estimated to be around 60 to 70 percent of a population) and could discourage the development of significantly better alternatives.

This month, China announced it has started to deploy two state-approved coronavirus vaccines— both developed by Sinopharm, a state-owned pharmaceutical company — and has already vaccinated over 100,000 people.

Remarkable is that China is doing this while still in Phase 3 trials for the vaccines (see Figure 1 below for a description of the five stages/phases in vaccine development).

In addition to China, Russia has also approved a new coronavirus vaccine.

Scientists outside of China are predictably concerned and skeptical of China’s aggressive vaccine rollout.

“One needs to carefully conduct clinical trials of adequate size with adequate time for follow-up, look at both efficacy and safety, and those data have to be very carefully reviewed before you start giving the vaccine to people outside of a carefully designed clinical trial,” Daniel Salmon, director of the Institute for Vaccine Safety at Johns Hopkins, told Vox’s Lili Pike.

Phase 3 trials are critical as they involve around 30,000 test subjects and are designed to reveal rare, adverse reactions to test vaccines. For example, if just 1 out of 30,000 vaccine recipients (0.33 percent) has a fatal reaction to an otherwise highly-effective vaccine (say, 90%), that could translate into 260,000 vaccine-related deaths if the vaccine were given to the entire world population.

Figure 1: The 5 Stages of Vaccine Development

Image for post

Image courtesy of Wellcome Trust

However, John Moore, an immunologist at Weill Cornell Medical College, believes China, given its current low infection rates, could afford to wait until Phase 3 trials are completed in order ensure a safe and effective vaccine.

But Moore’s calculus ignores a more powerful dynamic behind China (and Russia) aggressively rolling out coronavirus vaccines far ahead of standard practice in new vaccine development, which typically takes around 10 years.

The fastest development ever was for the mumps vaccine which took four years from start to final regulatory approval.

The economies of China and Russia have been deeply hurt by the coronavirus pandemic (as have all world economies) and there is a strong incentive to end this pandemic as soon as possible — even at the risk of exposing their own citizens to potentially unsafe or ineffective vaccines. The cost-benefit analysis in autocratic societies is fundamentally different than in capitalist democracies such as in the U.S. and European countries.

If China and/or Russia are successful with their early vaccine deployments, they will become the model example for future Lean Six Sigma workshops.

Somehow China and Russia have done in seven months what typically take seven years.

A Half-Baked Cost-Benefit Analysis

The following cost-benefit analysis is meant merely as a thought experiment and is not a formal exercise in risk management. However, it is intended to loosely approximate the analyses underlying the decision by the Chinese and Russians governments to accelerate their vaccine developments.

In the following analysis of an hypothetical early rollout vaccine, these assumptions were used:

  • The coronavirus infection fatality ratio equals 0.0084, the most recent CDC estimate (i.e., 0.84 percent of those who contract the virus will die).
  • All world citizens (7.8 billion) are vaccinated by the early rollout vaccine and at roughly the same time.
  • The early rollout vaccine has a fatality ratio of 0.0033 (i.e., 0.33 percent) — an extremely high ratio that would never be approved by a U.S. or European regulatory body.
  • Calculations of total coronavirus deaths (coronavirus deaths + vaccine deaths) are based on a vaccine effectiveness rates of 40%, 60%, 80%, and 90%. (Note: Most vaccines are between 85 and 95 percent effective, according to OurWorldInData.org)
  • A coronavirus-related estimate of worldwide deaths assumes everyone is either effectively vaccinated or ineffectively vaccinated. Among those ineffectively vaccinated, they will either die from the vaccination or contract the virus. Those with highly-adverse reactions to the vaccine are rolled into the vaccine fatality rate.
  • If no vaccine is ever developed, everyone contracts the virus at roughly the same point in time.
  • This analysis ignores retransmission.

Figure 2 shows the estimated total number of coronavirus-related worldwide deaths for each vaccine effectiveness rate. It is important to note that this is a near worst-case scenario in terms of the vaccine fatality rate (VFR). A vaccine with a VFR of 0.0033 would never be approved by regulators. In the real world, due to strict development requirements, vaccines are extremely safe and this hypothetical cost-benefit analysis is not meant to challenge that scientifically-supported fact.

Figure 2: Hypothetical Cost-Benefit Analysis of Early Rollout Vaccine

Image for post

Nonetheless, an analysis like the one in Figure 2 is being done across the dozens of pharmaceutical and research institutes working on a coronavirus vaccine right now.

Given that many epidemiologists are estimating that the herd immunity rate for the coronavirus is probably between 60 and 70 percent, a vaccine effectiveness rate less than that might not halt the epidemic.

But as Figure 2 shows, in a near worst-case scenario — a 60 percent effective vaccine with a high fatality rate — such a vaccine could save a net of 29 million people (i.e., the number of people who would have died without a vaccine [65.5 million] minus those who would die with a full vaccine rollout [36.4 million]).

Would you approve of a vaccine with that outcome? I wouldn’t. The Federal Drug Administration most certainly wouldn’t. But would China or Russia? Maybe.

The U.S. gross domestic product (GDP) shrank 9.5 percent in 2020 Quarter 2 due to the coronavirus. In the same period, the Organisation for Economic Co-operation and Development (OECD) area saw their economies fall by 9.8 percent.

As for China, its GDP fell 6.8 percent in 2020 Quarter 1 due to the coronavirus (though it did rise by 3.2 percent in 2020 Quarter 2, according to the Chinese government).

In turn, Russia has watched the price of oil — one of its most important exports — fall from $54-a-barrel in late-September 2019 (WTI crude) to $39-a-barrel (as of 22 Sep 2020). Likewise, natural gas prices have fallen from $2.43 (USD/MMBtu) in late-September 2019 (NYMEX natural gas futures) to $1.79 (USD/MMBtu) as of 22 Sep 2020.

Undeniably, China and Russia both depend heavily on a strong world economy, including economic activity with the U.S. and the OECD countries. The quicker the end to this pandemic, the sooner their economies can fully rebound.

And what about the billions of people in the developing world who are going to be among the last to get a coronavirus vaccine given that a small number of wealthy countries — representing just 13 percent of the world’s population — have already purchased 51 percent of the world’s coronavirus vaccine supply before its been approved and mass-produced?

If China and Russia have produced reasonably effective and safe coronavirus vaccines, they could become heroes to the developing world, who currently face the likely prospect of multinational pharmaceutical companies — that have already extracted billions of dollars from their governments to encourage production an effective coronavirus vaccine — extracting even more billions in profits once they produce an approved vaccine.

Still, a 60 percent effective vaccine under our simplifying assumptions here would still result in 36 million coronavirus-related deaths. That’s a lot. In nine months, the coronavirus has killed around 1 million people worldwide.

By rough comparison, AIDS/HIV has killed 33 million people worldwide since its identification in 1981 (or about 850,000 per year).

History has proven relatively wealthy people can tolerate large numbers of premature deaths as long as its not them. The real question is, will they tolerate China or Russia threatening profits of U.S and European pharmaceutical companies?

Vaccine Failures in the Past

In history, two vaccines are often cited as examples of how things can go wrong with vaccines rolled out too early or carelessly.

The “Cutter Incident” in 1955 resulted in 10 deaths and 164 cases of permanent paralysis after 200,000 people received a polio vaccine that had been improperly produced. That’s an adverse reaction rate of 0.09 percent. The “Cutter Incident” was 26 times more lethal than the 0.0033 percent vaccine fatality rate assumption made in this analysis.

In 1976, another vaccine debacle occurred in the U.S. where within 10 weeks approximately 45 million people were vaccinated for the “swine flu.” The vaccinations stopped however after few cases of the virus ever developed and around 450 Guillain-Barré syndrome cases emerged, resulting in 53 deaths (i.e., 0.001 percent of swine flu vaccine recipients had a highly-adverse outcome).

A personal anecdote:

My family received the swine flu vaccine in 1976 resulting in my father experiencing a severe allergic reaction to it. As told to him by his doctor, since my father had an egg allergy (though minor), he may have reacted to the swine flu vaccine because it had been grown in eggs. However, my father received many flu vaccines after that (and, in all likelihood, having been grown in eggs) and never had a similarly severe reaction.

A few afterthoughts

I want to emphasize this essay is not a tirade against vaccines or the value a strict regulatory standards in their development.

There is no substitute for good science.

But it appears the apparently premature rollout of a coronavirus vaccine in China will end in one of two outcomes: (1) an epic failure that will go down in history as how not to develop a vaccine during a global pandemic, (2) or the start of a revolution in how such vaccines will be developed and approved going forward.

Is it possible regulatory authorities in wealthy countries are too risk averse in applying laws, standards and rules regarding vaccine approvals? Given the many advancements in bioscience over the past two decades, can safe and effective vaccines in some cases be turned around from start to finish in under a year?

We may find out one way or another very soon.

  • K.R.K.

Comments can be sent to: nuqum@protonmail.com
or DM on Twitter at: @KRobertKroeger1

Why have the countries with the strictest coronavirus measures had the worst outcomes?

By Kent R. Kroeger (Source: NuQum.com; September 20, 2020)

[The data used in this essay is available on GITHUB]

The answer to the headline question is an easy one with a simple look at the international COVID-19 data: The countries hardest hit by the COVID-19 virus were forced to pursue the strictest suppression and mitigation (S&M) policies.

In causal language: The strictness of coronavirus policies increased as the crisis increased.

The national and international news organizations have continued to ignore this question and its answer under the assumption it encourages some — especially those of the conservative persuasion — to conclude such policies are ineffective, perhaps even counterproductive.

In hoping to protect us from “misinformation,” the news media is neglecting its role in explaining the most dangerous worldwide pandemic since the 1918 Spanish Flu Pandemic, and in doing so, is stunting an important public discussion on coronavirus S&M policies options.

As the data below within the most advanced economies tentatively shows, there is strong evidence that coronavirus S&M policies do work — though they may not have been pursued early or long enough to counterbalance the undeniable potency and elusiveness of SARS-CoV-2 (“the coronavirus”) and its associated disease (COVID-19). According to the evidence presented below, it takes at least three weeks for S&M policies to have an impact on containing the coronavirus.

In many cases, however, countries begin easing their S&M policies soon after new COVID-19 cases start declining.

The Stringency Index

Ourworldindata.org provides a lovely time-series data resource on the coronavirus S&M policies that have be pursued by countries since the pandemic’s start. For this analysis, I selected the Government Stringency Index, compiled by Oxford University’s OxCGRT Project (Thomas Hale, Sam Webster, Anna Petherick, Toby Phillips, and Beatriz Kira, Oxford COVID-19 Government Response Tracker, Blavatnik School of Government)

They describe their Government Stringency Index as follows:

The OxCGRT project calculate a Government Stringency Index, a composite measure of nine of the response metrics.

The nine metrics used to calculate the Government Stringency Index are: school closures; workplace closures; cancellation of public events; restrictions on public gatherings; closures of public transport; stay-at-home requirements; public information campaigns; restrictions on internal movements; and international travel controls.

You can explore changes in these individual metrics across the world in the sections which follow in this article.

The index on any given day is calculated as the mean score of the nine metrics, each taking a value between 0 and 100. See the authors’ full description of how this index is calculated.

A higher score indicates a stricter government response (i.e. 100 = strictest response). If policies vary at the subnational level, the index is shown as the response level of the strictest sub-region.

It’s important to note that this index simply records the strictness of government policies. It does not measure or imply the appropriateness or effectiveness of a country’s response. A higher score does not necessarily mean that a country’s response is ‘better’ than others lower on the index.

What makes the Stringency Index particularly helpful for policy analysis is that it is measured over time, giving analysts the ability to examine the dynamic relationship between government S&M policies and coronavirus outcomes (e.g.,  confirmed cases and deaths).

Figure 1 shows a summary of the Stringency Index for 29 countries. It should be noted I have not included mainland China in this analysis over questions about data quality. As most of the analyses below are at the within-country level, this exclusion does not affect my conclusions.

Figure 1: Summary of the Stringency Index for 29 countries (weekly data, 30 weeks)

Over 30 weeks of coronavirus data (obtained through Johns Hopkins University – CSSE), the Portugal, Italy, U.S., U.K., and Spain have, on a weekly average, maintained the strictest S&M policies. It is not a coincidence that these countries have also experienced the worst coronavirus outcomes (see Figures 2 and 3 below).

Conversely, Taiwan, Macao, Japan, Sweden, and Iceland have pursued the least strict S&M policies over the same period.

Figure 2: The Relationship between the Stringency Index and weekly changes in COVID-19 Confirmed Cases (per 1 million people)

There is a weak but statistically significant positive relationship between the strictness of coronavirus S&M policies and weekly changes in per capita COVID-19 confirmed cases, even with Taiwan and Macao removed from the analysis.

This does not mean strict S&M policies cause a rise in new COVID-19 cases. It merely reflects that countries hit hardest by the virus were impelled to adopt stricter lockdown policies. As the coronavirus continued to rise in the midst of those policy adoptions, countries respond accordingly by increasing the strictness of those policies.

Figure 3 below shows a similar pattern between the Stringency Index and weekly per capita changes in COVID-19 deaths. Though not statistically significant, it is interesting to note that Sweden is an outlier in this graph. Sweden chose a less strict S&M path and experienced coronavirus outcomes no different than some countries that pursed must stricter policies. In contrast, New Zealand, South Korea, Hong Kong, and Singapore chose strict S&M policies and achieved fewer coronavirus deaths per capita. [Soon we will better know the differences in economic outcomes in these countries — which may or may not offer some rationalization for Sweden’s deviant policy choices.]

Figure 3: The Relationship between the Stringency Index and weekly changes in COVID-19 Deaths (per 1 million people)

While the data like that in Figures 2 and 3 are often used by lockdown cynics to argue against such policies — and, full disclosure, I believe the final words on the effectiveness of lockdown and other S&M policies have not been close to being written — these charts tell us nothing about the impact of these policies.

We need to look at the data over time (I choose weekly-level data to eliminate some of the noise inherent in the coronavirus daily data) and see if there are statistically significant relationships between the strictness of S&M policies and coronavirus outcomes. For this effort, I focus mostly on weekly changes in COVID-19 cases (per 1 million people) in countries known to have eventually implemented sophisticated, wide-scale testing COVID-19 testing programs.

S&M Policies & Changes in COVID-19 Cases

The Appendix (below) contains cross-correlation function (CCF) plots for time lags in the Stringency Index and weekly changes in COVID-19 cases per capita for all 29 countries. However, for this essay I will highlight those countries most illustrative of this common relationship in the data: There is a contemporaneous, positive correlation between the strictness of government S&M policies and changes in COVID-19 cases.

But there is also another consistent feature in the data: Changes in COVID-19 cases are negatively associated with the strictness of government S&M policies around three weeks prior.

We can’t conclude for certain these government S&M policies are causing these declines in COVID-19 cases, but that is the clear implication. We also can’t say anything about the relative size of this impact, assuming it is causal.

How to Read CCF Plot: The cross correlation function is the correlation between the observations of two time series Xt and Yt, separated by k time units (the correlation between Yt+k and Xt). In this analysis, Y is the change in confirmed COVID-19 cases and X is the level of the Stringency Index. We use the cross correlation function to determine whether there is a relationship between two time series. To determine whether a relationship exists between the two series, look for a large correlation, with the correlations on both sides that quickly become non-significant. This plot also requires that the series are stationary and one is white noise.

The change in confirmed COVID-19 cases (Y) and the level of the Stringency Index (X) variables were first differenced prior to running the CCF plots in order to make the series stationary.

Figure 4: CCF Plot for Total Sample of 29 Countries (Change in Confirmed Cases and Stringency Index)

The CCF plots for Germany and Austria demonstrate this relationship at the country-level and that is roughly seen to various degrees for most of the 29 countries (see Figures 4 and 5).

Figure 5: CCF Plot for Germany (Change in Confirmed Cases and Stringency Index)

Figure 5: CCF Plot for Austria (Change in Confirmed Cases and Stringency Index)

While the CCF plots are suggestive of a meaningful relationship between S&M policies and changes in COVID-19 cases, we don’t know the strength of that association relative to other factors or the specific S&M policies that are most effective in containing the coronavirus.

Those questions won’t be definitively answered here, but we can get some clues.

Utilizing the panel data structure of our dataset (i.e., repeated measures of the same countries over time), I estimated a panel regression models with changes in COVID-19 cases as the dependent variable and the Stringency Index (lagged 0 and 3 months) and time (in weeks) as the independent variables. Dummy variables were also included for each country.

Figure 6 shows the statistical code used to generate the linear model and its output (in SPSS).

Figure 6: Panel Regression Model for Weekly Changes in COVID-19 Cases

The first table of interest in Figure 6 is the “Tests of Between-Subjects Effects.” All of the independent variables are statistically significant at the 0.05 alpha-level, except for time (WEEK).

The “partial ETA squared” column indicates the effect size for each independent variable and the sum effect of the 29 countries. By far, the sum of the country-specific effects (eta = 0.341) are most powerfully associated with changes in COVID-19 cases. Some countries have simply done a better job than others in implementing their S&M policies. Among the worst performers in that regard is the U.S., whose effect is contained in the intercept parameter (a = 613.2). In other words, compared to the average country in an average week, the U.S. has more 613 new COVID-19 cases per 1 million people.

In America’s defense, we have 50 different states (and the District of Columbia) implementing 50 different coronavirus S&M policies, with minimal central government control (compared to governments in other advanced economic countries).

The coronavirus pandemic may be one case where central government planning is an advantage.

The “Parameter Estimates” table reveals that the significant independent variables are in the expected direction. For example, the parameter for the Stringency Index (lagged 3 months) is negative (b = -0.399). When the Stringency Index goes up, COVID-19 cases go down.

The eta-squared (i.e. effect size) of the Stringency Index (lagged 3 months) is relatively small (eta = 0.061) compared to the country-specific effects (eta = 0.341), but that is in part due to the imperfect measurement of S&M policy strictness contained in the Stringency Index. In other words, an 80 index score in Germany is not necessarily the same as an 80 index score in the U.S. or Spain.

Unfortunately, the overall fit of the model (adjusted R-square = 0.375) also suggests S&M policies do not explain as much of the variation in new COVID-19 cases across countries as we would hope.

Clearly, the spread of the coronavirus is harder to control than governments would like (see Figure 2 above). Among the 29 countries analyzed in this essay, a few governments are doing it well (Taiwan, New Zealand, South Korea, Japan, Australia, Greece, Finland, Norway), and a few others are doing it less poorly (Germany, Denmark, Canada, Austria). But the rest are struggling.

Final Thoughts

With the recent death of Ruth Bader Ginsburg and the political tussle over President Trump’s SCOTUS nominee and resulting confirmation process, few realize another political tsunami may hit on October 2nd — the day the U.S. Commerce Department releases the 2020 Q2 GDP numbers at the state-level.

While no single economic data release can definitely answer the question — How have coronavirus suppression and mitigation policies affected the aggregate economy? — this upcoming data release should offer our best, most comprehensive state-level picture of the coronavirus pandemic’s impact on economic activity. And, inevitably, detailed comparisons of “red” state and “blue” state outcomes will ensue, along with the predictable political noise.

Admittedly and with deep regret, the conclusions drawn here about the positive impact of S&M policies on the spread of the coronavirus do not factor in their significant economic and social costs. Without conducting a fully-specified tradeoff analysis between S&M policies and their economic consequences, policymakers are ill-equipped to select the most effective measures that both contain the coronavirus and allow as much normal economic activity as possible.

Up to now, the news media, scientists, policy analysts, and political elites continue to come up short in this effort.

With the October 2nd release of U.S. state-level  GDP data, hopefully this neglect will be reversed, even if the data’s political implications help one party more than the other.

Forgive me if I keep my expectations low in that regard.

  • K.R.K.

Comments can be sent to: nuqum@protonmail.com
or DM me on Twitter at: @KRobertKroeger1


Appendix